


Abstract
Recent evidence has suggested that factors related to sensory perception may explain excess weight. The objective of this study was to consider multiple aspects while investigating the phenomenon of obesity. One goal was to compare taste acuity (taste threshold and density of fungiform papillae) in both normal weight and obese subjects. Thresholds for 4 basic tastes and the fat stimulus were investigated. A second research goal was to study the relationship between food neophobia and food liking according to the body mass index and taste sensitivity. The results showed that obese subjects seem to have higher threshold values and a reduced number of fungiform papillae than do normal weight subjects. Food neophobia did not vary with nutritional status, whereas differences were found for food liking, with obese subjects showing significantly higher liking ratings for high energy dense products compared with normal weight subjects.
Introduction
The complications and associated mortality of obesity are major public health issues world-wide ( WHO 2000 ). The pathology of obesity is considered as a disease with a multifactorial etiology that has a genetic basis but requires lifestyle influences to manifest ( Qi and Cho 2008 ). Diet certainly constitutes an important part of such environmental influences. Although it has been established that taste plays a pivotal role in food choice, acceptability ( Mennella et al. 2005 ; Laureati et al. 2015c ) and, thus, energy intake, the extent of specific taste perception in relation to weight status is not well understood. Past studies ( Malcolm et al. 1980 ; Frijters and Rasmussen-Conrad 1982 ) have failed to show any relationship between sweet thresholds and nutritional status, whereas more recent studies ( Simchen et al. 2006 ; Monneuse et al. 2008 ; Bertoli et al. 2014 ) described a difference between overweight and normal-weight subjects; in particular, a lower taste perception ability with an increase in weight has been found. It can be assumed that overweight and obese subjects might have a reduced or distorted sensory sensitivity that could increase the desire for and ingestion of food, thus leading to excessive energy intake and weight gain ( Donaldson et al. 2009 ). Instead, some reviews ( Mela and Rogers 1998 ; De Graaf 2005 ) have concluded that obese subjects exhibit “normal” chemosensory function and liking for specific tastes or aromas. These results show that the relationship between sensory perception and nutritional status remains unclear.
In addition to the study of the perception of basic tastes, attention has been recently focused on the perception of “fat,” which could be directly linked to obesity. First, is it possible to consider fat a taste? Observations from some studies suggest that “fatty” might actually be a quality of taste ( Mattes 2001 ; Nasser et al. 2001 ; Cooper et al. 2002 ; Kamphuis et al. 2003 ), even though preliminary human data ( Nasser et al. 2001 ; Kamphuis et al. 2003 ) were not satisfactory because of the difficulty in isolating a taste component. In fact, many physical and chemical attributes can provide a signal incorrectly interpreted as a “fatty” taste, such as oral irritation ( Verhagen et al. 2003 ), viscosity ( Mela and Rogers 1998 ), and lubricity ( Rolls et al. 1999 ). The perception of fat in relation to nutritional status has been investigated in some recent studies ( Stewart et al. 2010 , 2011 ; Stewart and Keast 2012 ) in which an inverse association between body mass index (BMI) and both fatty acid taste sensitivity and fat intake was found. Accordingly, a strong liking for highly fatty foods in subjects with higher BMI has been recently evidenced ( Deglaire et al. 2015 ). These findings suggest that decreased sensitivity to fats may be a factor that contributes to the pathogenesis of obesity, although it is important to recognize that causality cannot be inferred from association studies. However, other studies reported nonsignificant associations between fat sensitivity and weight status ( Salbe et al. 2004 ; Simchen et al. 2006 ; Alexy et al. 2011 ), thus underlining inconsistencies in literature data.
Food neophobia, defined as the reluctance to taste a new food ( Laureati et al. 2015a ), is another factor that has been suspected to be involved in the development of obesity. Food neophobics have less variety in their diet than do food neophilics ( Falciglia et al. 2000 ), which could clearly affect their energy intake and nutritional status. Literature data suggest that food neophobia is related to sensory sensitivity in adults ( Carter et al. 2000 ; Ullrich et al. 2004 ), with people having a higher sensitivity to taste stimuli being less open to food experience (i.e., neophobic attitude). If apparently taste sensitivity seems to be negatively related to BMI and positively related to food neophobia, then a relationship between food neophobia and nutritional status might be envisaged.
In this perspective, the first goal of the present research was to compare taste sensitivity in normal weight and obese subjects by evaluating taste thresholds for the 4 basic tastes (sweet, salty, sour, and bitter) and the fat stimulus. The density of the fungiform papillae (FP) in relation to nutritional status was also evaluated as additional measurement of taste acuity. We hypothesize that obese subjects could be less sensitive than normal weight subjects and maybe one factor that lead to this different perception might be related with the morphology of the tongue (e.g., FP).
A second research goal was to evaluate food liking and food neophobia according to subjects’ BMI in order to study the relationship between these variables and taste sensitivity. We expect that any difference in taste sensitivity in relation to the nutritional status could be reflected in a different attitude toward foods (e.g., prefer high energy foods and not have a varied diet).
Materials and methods
Participants
One hundred three adults gave informed consent and completed the study. Fifty-one ( N = 28 females, N = 23 males) obese (OB) patients admitted to the International Center for the Assessment of Nutritional Status (Università degli Studi di Milano, Italy) and 52 healthy volunteers of normal-weight (NW) ( N = 27 females, N = 25 males) were recruited. The exclusion criteria were individuals aged more than 65 years, individuals ageusia or subjects undergoing medical treatment that could modify taste perception. All subjects were invited to the sensory laboratory that was designed according to ISO guidelines ( ISO 8589 2007 ), before lunch from 12.00 to 13.00, and were assessed for their taste sensitivity (taste thresholds and fungiform papillae density) in preprandial condition. Subsequently, they were asked to complete a questionnaire concerning food neophobia and food liking. The entire session took approximately 1h. Data were collected using the Fizz v2.31 software program (Biosystemes).
Every subject was asked for informed consent before the assessments were made. The present study was performed according to the principles established by the Declaration of Helsinki, after the protocol was approved by the Institutional Ethics Committee of the University of Milan (protocol number 91/14).
Anthropometric assessment
Anthropometric evaluations were made by collecting body weight (to the nearest 0.1kg) and standing height (to the nearest 0.1cm) using the same calibrated scale on a telescopic vertical steel stadiometer (SECA 220), with the subjects dressed only in underwear. BMI was derived accordingly [weight (kg)/height (m 2 )]. Waist circumference was also measured (to the nearest 0.5cm) at the midpoint between the iliac crest and the last rib ( Lohman et al. 1988 ).
Taste sensitivity assessment
Stimuli for taste threshold evaluation
Sucrose, caffeine, sodium chloride, citric acid, and oleic acid were used to elicit sweet, bitter, salty, sour, and fat sensation tastes, respectively. Seven concentrations of each compound were prepared in mineral water (Levissima). The concentration range for each taste stimulus was chosen based on the threshold values reported in the literature ( Mojet et al. 2001 ; Bertoli et al. 2014 ). Concentration ranges were established such that the lowest concentration was clearly below and the highest concentration was clearly above the level at which subjects could detect or recognize the stimulus. Preliminary tests were carried out to adjust the concentration ranges because the subjects occasionally recognized the lowest concentration or did not recognize the highest concentration of the stimuli in some cases. The final concentration ranges (expressed in g/L) and dilution factors used to elicit the sensations are shown in Table 1 .
Compounds used to elicit the stimuli with relevant dilution step and concentration range
| Compounds | Concentration range (g/L) | Log steps | |
|---|---|---|---|
| Lowest | Highest | ||
| Sucrose | 0.16 | 40 | 0.4 |
| Sodium chloride | 0.06 | 4 | 0.4 |
| Caffeine | 0.003 | 2 | 0.4 |
| Citric acid | 0.33 | 50 | 0.5 |
| Oleic acid | 0.02 | 30 | 0.5 |
| Compounds | Concentration range (g/L) | Log steps | |
|---|---|---|---|
| Lowest | Highest | ||
| Sucrose | 0.16 | 40 | 0.4 |
| Sodium chloride | 0.06 | 4 | 0.4 |
| Caffeine | 0.003 | 2 | 0.4 |
| Citric acid | 0.33 | 50 | 0.5 |
| Oleic acid | 0.02 | 30 | 0.5 |
Sucrose, sodium chloride, citric acid, and caffeine (Sigma–Aldrich) were dissolved in water, prepared on the same day as the session and tested at room temperature. Initially, to study the sensitivity to fat, an emulsion of 5% w/v (1.8×10⁻¹M) oleic acid (OA, Sigma–Aldrich) in deionized water with 12% gum arabic (Sigma–Aldrich), 0.01% xanthan gum (Sigma–Aldrich), and 0.01% ethylenediaminetetraacetic acid (Sigma–Aldrich) was prepared ( Tucker et al. 2014 ). Subsequently, the OA concentration was reduced to 3% because we realized that it was an identifiable concentration during the initial tests. Oleic acid emulsion was prepared in 200mL batches by homogenization (IKA T18 Basic Ultra Turrax) for 20min at 15500rpm and then diluted by 0.4 log steps to create a range of 7 stimulus concentrations. Samples were made less than 24h before testing, stored under nitrogen in glass containers, and served at room temperature.
Procedure for taste threshold assessment
Taste thresholds were evaluated using the 3-AFC (3 alternative forced choice) method reported in ASTM E 679-04 (2004) . This standard describes a reliable procedure to determine a sensory threshold for any compound dissolved in any liquid. For each stimulus, participants were presented with 7 triads of samples marked with 3-digit numbers. Each triad consisted of 1 cup containing the stimulus and 2 cups containing an equal volume of a blank solution (mineral water). The 7 triads proceeded from a weaker to a progressively stronger concentration, and the position of the cup containing the stimulus was randomized over trials and assessors. For each triad, participants were instructed to indicate which sample was different from the other 2 ( ASTM E 679-04 2004 ). If the assessors were uncertain, they were instructed to guess (forced choice procedure). At the beginning of each session, and before each triad, the assessors were instructed to rinse their mouth with mineral water. To mask the visual and olfactory component (particularly regarding the samples containing emulsions of oleic acid in water), the entire evaluation was carried out under red light and with a nose clip. The individual threshold for each sensory stimulus was calculated as the geometric mean of the concentration at which the last miss occurred and the next higher concentration that was correctly recognized ( ASTM E 679-04 2004 ). Participants were asked not to smoke, eat, or drink anything except water before the test.
Fungiform papillae assessment
The fungiform papillae density was measured according to Nachtsheim and Schlich (2013) . The subjects’ tongues were stained with a blue food dye (F.lli Rebecchi, Color Dolci). A circle of filter paper (6mm diameter) was placed on the center of the tongue approximately 1–2cm from the tip. Several photos of the tongue were taken using a 12-megapixel digital camera (FUJIFILM USA, Inc.) in a brightly light room using the camera’s macro mode with no flash. The best photograph was selected to measure the papillae density, and Adobe Photoshop was used to mark the area in which papillae were to be counted according to Bakke and Vickers (2011) . To do this, 3 circles were drawn in the front of the anterior tongue using the filter paper as a template ( Figure 1 ). The FP were counted inside the marked circles. Only FP that were at least 50% inside a circle were counted. The FP were counted independently by 3 researchers. There was no significant difference ( F = 2.07; P = 0.13) between the researchers’ counts, so the mean of the counts was calculated.
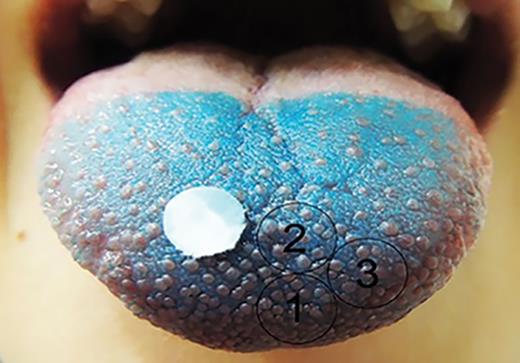
Example of image taken for FP count showing the placement of the template (6mm diameter) and the 3 counted areas.
Food neophobia assessment
The Food Neophobia Scale (FNS), which was developed by Pliner and Hobden (1992) was translated into Italian ( Table 2 ). In the first stage of the study, the original version was carefully examined to establish whether the items, vocabulary and response format would be appropriate for Italian adults. The wording for some items had to be changed slightly to retain the same meaning as the original items. Some of the items in other studies on food neophobia were also slightly changed such that they were meaningful to the study participants ( Flight et al 2003 ; Henriques et al. 2009 ; Siegrist et al. 2013 ; Laureati et al. 2015a ). The FNS consists of ten statements, such as “I don’t like new foods,” each offering 7 graded response alternatives, from “strongly disagree” (1) to “strongly agree” (7). Half of the statements are worded in reverse relative to food neophobia, so responses to these statements were reversed when calculating the score. The FNS score was calculated as a sum of the responses, yielding a range of 10–70. The items indicated with R in Table 2 were reversed.
Original English items of the food neophobia scale, and Italian translation of the items
| English items | Italian items |
|---|---|
| 1. I am constantly sampling new and different foods (R) | 1. Mangio costantemente cibi nuovi e diversi dal solito (R) |
| 2. I do not trust new foods | 2. Non mi fido di nuovi alimenti |
| 3. If I do not know what is in a food, I won’t try it | 3. Se non conosco un alimento, non lo provo |
| 4. I like foods from different countries (R) | 4. Mi piacciono i cibi provenienti da diversi paesi (R) |
| 5. Ethnic food looks too weird to eat | 5. Il cibo etnico mi sembra strano |
| 6. At dinner parties, I will try a new food (R) | 6. Ai pranzi e cene con gli amici mi piace assaggiare cibi che non conosco (R) |
| 7. I am afraid to eat things I have never had before | 7. Ho paura a mangiare qualcosa che non ho mai assaggiato prima |
| 8. I am very particular about the foods I will eat | 8. Sono molto schizzinoso quando si tratta di mangiare |
| 9. I will eat almost anything (R) | 9. Mangerei quasi tutto (R) |
| 10. I like to try new ethnic restaurants (R) | 10. Mi piace provare ristoranti etnici (R) |
R, reversed items.
Food liking assessment
Each subject completed a 26-item food liking questionnaire. The subjects were asked to indicate their liking on a linear scale anchored at the extremes “I don’t like it at all” (rated 0) to “I like it a lot” (rated 10) for the following food categories: vegetables (e.g., carrots, broccoli and tomatoes); fruits (e.g., banana, cherry and apple); carbohydrates (e.g., pasta, bread and rice); seasonings (e.g., butter and olive oil); meat and fish (e.g., white meat, red meat and fish); dairy products (e.g., milk, cheese); and sweets (e.g., chocolate, snacks). The products were chosen based on their energy content: “low energy dense” (<100 kcal/100g) and “high energy dense” (>100 kcal/100g).
Statistical analysis
The matrix of the correct and incorrect answers produced separately by each judge was used to calculate the individual taste threshold. The geometric mean of the value to the last wrong answer and the first correct answer was chosen to represent the best estimate of the threshold for each subject ( ASTM E 679-04 2004 ). After verifying that taste sensitivity, food liking and food neophobia data were normally distributed, independent t -tests were performed to compare normal weight and obese subjects. Statistical analysis was performed using STATGRAPHICS PLUS v.16 software (Manugest KS Inc.). To further interpret the relationship between sensitivity and food neophobia, the subjects were divided according to their level of taste acuity for each sensation and FP into 2 groups: “highly sensitive” (adults with a taste threshold less than the median taste threshold group and FP density above or equal than the median FP density group; sweet: 1.61g/L, salt: 0.35g/L, bitter: 0.03g/L, fat: 0.14g/L; 0.61g/L and FP: 13); “less sensitive” (adults with taste threshold above or equal to the median taste threshold group and FP density less the median FP density group; sweet: 1.61g/L, salt: 0.35g/L, bitter: 0.03g/L, fat: 0.14g/L; 0.61g/L and FP: 13).
Results
Characterization of participants
The characteristics of the population investigated are presented in Table 3 . Normal weight and obese subjects were balanced according to gender (χ 2 = 1.58; P = 0.21) and age ( t = 1.72; P = 0.09).
Characteristics of study participants (data are reported as mean values ± SD or counts)
| All ( n = 103) | Normal weight ( n = 52) | Obese ( n = 51) | |
|---|---|---|---|
| Sex (F:M) | 55:48 | 27:25 | 28:23 |
| Age (years) | 40.17±10.79 | 38.38±11.65 | 42.00±9.61 |
| Height (m) | 1.69±0.11 | 1.72±0.10 | 1.66±0.11 |
| Weight (kg) | 79.44±19.60 | 64.25±10.19 | 94.92±13.92 |
| BMI (kg m −2 ) | 27.76±7.10 | 21.57±1.95 | 34.08±4.29 |
Taste sensitivity assessment
The mean taste threshold values and the mean of fungiform papillae density in NW and OB subjects are shown in Figure 2 . Significant differences between NW and OB subjects were found for all taste stimuli (sweet taste: df = 101, t = 3.48, P = 0.0002; salty taste: df = 101, t = 2.98, P = 0.003); bitter taste: df = 101, t = 3.00, P = 0.003; fat sensation: df = 101, t = 4.42, P = 0.00002, sour taste: df = 101, t = 2.15, P = 0.03) and for FP density (df = 101, t = 4.04, P = 0.0001). OB subjects showed higher threshold values and a reduced number of FP compared with NW controls.
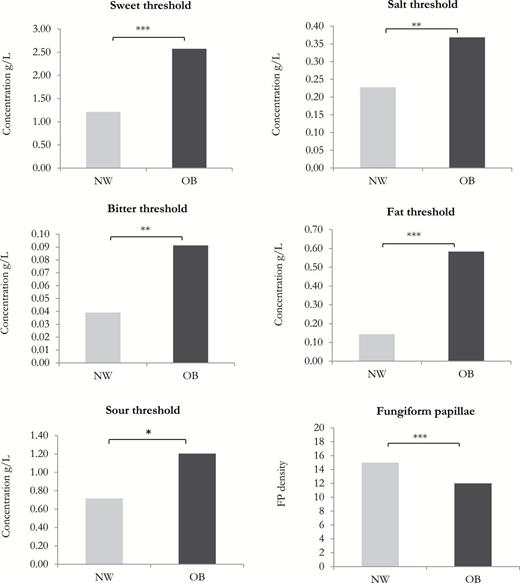
Mean taste thresholds (g/L) and mean FP density in relation with nutritional status. Means that differ at significant levels of P < 0.05, P < 0.01, and P < 0.001 are indicated by *, **, and ***, respectively.
Food neophobia assessment
Internal consistency was satisfactory (Cronbach’s alpha = 0.83; n = 10). No significant differences were detected in the food neophobia scores among subjects according to nutritional status (NW = 28.21±9.80; OB = 28.59±9.82). To investigate the relationship between taste sensitivity and BMI, the subjects were divided into 2 groups according to their level of taste acuity for each taste and for FP density: “high sensitivity” and “low sensitivity.” As observed in Table 4 , the only significant difference in food neophobia scores (df = 101, t = 2.85, P = 0.005) between the 2 groups was found for the salty taste, with high sensitive subjects being more neophobic than the low sensitive.
Neophobia index (mean value ± SD) in relation with taste sensitivity: “low sensitive” and “high sensitive”
| Taste thresholds | Food neophobia score | t | P | |
|---|---|---|---|---|
| Low sensitive | High sensitive | |||
| Sweet | 28.60±10.06 | 28.23±9.64 | 0.19 | 0.848 |
| Salty | 25.6±9.43 | 30.82±9.47 | 2.85 | 0.005 |
| Sour | 28.64±10.47 | 28.29±9.57 | 0.16 | 0.870 |
| Bitter | 29.4±9.06 | 27.49±10.34 | 1.01 | 0.315 |
| Fat | 29.27±9.92 | 27.54±9.63 | 0.91 | 0.364 |
| FP | 28.34±10.18 | 25.93±10.60 | 1.78 | 0.077 |
Value in bold shows the significant differences.
Food liking assessment
Mean hedonic ratings for the different product categories for NW and OB subjects are reported in Table 5 . Subjects differed in their liking for carbohydrates, seasoning, and animal derivatives. OB had significantly higher scores than did NW for these product categories.
Mean hedonic ratings ± SD in normal weight and obese subjects
| Food category | Normal weight ( n = 52) | Obese ( n = 51) | t | P |
|---|---|---|---|---|
| Carbohydrates | 7.01±2.67 | 7.91±1.47 | 2.11 | 0.04 |
| Seasoning | 5.07±2.28 | 6.03±2.24 | 2.17 | 0.03 |
| Sweets | 5.43±1.96 | 6.14±2.10 | 1.78 | 0.08 |
| Fruits | 6.58±2.03 | 7.02±2.17 | 1.04 | 0.30 |
| Dairy products | 6.22±2.67 | 6.59±2.60 | 0.70 | 0.50 |
| Animal derivatives | 6.29±2.33 | 7.42±2.00 | 2.63 | 0.01 |
| Vegetables | 5.83±1.84 | 6.23±1.94 | 1.05 | 0.30 |
Values in bold show the significant differences.
The foods investigated in the liking questionnaire were also categorized according to energy density: “low energy dense” (<100 kcal/100g) and “high energy dense” (>100 kcal/100g). The mean liking data for OB and NW subjects are reported in Figure 3 . As can be seen, NW and OB subjects appeared to be comparable for “low energy dense” products (df = 101; t = −1.05; P value = 0.29), whereas OB subjects showed a significantly higher liking for “high energy dense” products (df = 101; t = −2.51; P value = 0.01) than did NW subjects.
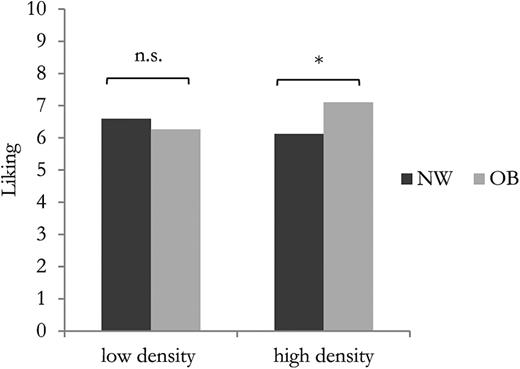
Mean hedonic ratings for “low energy dense” and “high energy dense” products in relation to subjects’ nutritional status. Means that differ at significant levels of P < 0.05 are indicated by *.
Discussion
The sensory properties of food are important determinants of food choice. Taste sensitivity varies among individuals, and even when several studies have described differences between obese and nonobese subjects concerning taste perception, the data are contradictory and insufficient.
The first purpose of this study was to compare the taste sensitivity (taste thresholds and fungiform papillae density) in obese and nonobese adults. The hypothesis that obese and nonobese adults differ in their taste sensitivity was confirmed in the present investigation, with obese subjects showing a significantly lower sensitivity than normal weight controls for all tastes and for the fat sensation. Recent evidence has suggested that overweight and obese individuals are less sensitive to fatty acids; hence, this reduced taste acuity might lead to the consumption of excess dietary energy and weight gain ( Stewart et al. 2010 , 2011 ). However, some studies have reported no significant association between fat sensitivity and weight status ( Salbe et al. 2004 ; Alexy et al. 2011 ). Mattes (2009) suggested that the sense of taste and the somatosensory system in the oral cavity are considered to be the main pathways involved in fat perception. Both sensory systems have a common anatomical unit: the fungiform papilla. Taste buds in the FP contain fatty acid receptors ( Galindo et al. 2012 ) and mechanoreceptors ( Whitehead and Kachele 1994 ). Thus, a higher amount of FP may increase the perception of fat via enhanced tactile and chemosensory perception. Currently, there is little information about the effect of the number of FP on fat perception. Only Hayes and Duffy (2007) investigated the relationship between the number of FP on the tongue tip and the perception of the fat-related attribute creaminess, showing that subjects with a higher FP count gave higher creaminess ratings to milk–cream mixtures. Moreover, the FP density seems to be correlated not only with the perception of fat but also with taste acuity in general. In fact, a growing body of evidence suggests that lingual tactile perception and taste sensitivities covary and reflect individual differences in the density and diameter of fungiform papillae ( Essick et al. 2003 ). This hypothesis seems to be supported by our results, showing that the density of FP is higher in lean subjects, who are also more sensitive than obese subjects to basic tastes and fat sensation.
Our findings agree with most of literature data indicating that obese subjects are less sensitive to both the sweet ( Bartoshuk et al. 2006 ; Simchen et al. 2006 ; Overberg et al. 2012 ) and bitter ( Tepper and Ullrich 2002 ; Goldstein et al. 2005 ) tastes than are normal weight subjects. However, in other studies, no association between sweet ( Salbe et al. 2004 ; Alexy et al. 2011 ) and bitter ( Kaminski et al. 2000 ; Yackinous and Guinard 2002 ; Drewnowski et al. 2007 ) tastes acuity and weight status was found, and 1 study even reported a positive relationship ( Paquet et al. 2010 ). Little is known about the sensitivity to salt and sour tastes in relation to the body weight. Evidence for reduced thresholds in obese subjects for salty ( Simchen et al. 2006 ; Overberg et al. 2012 ) and sour ( Simchen et al. 2006 ; Bertoli et al. 2014 ) tastes are found in the literature, but again, the results are often contradictory, with studies reporting either no relationship between BMI and sensitivity ( Alexy et al. 2011 ; Overberg et al. 2012 ) or a positive relationship ( Paquet et al. 2010 ).
The relationship between sweet, salty, sour, or bitter tastes and weight status is still unclear ( Cox et al. 2015 ). The discrepancy between studies may be attributable to differences in the techniques used to measure taste perception. In particular, the differences could be due to the different stimuli used to elicit the tastes.
In addition to the different abilities to perceive taste stimuli in relation to BMI we also found that obese subjects seem to prefer energy dense food more than normal weight subjects. The hypothesis that overweight and obese people have a greater liking for certain types of taste stimuli that contributes to an excess energy intake has been explored previously ( Mela and Rogers 1998 ), and, in agreement with our results, such studies have generally reported a positive relationship between liking and both fat-sweet content and high-calorie products ( Cox et al. 2015 ). In particular, fat preference may have a greater influence on body mass compared with sweet preference. In this context, literature data indicate that obese women may prefer foods that are less sweet but higher in fat compared with normal-weight women ( Drewnowski et al. 1985 ). This difference could be due to genetic and behavioral factors, but this relationship is still under discussion.
Obviously, not only factors related to taste perception could lead to weight gain. Evidence suggests that body weight could be related to personality traits such as food neophobia ( Raudenbush et al. 2003 ). Food neophobia might manifest itself as a limited variety of food in the diet, thus leading to a reduced overall food intake and, in turn, to a reduced energy intake; in contrast, food neophobics could prefer to consume traditional food with a higher energy density compared with healthier food, which results in a higher BMI ( Laureati et al. 2015b ). However, the results of the present study did not find any relationship between BMI and food neophobia, a finding that was already observed in children ( Laureati et al. 2015b ) and young adults ( Knaapila et al. 2011 ).
Regarding the relationship between food neophobia and taste acuity, it seems from our work that people who are sensitive to salty taste are significantly more neophobic than less sensitive individuals, which suggests that higher taste sensitivity might lead to neophobic reactions. Our results are in agreement with literature data reporting that taste sensitivity for bitterness is positively related to food neophobia ( Carter et al. 2000 ).
In conclusion, we evaluated, in a sample of reasonable dimension, several determinants that could be involved in weight gain. From our results obese subjects differed in terms of taste sensitivity from normal weight controls and that these differences might lead to a different pattern of food preferences. More specifically, obese people that seem to be less sensitive to taste stimuli and have a reduced number of FP may have an increased need for food to compensate for their chemosensory deficit. Food neophobia seems to play a marginal role in discriminating subjects according to BMI and taste sensitivity. Thus, being more open to new food experiences seems to have no relationship with weight gain.
Several limitations should be considered when evaluating the results of this study. First, the 2 groups of individual haven’t been matched on other possible factors that may affect their performance as attitudes towards foods, restraint eating, taste and health attitudes and also cognitive factors affecting their attention ( Laureati et al. 2008 ). Second, we evaluated taste thresholds and not olfactory thresholds, which could be useful to investigate in a more exhaustive way subjects’ perception. Third, taste sensitivity measured by taste detection threshold values in water are not representative of real foods, thus future researches are needed to study the different perceptions in models foods and considering all the sensory modalities. Fourth, we used a single stimulus for each sensation; it might be interesting to examine whether different stimuli affect the results. Fifth, the assessment of food liking was made without actually administering the product. These aspects should be considered in future investigations of the perceptive and behavioral determinants of obesity.
Acknowledgments
We would like to thank Dr. Diana Osio, Dr. Valentina Giustizieri, and Dr. Lidia Lewandowski (International Center for the Assessment of Nutritional Status (Università degli Studi di Milano, Italy), who provided help in recruiting obese subjects and the students Chiara Rota, Camilla Perego, and Andrea Borsa for the help in the experimental phase.
References
Laureati M, Morin-Audebrand L, Pagliarini E, Sulmont-Rossé C, Köster EP, Mojet J. 2008. Food memory and its relation to age and liking: an incidental learning experiment with children, young and elderly people. Appetite . 51:273–282.
Laureati M, Pagliarini E, Gallina Toschi T, Monteleone E. 2015c. Research challenges and methods to study food preferences in school-aged children: a review of the last 15 years. Food Qual Prefer . 46: 92–102.
