


Abstract
Motivation: An early use of gene-expression data coming from microarrays was to discover non-linear multivariate intergene relationships. Pursuing this direction, the motivation for this paper is 2-fold: (1) to discover and elucidate multivariate logical predictive relations among gene expressions in a dataset arising from radiation studies using the NCI 60 Anti-Cancer Drug Screen (ACDS) cell lines; and (2) to demonstrate how these logical relations based on coarse quantization reflect corresponding relations in the continuous data.
Results: Using the coefficient of determination, a large number of logical relationships have been discovered among genes in the NCI 60 ACDS cell lines. Moreover, these relationships can be seen directly in the original continuous data, and many are robust relative to the thresholds used to obtain the logical data from the continuous data. A key observation is that a number of intergene relationships appear to be considerably stronger when p53 is functional as compared to when it is not, which is consistent with earlier findings in the literature.
Availability: The appendix is available at http://gsp.tamu.edu/Publications/supplement.htm
Contact: edward@ee.tamu.edu
1 INTRODUCTION
Our purpose in this paper is 2-fold: (1) to discover and elucidate multivariate logical predictive relations among gene expressions in a dataset arising from radiation studies using the NCI 60 Anti-Cancer Drug Screen (ACDS) cell lines; and (2) to demonstrate how these logical relations based on coarse quantization closely reflect corresponding relations in the continuous data. The first goal relates to our desire to discover multivariate gene expressions that go beyond correlative relationships previously discovered in the data and to our interest in finding candidate genes from which to build genetic regulatory networks. The second goal is to address the manner and extent to which logical relations among the quantized expression levels reflect numerical relations among the analog data, the latter being more directly related to the actual mRNA concentrations governing transcription.
Correlation can identify pairwise genetic coregulative responses to a particular stimulus; however, correlation does not address the fundamental problem of determining sets of genes whose actions and interactions drive the cell's decision to set the transcriptional level of a particular gene. Transcriptional control is accomplished by a complex method that interprets a variety of inputs (McAdams and Shapiro, 1995; Evans and Littlewood, 1998). Hence, it is necessary to apply analytical tools that detect multivariate influences on decision making present in complex genetic networks. This demand has motivated the use of the coefficient of determination (CoD) to measure the strength of relation between a set of predictor genes and a target gene (Dougherty et al., 1999, 2000; Kim et al., 2000). In these applications working with cDNA microarray data, the continuous numerical expression data has been reduced to ternary logical data via a method of internal standardization (Chen et al., 1997). In essence, relative to a given target gene and set of predictor genes, the CoD measures the relative increase in predictive capability using the predictor-gene expressions as opposed to predicting the target-gene expression based only on knowledge of the target gene's isolated behavior across the dataset. Reduction to logical data accomplishes the kind of extreme compression necessary to apply predictive analysis with small samples typical of microarray experiments and facilitates the understanding of predictive relations based essentially on an up-regulated/down-regulated paradigm.
As to the second goal of the present paper, if binary or ternary relations are sufficient to describe a predictive relation between predictor and target genes, then one might expect that the logical functions are discernable within the continuous, pre-quantized data. After all, the hypothesis is that somehow the ON–OFF model sufficiently characterizes the multivariate relations between mRNA concentrations, at least to the extent that these concentrations themselves characterize transcriptional control. This issue is key for gene regulatory networks based on logical functional relationships, such as Boolean networks (Kauffman, 1993) and their extension to probabilistic Boolean networks (Shmulevich et al., 2002). It will be demonstrated using the NCI 60 cell lines that, in fact, strong predictive (high CoD) functions discovered in the ternary context have counterparts for the continuous data.
Several studies have been carried out in the past using the NCI 60 ACDS. We summarize a few representative cases and highlight the differences between the present work and the relevant earlier studies. In O'Connor et al. (1997) the integrity of the p53 tumor suppressor pathway in the cell lines of the NCI 60 ACDS was characterized using different measures of p53 functionality: (1) the sequence of the corresponding gene; (2) the stress induction of p53 related genes such as GADD45, MDM2 and WAF1; (3) the ability to induce growth in a p53 deficient yeast assay; and (4) the ability to arrest in the G1 phase following γ-irradiation. In addition, the sensitivity of the cell lines to different chemotherapeutic agents was correlated with their p53 status and the conclusion was that for most chemotherapeutic agents (except for the anti-mitotics), the presence of functional p53 resulted in enhanced chemosensitivity. Despite the useful characterization of p53 status for the ACDS provided in O'Connor et al. (1997) the correlation analysis used to relate chemosensitivity to p53 status is only a first step in trying to understand such relationships. The fact that in a subsequent paper using NCI cell lines (Amundson et al., 2000) individual correlations were calculated between the basal expression levels of 10 transcripts, the p53 status and chemosensitivity to different agents is an indication of the awareness that, in general, the relationships are multivariate in nature. For instance in Amundson et al. (2000) it was discovered that, in addition to the positive correlation between p53 status and chemosensitivity established earlier (O'Connor et al., 1997), an even stronger negative correlation exists between basal levels of BCLX and chemosensitivity. Another example is the apparent abnormality in the p53 signaling pathway reported in Bae et al. (1996) where certain wild-type p53 Human Melanoma cell lines failed to show appreciable induction of GADD45 upon γ-irradiation. It is possible that factors other than p53 status alone could be determining GADD45 induction and the apparent abnormality could be reconciled by using multivariate tools from the outset.
The preceding discussion justifies studying the gene-expression data from the NCI ACDS using multivariate tools such as CoD analysis. We will go a step further and use the data to establish Boolean relationships; to our knowledge, this step has not been carried out previously. Here it is appropriate to point out that the results in this paper are concerned with coarse modeling from data, unlike the Molecular Interaction Maps (Kohn, 1999), which are tools for conveniently representing the detailed interaction between molecules. We believe that both of these techniques will have a complementary role to play as we seek to unravel the complex signaling pathways between biological molecules.
The paper is organized as follows: in Section 2, we provide an intuitive discussion of the CoD technique that we use to ferret out intergene relationships. In Section 3, we provide a description of the data and its subsequent processing. Section 4 presents several instances of the existence of Boolean relationships between different genes. In Section 5, we discuss the apparent role of the tumor suppressor gene p53 in altering the inter-gene relationships. Finally, Section 6 summarizes our main conclusions and outlines the directions for future research.
2 COEFFICIENT OF DETERMINATION
The CoD technique has at least three advantages over standard correlation analysis. First, the CoD can be applied to multiple predictors, thereby giving it the ability to discern multivariate inter-gene relationships. Second, the CoD can discover both linear and non-linear relationships, whereas the correlation coefficient only addresses linear relationships. For instance, if gene G1 has the expression pattern (0,0,0,1,1,0) across six cell lines and gene G2 has the corresponding expression pattern (1,1,−1,0,0,−1), then the relation G1 = 1 − G22, is picked up by the CoD, with CoD = 1, but not picked up by the correlation coefficient, with Corr = 0. A third advantage of the CoD is that, whereas the correlation coefficient is independent of the order, the CoDs for G1 predicting G2 and G2 predicting G1 can be substantially different. For instance, in the example just given, the CoD of G2 predicting G1 is 1, whereas the CoD for G1 predicting G2 is only 1/2.
3 THE DATA AND ITS PROCESSING
The data for the current study has been obtained from radiation experiments conducted on cell lines from the NCI 60 ACDS. The NCI 60 ACDS is a set of about 60 human cancer cell lines maintained at the National Cancer Institute. These cell lines have been derived from cancers of the colon, breast, ovary, lung, kidney, prostate, central nervous system, skin and bone marrow, and serve as a screen for determining the efficacy of compounds proposed as anti-cancer agents.
Sixty four cell lines from the NCI 60 ACDS were irradiated with high doses of ionizing radiation and harvested ∼4 h later. Microarrays were produced by printing cDNA PCR products onto coated glass slides. A set of 6392 probes was printed, resulting in a set of 6000 genes, some of which were replicates. In order to determine whether members of this set of genes show a response to irradiation, total RNA was isolated from non-irradiated and irradiated parallel cultures of each cell line, labeled with different fluorophores, and simultaneously hybridized to the microarray. The genes that had responsiveness in at least six cell lines were selected. A gene was considered to be responsive if the irradiated-to-non-irradiated expression ratio was higher than the induction threshold of 1.8 or below the repression threshold of 0.5. In this way, we identified about 1000 genes for further analysis. However, among this set, there were many genes with a large percentage of missing values [quality factor <0.3] (Chen et al., 2002) corresponding to different cell lines. The results would suffer substantial inaccuracy if the missing-value estimation for these genes were to be used. Thus, from the set of 1000 genes, we removed all genes having poor quality data in more than 20% of the cell lines, used missing-value estimation [kNNN impute (Troyanskaya et al., 2001)] on the remaining gene expression ratios, and ternarized the estimated data using the induction (+1) threshold 1.8 and the repression (−1) threshold 0.5. CoD analysis was applied to the ternarized data to identify relationships between several genes responsive to ionizing radiation. These results are discussed in the next section. Since the intergene relationships tend to be non-linear and multivariate in nature, the CoD technique is more appropriate than bivariate correlation analysis.
The method used to choose the thresholds is based upon an estimate of the variance of genes that typically do not change their expression levels by a large amount in many different cellular circumstances. The levels chosen represent a 99% confidence that the level of change observed represents a change from the non-irradiated value, and thus a response by the cell. Since this experiment contains a fair number of genes whose transcriptional response to radiation is known, and their responses are faithfully categorized by the chosen thresholds, we believe that it is a reasonable yardstick to apply to these cells' responses to radiation. Even so, since the logical relations we obtain depend on the thresholds, as discussed, we consider robustness relative to the thresholds.
4 SOME BOOLEAN RELATIONSHIPS
We examined all genes that have a significantly lower CoD when predicting a target individually than when predicting in conjunction with other genes. Specifically, we require that gene G1 predicting gene G3 and gene G2 predicting gene G3 have individual CoD values at least 0.25 lower than the CoD of genes G1 and G2 together predicting gene G3. This identifies genes that in combination can significantly, more strongly predict a particular target gene than individually. Were we not to require individual low CoDs together with a high joint CoD, we would obtain many high joint CoDs resulting from simply adjoining any gene to a gene possessing high individual CoD. We note that an analogous effort to find strong multivariate gene classification, when there is significantly weaker single-gene classification, has been considered for gene-expression classification of gliomas (Kim et al., 2002); however, while the issue there was constructing phenotypic classifiers based on continuous data, the focus here is on constructing logical functions to predict gene activity insofar as a gene is upregulated or not.
A large number of logical relationships has been discovered, 557 for two-gene cases (CoD > 0.65) and 483 for three-gene cases (CoD > 0.8); however, many of these are not robust to threshold. The threshold robustness figures for all of these cases are available at the companion website. We give some illustrative examples in the following sections.
A natural question arises: is there reason to expect that the rules found here represent what is really happening, rather than a chance occurrence due to the large number of combinations of multiple genes? To address this issue, Monte Carlo Simulations have been carried out by generating random data containing the same number of genes (496) and cell lines (64) as used for the actual data. The mean and variance of the randomly generated data are equal to the mean and variance of the actual data. The same thresholds are used to process the random data as for the actual data. If we use the same cutoff CoD of 0.65 for two-gene predictors, then the random data provides only one such relationship, with CoD = 0.727. There are no other CoDs > 0.6. This compares to 557 two-gene predictions with CoD > 0.65, possessing individual CoDs at least −0.25 less than the two-gene CoD, when using the original data. Moreover, for single-gene predictors, there is a maximum CoD of 0.375 for random data, whereas, for the original gene-expression data, the maximum CoD is 0.85. Details are available on the companion website.
4.1 Examples of OR logic
To further investigate the relationship between the three genes, we have produced the expression plots in Figure 1a, where the blue, green and red bars represent the expression levels for MRC1, HTR2C and VSNL1, respectively. In this plot, only those cell lines are shown where at least one of the predictors or target is non-zero. The black horizontal lines denote the thresholds for ternarizing, which are 1.8 for +1 and 0.5 for −1. Note that there are no −1 values. The plot demonstrates the OR relation between the target and the predictors in most of the cell lines. Thus, if either of the predictors is high, then the target gene-expression level is also high, and that while individual prediction by a single predictor may not be very reliable, a combined prediction is quite accurate. This relationship is quite robust to changes in threshold as shown by the coefficient of robustness in Figure 2a, where we have only plotted around the threshold for induction because there are no repressed cell lines for these genes.
A second instance of OR logic appears if we consider the gene small inducible cytokine A7 (monocyte chemotactic protein 3) (SCYA7) as the target and the genes prosaposin (variant Gaucher disease and variant metachromatic leukodystrophy) (PSAP) and ribosomal protein L3 (RPL3) as the predictors. The CoD for the predictor combination is 0.875 while the individual CoDs are <0.65. Figure 1b shows the OR-type relationship on the data. Here, the blue, red and green bars represent the genes SCYA7, PSAP and RPL3, respectively. The coefficient of threshold robustness (Fig. 2b) suggests robustness to threshold changes.
A third instance of OR logic occurs with the genes adenomatosis polyposis coli (APC) as a target and the genes integrin, alpha L antigen CD11A p180 (ITGAL) and Homo sapiens mRNA for TL132 as predictors for APC. The CoD for predicting APC by the other two genes is 0.4 in both the cases; the CoD is 0.8 when used together to predict APC.
4.2 Example of AND logic
4.3 Example of EXOR logic
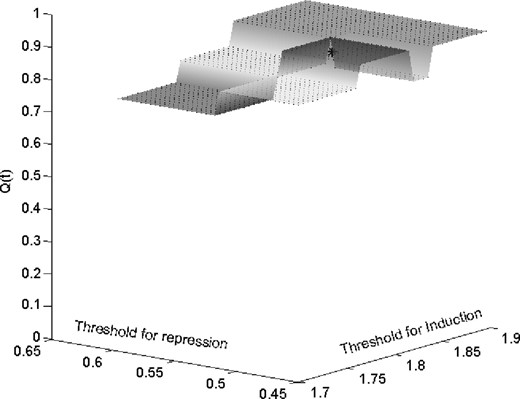
When the genes MRC1 and interleukin 18 (interferon-gamma-inducing factor) jointly predict the target gene enoyl-Coenzyme A, hydratase/3-hydroxyacyl Coenzyme A dehydrogenase (EHHADH), the output behaves as an XOR (exclusive OR) function of the inputs. This is clear from the plot shown in Figure 1d, where the blue, red and green bars represent expression levels for EHHADH, Interleukin18 and MRC1, respectively. If both predictors are upregulated or if both are 0, then the target is also 0. It appears that Interleukin18 can be a suppressor for EHHADH whenever MRC1 is upregulated. The Boolean XOR relation is shown in Table 3 and the coefficient of robustness is shown in Figure 3. The x- and y-axes show the thresholds for induction and repression, respectively, while the z-axis shows the CoD, which always stays above 0.65 for small changes in threshold values.
4.4 Boolean relationships among four genes
We now consider a situation in which there are three predictor genes. Figure 1e shows the relationship among three predictors and a target gene. The red, green, gray and blue bars represent the genes Homo sapiens clone TCCCTA00151 mRNA sequence (mRNA), platelet factor 4 (PF4), bradykinin receptor B2 (BDKRB2) and the target gene MRC1, respectively. The relationship shows that the target gene is upregulated when one or two predictors are upregulated, but when all the predictor genes are upregulated the target is not induced. The Boolean relationship is shown in Table 4. Figure 4 shows the coefficient of threshold robustness relative to the upper threshold and indicates stability with respect to small changes in the induction threshold. We do not consider the repression threshold because almost all values are either 0 or 1.
For another Boolean relationship between four genes, consider the genes albumin (ALB), EHHADH and thyroid hormone receptor-associated protein (TRAP150) predicting the gene APC. From the data, they predict APC with a CoD of 1. The data suggest that when gene TRAP150 is repressed, APC cannot be induced. APC is induced when either ALB or EHHADH is induced and TRAP150 is not repressed.
Another strong relationship among genes is depicted in Figure 1f, where the red, green, grey and blue bars represent islet cell autoantigen 1 (69 kDa) (ICA1), syndecan 2 (heparan sulfate proteoglycan 1, cell surface-associated, fibroglycan) (SDC2), heterogeneous nuclear ribonucleoprotein L (HNRPL) and the target MRC1, respectively. This relationship is quite robust with changes in threshold for both repression and induction, as shown in Figure 5. The CoD stays >0.75 for small changes in threshold values.
5 ROLE OF p53 STATUS
In our data, there are 20 cell lines with functional p53 and 44 cell lines with mutant p53. The definition of the status of the p53 tumor suppressor pathway is precisely characterized in the previously mentioned study (O'Connor et al., 1997). In most cases, the gene had an incapacitating mutation, leading to observable loss of normal function. When the function is lost, there is no difference between loss by mutation or loss by inability to express the gene.
We have divided the expression data into two sets, one in which p53 is functional and the other in which it is mutant, have analyzed both sets separately, and have concluded that there are stronger intergene predictive relationships when p53 is functional than when p53 is mutant. For each dataset, all 2- and 3-gene predictor sets are considered for all targets. Figure 6 shows the probability distribution functions of the CoD values. The dashed and solid curves give the probability distribution functions of the CoD values for the wild-type p53 and the mutant p53 cell lines, respectively. We observe that for wild-type p53 the average and maximum CoD values exceed the corresponding values for mutant p53 cell lines. We next present a few specific instances of genes whose behavior seems to depend on the p53 status.
Genes TATA element modulatory factor 1 (TMF1), cyclin T2 (CCNT2), polymerase (DNA directed), delta 3 (POLD3) and guanylate binding protein 1, interferon-inducible, 67 kDa (GBP1) are induced when p53 is not active but they stay dormant when p53 is active. These genes might play a role when the tumor suppressor (p53) is inactive. On the other hand, some genes show little responsiveness when p53 is mutant and display considerable variability when p53 is wild type. Instances of such genes are serum-inducible kinase (SNK), tumor necrosis factor receptor superfamily (TNFRSF10C), UDP glycosyltransferase 2 family, polypeptide B10 (UGT2B10), properdin P factor, complement (PFC), ST14, PHLDA3, damage-specific DNA binding protein 2(DDB2), XPC and Killer/DR5.
Gene RAD52 homolog is predicted with a CoD of 1 by an EST [moderately similar to LCP2 (human lymphocyte cytosolic protein 2)] when p53 is active but the CoD falls to 0 when p53 is mutant. Corresponding relationships exist in the unquantized gene-expression data.
Gene PPM1D is mostly 0 when p53 is mutant; however, when p53 is active it has large variations. Other genes can predict these variations quite well. The CoD for genes centromere protein A (CENPA) and 4-hydroxyphenylpyruvate dioxygenase (HPD) predicting PPM1D is 0.85 when p53 is active. The strength of this relationship is borne out by the plot in Figure 7, where the dashed and solid curves represent PPM1D and CENPA, respectively. There appears to be an inverse relationship between these two genes.
The data furnish many other examples where p53 status is crucial for good prediction. For the gene CENPA, there are many variations when p53 is mutant but these are not predicted strongly by other genes. The best two-gene predictor gives a CoD of 0.545 when p53 is mutant but when p53 is active, it gives a CoD of 0.83. Similar relationships hold for gene PPP2R5A. When p53 is mutant, the best CoD value is 0.35, whereas the best CoD increases to 0.75 when p53 is functional.
6 CONCLUSION
We have used experimental data to discover logical relationships between genes, which are consistent with the current paradigms for modeling genetic regulatory networks that depend on the premise that genes interact with each other by means that can be described logically. The results of the current study using cancer cell-line data show that, not only do such relationships exist, but they can also be unearthed via the CoD technique. Another important observation that follows from the data is that several of the relationships unearthed between the different genes seem to be considerably stronger when p53 is functional compared with when it is not. This is consistent with earlier findings in the literature. For instance, as noted in the previous section, gene PPM1D is mostly 0 when p53 is mutant, but when p53 is active PPMID has large variations that can be predicted by other genes. This is consistent with the knowledge that p53 is involved in the regulation of PPM1D, as is the inverse relationship between PPM1D and CENPA (Bulavin et al., 2004). Another example is the known interaction between WAF1 and p53 (Amundson et al., 2000), which in this study is manifested by the CoDs for p53 predicting WAF1 and WAF1 predicting p53 both exceeding 0.85. The results reported in this paper lay the groundwork for further studies using the NCI 60 ACDS. A promising research direction currently under way is to use gene-expression data to construct networks that can then be used to design and evaluate possible intervention strategies for cancer treatment (Datta et al., 2003).
Truth table showing the relationship MRC1 = VSNL1 ∨ HTR2C
| VSNL1 | HTR2C | MRC1 |
|---|---|---|
| 0 | 0 | 0 |
| 0 | 1 | 1 |
| 1 | 0 | 1 |
| 1 | 1 | 1 |
| VSNL1 | HTR2C | MRC1 |
|---|---|---|
| 0 | 0 | 0 |
| 0 | 1 | 1 |
| 1 | 0 | 1 |
| 1 | 1 | 1 |
Truth table showing the relationship MRC1 = VSNL1 ∨ HTR2C
| VSNL1 | HTR2C | MRC1 |
|---|---|---|
| 0 | 0 | 0 |
| 0 | 1 | 1 |
| 1 | 0 | 1 |
| 1 | 1 | 1 |
| VSNL1 | HTR2C | MRC1 |
|---|---|---|
| 0 | 0 | 0 |
| 0 | 1 | 1 |
| 1 | 0 | 1 |
| 1 | 1 | 1 |
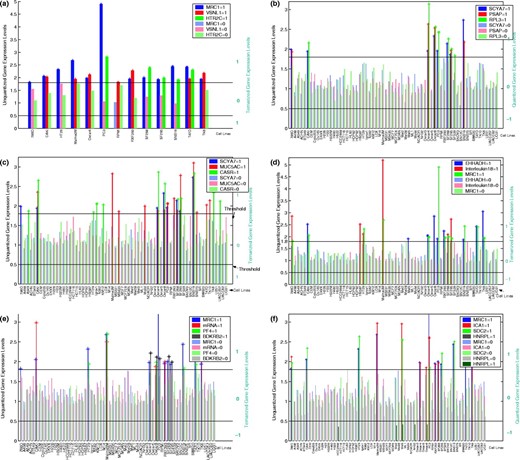
Boolean relationship graphs. (a) OR relationship. (b) Another OR relationship. (c) AND relationship. (d) Exor relationship. (e) Relationship among four genes. (f) Another relationship among four genes.
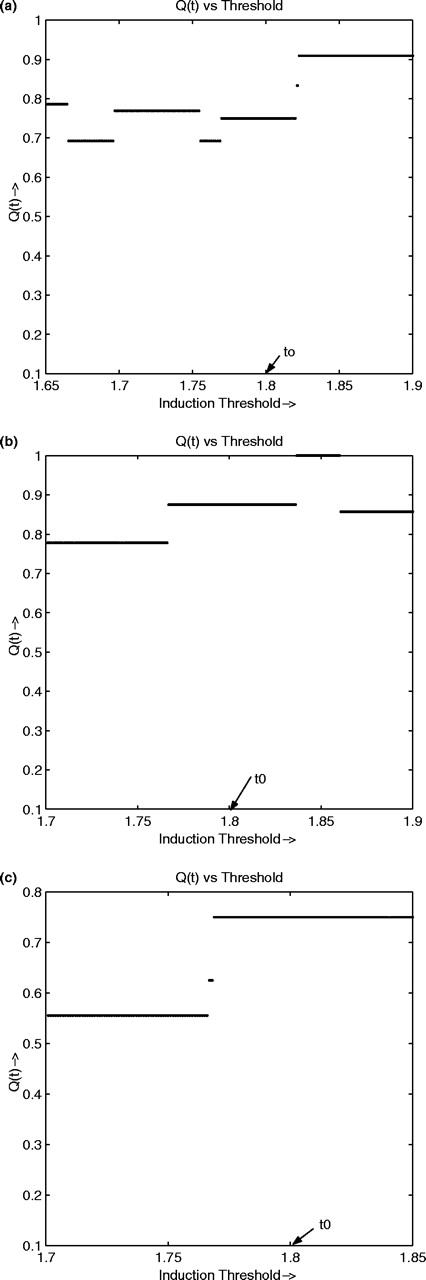
Q(t) for OR and AND relationships. (a) Q(t) around 1.8 for MRC1. (b) Q(t) around 1.8 for SCYA7. (c) Q(t) for AND function.
Truth table showing AND relationship: SCYA7 = CASR * MUC5AC
| MUC5AC | CASR | SCYA7 |
|---|---|---|
| 0 | 0 | 0 |
| 0 | 1 | 0 |
| 1 | 0 | 0 |
| 1 | 1 | 1 |
| MUC5AC | CASR | SCYA7 |
|---|---|---|
| 0 | 0 | 0 |
| 0 | 1 | 0 |
| 1 | 0 | 0 |
| 1 | 1 | 1 |
Truth table showing AND relationship: SCYA7 = CASR * MUC5AC
| MUC5AC | CASR | SCYA7 |
|---|---|---|
| 0 | 0 | 0 |
| 0 | 1 | 0 |
| 1 | 0 | 0 |
| 1 | 1 | 1 |
| MUC5AC | CASR | SCYA7 |
|---|---|---|
| 0 | 0 | 0 |
| 0 | 1 | 0 |
| 1 | 0 | 0 |
| 1 | 1 | 1 |
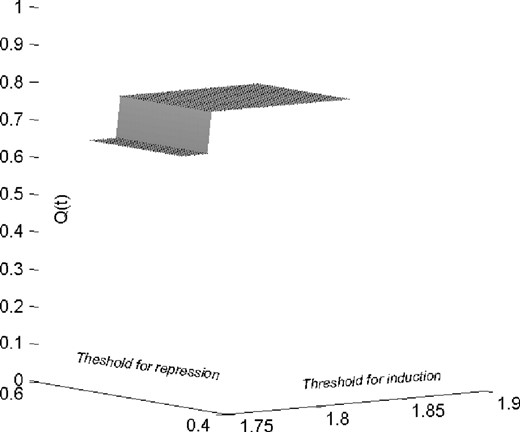
Q(t1, t2) for EXOR function.
Truth table showing EXOR relationship EHHADH = MRC1 ⊕ Interleukin18
| MRC1 | InL | EHHADH |
|---|---|---|
| 0 | 0 | 0 |
| 0 | 1 | 1 |
| 1 | 0 | 1 |
| 1 | 1 | 0 |
| MRC1 | InL | EHHADH |
|---|---|---|
| 0 | 0 | 0 |
| 0 | 1 | 1 |
| 1 | 0 | 1 |
| 1 | 1 | 0 |
Truth table showing EXOR relationship EHHADH = MRC1 ⊕ Interleukin18
| MRC1 | InL | EHHADH |
|---|---|---|
| 0 | 0 | 0 |
| 0 | 1 | 1 |
| 1 | 0 | 1 |
| 1 | 1 | 0 |
| MRC1 | InL | EHHADH |
|---|---|---|
| 0 | 0 | 0 |
| 0 | 1 | 1 |
| 1 | 0 | 1 |
| 1 | 1 | 0 |
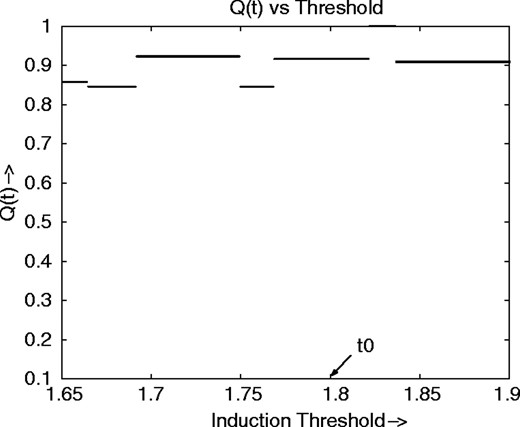
Q(t) for four-gene relationship.
Truth table for relationship among four genes
| mRNA | PF4 | BDKRB2 | MRC1 |
|---|---|---|---|
| 0 | 0 | 0 | 0 |
| 0 | 0 | 1 | 1 |
| 0 | 1 | 0 | 1 |
| 0 | 1 | 1 | 1 |
| 1 | 0 | 0 | 1 |
| 1 | 0 | 1 | 1 |
| 1 | 1 | 0 | 1 |
| 1 | 1 | 1 | 0 |
| mRNA | PF4 | BDKRB2 | MRC1 |
|---|---|---|---|
| 0 | 0 | 0 | 0 |
| 0 | 0 | 1 | 1 |
| 0 | 1 | 0 | 1 |
| 0 | 1 | 1 | 1 |
| 1 | 0 | 0 | 1 |
| 1 | 0 | 1 | 1 |
| 1 | 1 | 0 | 1 |
| 1 | 1 | 1 | 0 |
Q(t1, t2) for four-gene relationship.
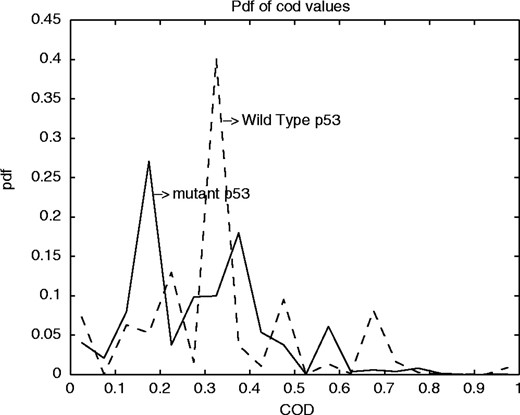
Probability distribution functions of the CoD values: the dashed and solid curves give the pdfs of the CoD values for the wild-type p53 and the mutant p53 cell lines respectively.
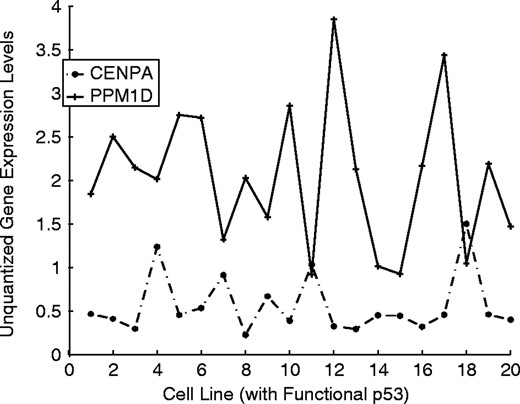
CENPA and PPM1D.
REFERENCES
Amundson, S.A., Myers, T.G., Scudiero, D., Kitada, S., Reed, J.C., Fornace, A.J.
Bae, I., Smith, M.L., Zhan, Q., Friend, S.H., O'Connor, P.M., Fornace, A.J.
Bulavin, D.V., Phillips, C., Nannenga, B., Timofeev, O., Donehower, L.A., Anderson, C.W., Appella, E., Fornace, A.J.
Chen, Y., Dougherty, E.R., Bittner, M.L.
Chen, Y., Kamat, V., Dougherty, E.R., Bittner, M., Meltzer, P.S., Trent, J.M.
Datta, A., Choudhary, A., Bittner, M.L., Dougherty, E.R.
Dougherty, E.R., Kim, S., Chen, Y.
Dougherty, E.R., Bittner, M., Chen, Y., Kim, S., Sivakumar, K., Barrera, J., Meltzer, P., Trent, J.M.
Kauffman, S.A.
Kim, S., Dougherty, E.R., Bittner, M.L., Chen, Y., Sivakumar, K., Meltzer, P., Trent, J.M.
Kim, S., Dougherty, E.R., Shmulevich, I., Hess, K.R., Hamilton, S.R., Trent, J.M., Fuller, G.N., Zhang, W.
Kohn, K.W.
O'Connor, P.M., Jackman, J., Bae, I., Myers, T.G., Fan, S., Mutoh, M., Scudiero, D.A., Monks, A., Paull, K., Sausville, E.A., et al.
Shmulevich, I., Dougherty, E.R., Zhang, W.

