


Abstract
Behaviors are commonly correlated between individuals in so-called “behavioral syndromes.” Between-individual correlations of phenotypic traits can change the trajectories of evolutionary responses available to populations and even prevent evolutionary change if underpinned by genetic correlations. Whether behavioral syndromes also influence the course of evolution in this manner remains unknown. Here, we provide the first test of the degree to which evolutionary responses might be affected by behavioral syndrome structure. This test, based on a meta-analysis of additive genetic variance–covariance matrices, shows that behavioral syndromes constrain potential evolutionary responses by an average of 33%. For comparison, correlations between life-history or between morphological traits suggest constraints of 13–18%. This finding demonstrates that behavioral syndromes might substantially constrain the evolutionary trajectories available to populations, prompts novel future directions for the study of behavioral syndromes, emphasizes the importance of viewing syndrome research from an evolutionary perspective, and provides a bridge between syndrome research and theoretical quantitative genetics.
Introduction
The emergence of behavioral syndrome research as an important topic in behavioral ecology marks a profound shift in the field (Dall et al. 2004; Bell 2007; Wolf et al. 2007; Dingemanse, Kazem, et al. 2010; Réale et al. 2010). The existence of “behavioral syndromes”—operationally defined here as between-individual correlations among behaviors (Dingemanse, Kazem, et al. 2010; Dingemanse, Dochtermann, et al. 2012; Dingemanse and Dochtermann 2013)—has stimulated behavioral ecologists to consider animal behavior from a multivariate rather than univariate perspective (Sih et al. 2003; Sih, Bell, Johnson, et al. 2004). This shifting perspective integrates with existing evolutionary theory, particularly theory developed by quantitative geneticists, and has caused some syndrome researchers to speculate whether syndromes might constrain evolutionary responses (Bell 2005; Dochtermann and Jenkins 2007; Dingemanse et al. 2009; Dochtermann and Roff 2010; Dochtermann 2011; Dingemanse, Barber, et al. 2012).
In evolutionary biology, it is recognized that correlations between traits have the potential to dramatically affect and constrain evolutionary responses (Lande 1979; Lande and Arnold 1983; Blows and Hoffmann 2005; Walsh and Blows 2009). Consistent with this expectation, early behavioral syndrome research considered whether syndrome structure might impose constraints on evolution (Bell 2005). This was done by asking whether the behavioral correlations that define syndromes are underpinned by genetic correlations (e.g., Bell 2005; van Oers et al. 2005) and whether or not behavioral correlations were consistent across populations (Bell 2005; Dingemanse et al. 2007; Pruitt et al. 2010). These findings implied that behavioral syndrome structure can evolve and that this structure did not ultimately impose long-term evolutionary constraints on evolution. Specifically, differences among populations in the strength or even direction of a behavioral correlation (Bell 2005; Bell and Sih 2007; Dingemanse et al. 2007)—often in accordance with ecological factors—imply that these correlations can change during the evolutionary divergence of populations. However, rather than a complete prevention of evolution, the effects of correlations on evolutionary responses can be manifested more subtly on ecological (i.e., short term) timescales through a change to the trajectories and rates of evolutionary change available to populations (Blows and Hoffmann 2005; Blows 2007; Roff and Fairbairn 2007; Walsh and Blows 2009). For example, if 2 traits are positively correlated at the genetic level, this correlation can hinder the ability of a population to respond to selection in the opposite direction of the correlation when compared with the response when traits are uncorrelated (Figure 1). If behavioral syndromes have this effect, then they represent potential constraints on evolutionary responses by which some evolutionary responses are prevented or reduced. However, it has not yet been investigated whether the genetic contributions to behavioral syndromes have sufficient power to constrain short-term adaptive evolution in this manner.
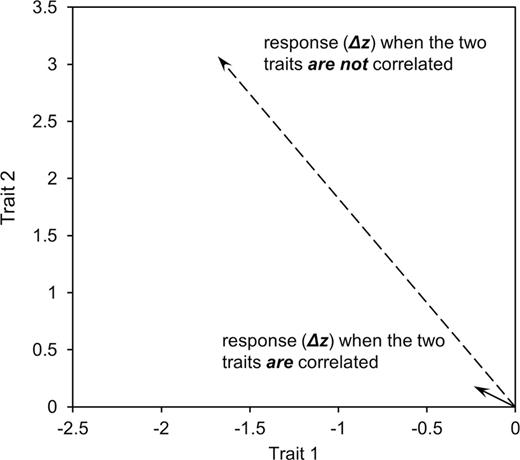
A graphical example of how trait correlations can affect responses to selection. Plotted is the response of 2 populations, both of which have average trait values of 0 for 2 different traits. In one population, the 2 traits are positively correlated (r = 0.9, solid line) and in the other, the 2 traits are uncorrelated (dashed line) and both populations have the same additive genetic variances for each trait (but which differ between traits). If both populations are exposed to selection of the same strength favoring negative values of one trait and positive values of the other 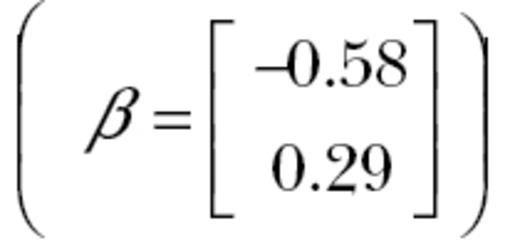 , the correlation between the traits will affect responses to selection. In the population where the traits are not correlated, the population’s average moves from 0 and 0 to −1.7 and 3.1 for traits 1 and 2, respectively. In the population where the 2 traits are correlated, the population only moves to −0.24 and 0.18 for traits 1 and 2, respectively.
In this study, we tested the degree to which behavioral syndromes can act as potential constraints on the evolutionary responses of populations. We analyzed 35 additive genetic covariance matrices from a diverse set of taxa, including birds, fish, and insects (Table S1) and calculated the degree to which behavioral syndromes constrain the ability of populations to respond to selection. We calculated the degree of constraint using the metric autonomy ( ), which provides a general measure of potential constraint (Hansen and Houle 2008) and estimates the relative ability of a population to respond to selection versus if there were no genetic correlations among traits.
Methods
Data acquisition
To determine whether behavioral syndromes can constrain responses to selection, we estimated the degree of evolutionary constraint attributable to the genetic component of behavioral syndromes. We did so based on published estimates of behavioral additive genetic correlation or covariance matrices. We conducted 2 literature searches to obtain estimates of additive genetic correlations. First, we searched specific journals for published estimates of genetic correlations among behaviors. The details of this literature review are provided elsewhere (Dochtermann 2011). Second, we identified all articles that cited influential reviews by Sih, Bell, and Johnson (2004) and Sih, Bell, Johnson, et al. (2004) on the evolutionary and ecological implications of behavioral syndromes. Combined these searches identified approximately 900 articles. Each publication was reviewed and, when available, genetic correlations or covariances among behaviors extracted. Estimates of behavioral genetic correlations that were opportunistically available were also included (6 of the available correlation and covariance matrices). Because of the relatively modest number of studies available for analysis, we did not differentiate between “temperament” traits (cf. Réale et al. 2007) or other behavioral groupings in our analyses. All extracted correlations/covariances were used in our analyses regardless of significance because evolutionary constraint is a property of overall covariance matrices and the inclusion of only significant correlations would have led to a biased (i.e., over) estimate of evolutionary constraint. We also recorded the sample size on which each correlation/covariance matrix was based. We excluded 7 correlation/covariance matrices that had correlations estimated as ≥|1| (a statistical artifact found in some quantitative genetic studies). This resulted in 35 behavioral genetic covariance matrices from 15 independent studies and a broad representation of animal taxa (Table 1 and Table S1).
Classes and species included in the analysis of evolutionary constraint
| Class | Species | Studies | Number of behaviors |
|---|---|---|---|
| Actinopterygii | Gasterosteus aculeatus | 4 | 2–3 |
| Aves | Parus major | 2 | 2 |
| Aves | Tachycinetas bicolor | 1 | 2 |
| Branchiopoda | Daphnia spp. | 1 | 4 |
| Insecta | Drosophila melanogaster | 1 | 2 |
| Insecta | Grylus firmus | 1 | 2 |
| Insecta | Nicrophorus vespilloides | 1 | 3 |
| Mammalia | Canis familiaris | 1 | 4 |
| Mammalia | Mus musculus | 1 | 6 |
| Mammalia | Ovis canadensis | 1 | 2 |
| Reptilia | Thamnophis ordinoides | 1 | 2 |
Further details of and references for the data sets are available in Table S1.
Calculating evolutionary constraint
Determining whether trait correlations affect evolutionary trajectories and responses is not a trivial issue in evolutionary biology (Hansen and Houle 2008; Agrawal and Stinchcombe 2009; Walsh and Blows 2009; Conner 2012). Importantly neither the additive genetic variance in a single trait nor a single bivariate additive genetic correlation between 2 traits accurately indicates how populations will, or even if they can, respond to selection (Blows and Hoffmann 2005; Roff and Fairbairn 2007; Conner 2012). Indeed, certain evolutionary responses can be unavailable even when all correlations are <|1| (Roff and Fairbairn 2007; Conner 2012).
Instead of focusing on single correlations or the average of all correlations, the response of populations to selection can be better understood by examining the multivariate structure of the additive genetic variances of and additive genetic covariances among traits (Blows and Hoffmann 2005; Blows 2007). Among evolutionary biologists, these variances and covariances are summarized in what is known as the additive genetic variance–covariance matrix (G) which, along with knowledge of the relationship between traits and fitness, allows the prediction of how populations will respond to selection (Lande 1979; Lande and Arnold 1983). To understand how the multivariate structure of G might affect evolutionary responses, the first step is to calculate G’s “eigenvalues.” Eigenvalues are commonly encountered by behavioral ecologists as the unrotated components calculated as part of a principal components analysis. The calculation of eigenvalues allows the identification of “directions in multivariate trait space in which no genetic variance is available, even though all traits exhibit genetic variance” (Blows 2007). Eigenvalues of zero correspond to combinations of traits for which there is no available variation and thus correspond to directions selection cannot move populations toward. For example, if 3 traits—X, Y, and Z—are considered, there will be 3 directions in which phenotypic responses occur: x, y, and z. In this example, we would be evaluating variation in tridimensional space. The number of traits, k, defines the dimensions of phenotypic space, and the potential for change possible in this space will be reduced by nonzero correlations and reflected in the eigenvalues.
Hansen and Houle (2008) present several methods for estimating evolutionary constraint based on the calculation of eigenvalues of which “autonomy” ( ) is particularly appropriate for understanding the evolutionary impacts of behavioral syndromes.
  estimates the relative reduction in potential evolutionary change as imposed by trait correlations: an
  of 1 would represent no constraint on evolutionary trajectories and an
  of 0 would correspond to situations in which populations cannot respond at all in at least one direction of k-dimensional phenotypic space (e.g., z for our 3 traits above). Intermediate values of
  can be thought of as the proportional ability to respond to selection throughout k-dimensional space relative to if all correlations were zero. Informally, autonomy can be viewed as the overall average degree of evolutionary constraint, integrated across all possible selection gradients and directions, that is attributable to nonzero genetic correlations. Here, we used
  to estimate the degree to which populations may be constrained from responding to selection due to behavioral genetic correlations.
Although evolutionary metrics like autonomy are typically evaluated against null expectations of maximal independence (i.e.,  = 1) (Simonsen and Stinchcombe 2010; Stinchcombe et al. 2010; Teplitsky et al. 2011), such a null is not appropriate for our questions for 2 key reasons. First, differences between traits in genetic variances alone will lead to an estimate of autonomy below 1, even if all covariances are exactly zero (Hansen and Houle 2008). We were instead interested solely in the effects of the covariances between traits. Second, sampling error will result in estimates of genetic covariances that are not equal to zero even if the true genetic covariances were zero, which would also result in an estimate of autonomy below 1. To estimate appropriate null expectations for autonomy, we, therefore, generated 1000 random variance–covariance matrices separately for each observed covariance matrix (we used the same procedure for correlation matrices). Each random matrix was calculated from random data (with a sample size equal to that used for an observed matrix) generated according to a multivariate normal distribution with the study’s observed variances but with covariances set to zero. For each batch of 1000 random matrices, we then calculated the mean of autonomy. This mean estimate then served as a null expectation for a specific observed autonomy. For the 35 observed matrices, corresponding null autonomies ranged from 0.9152 to 0.9995 (i.e., 8.48 to 0.05% below the expected value of 1, thus ignoring this facet would lead to an overestimate of constraint). We adjusted the observed autonomies to these null expectations by multiplying the observed values by 1/null autonomy and used these adjusted autonomies in subsequent analyses. As an example, for the Navarro population of three-spined stickleback studied by Bell (2005) (Table S1), the observed estimate of autonomy was 0.455, whereas the null autonomy was 0.939. This translates to an adjusted autonomy of 0.485 (0.455×1/0.939). This procedure thus produced conservative estimates of evolutionary constraint that did not suffer from the increased inaccuracy and type I error that would otherwise occur. Both raw and adjusted autonomies are presented in Table S1.
Because most published estimates were presented as standardized matrices (i.e., correlation rather than variance–covariances matrices), we tested whether it was appropriate to calculate autonomy based on correlation matrices. We generated 500 random covariance matrices for 2–10 traits (with an average absolute correlation of 0.5) for a total of 4500 matrices. We then calculated autonomy for each covariance matrix and its associated correlation matrix. Autonomy estimates for covariance versus correlation matrices were highly concordant (rs = 0.96; n = 4500; P « 0.001). Despite this concordance, as expected (because all genetic variances in the generating matrix equaled 1), a regression of autonomy estimates from correlation matrices over corresponding autonomy estimates from covariance matrices demonstrated that simulated estimates of autonomy were consistently, albeit only slightly, higher when derived from correlation compared with covariance matrices (β0 = 0.03; t4498 = 15.15; P « 0.001). Correlations should thus tend to overestimate autonomy and underestimate constraint. This difference was statistically addressed by including matrix type (correlation/covariance) as a fixed effect in the subsequent analysis detailed below.
Statistical analysis
We estimated the mean (and standard error) of autonomy across studies with a mixed-effect model using the study-specific adjusted autonomy values detailed above. Because some studies provided multiple matrices—and thus multiple autonomy estimates—we included “study” (n = 15 levels) as a random effect to account for nonindependence among estimates within studies. The species we included in our analysis (Table 1) were so distantly related that a robust complete phylogeny was not available. We, therefore, instead used a “taxonomic mixed model” approach wherein hierarchical taxonomic levels are included as random effects (Hadfield and Nakagawa 2010). Because of lack of replication across family and genus levels, we included only an organism’s class, order, and species designation as random effects. We also estimated the relative amount of variation in autonomy that could be partitioned to between-study, between-class, between-order, or between-species differences as I2 (as explained by Nakagawa and Santos 2012). We also included the number of correlations or covariances (centered) in a matrix and the type of matrix (correlation vs. covariance) as fixed effects. The grand mean (i.e., intercept) was estimated for correlation matrices as they were more frequently reported than covariances (Table S1). The mixed-effect model was fit with restricted maximum likelihood using the lme4 library in R (R Development Core Team 2011). All fixed effects, including the grand mean, were evaluated using 2-sided t-tests (Crawley 2007). Unambiguous methods for the calculation of degrees of freedom are currently lacking for mixed-effect models (Baayen et al. 2008), and in our case, the degrees of freedom ranged up to 35. Therefore, we used a conservative approach and set the degrees of freedom for calculating P values to 9 (15 studies minus 2 for the fixed effects, minus 4 for the random effects). The mean adjusted autonomy derived from this model was then tested versus a null expectation of 1. By asking whether mean autonomy differed from 1, we asked the biological question of whether behavioral syndromes significantly constrain the potential of populations to respond to selection.
Results
The mean estimated value of autonomy across additive genetic correlation matrices ( ) was 0.67±0.08. This value significantly differed from 1 (t9 = 4.29; P < 0.005; Figure 2). Our meta-analysis, therefore, demonstrated that the additive genetic behavioral correlations that constitute the genetic component of “behavioral syndromes” lead to an approximate 33% reduction in the ability of populations to respond to selection in multivariate space. Neither the number of behavioral correlations or covariances in a matrix (t9 = 1.58; P = 0.15) nor the type of matrix (correlation vs. covariance; t9 = −0.76; P = 0.47) significantly affected our estimate. Variation in the magnitude of autonomy primarily differed between studies and between species (
 ,
,  ) or was not explained by the random effects included (
 ).
).
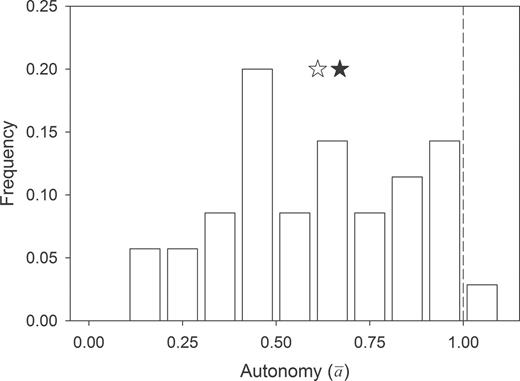
Distribution of autonomy ( ) estimates for the 35 genetic covariance matrices. The open star is the observed median autonomy (0.61), and the filled star is the restricted maximum likelihood estimated mean autonomy. The estimated mean controls for the number of correlations in a matrix (included as a fixed effect) and for the lack of independence among autonomy estimates for multiple matrices reported in the same study or due to taxonomy. This estimated mean of 0.67 (standard error: ±0.08) significantly differed from 1 (P < 0.005), demonstrating the potential for behavioral syndromes to constrain evolutionary responses. The dashed line represents null expectations for autonomy (i.e., 1).
Discussion
We draw 2 major conclusions from our meta-analysis. First, these results demonstrate that behavioral syndromes have the potential to significantly constrain evolutionary responses. Although considerable speculation has been made about the potential constraining effects of behavioral syndrome structure (Bell 2005; Duckworth 2010), this is the first test of their general evolutionary effects. Second, although behaviors are often viewed as highly labile (Duckworth 2010), the genetic connections between behaviors may nevertheless strongly limit how the mean behavioral response of a population can change due to selection.
Although we have demonstrated that behavioral syndromes have the potential to significantly constrain evolutionary responses, whether they do so to a greater degree than correlations between other types of traits remains to be determined. However, a review of absolute additive genetic correlations estimated that morphological traits were correlated with an average strength of 0.47 and life-history traits were correlated with an average strength of 0.53 (Roff 1996). Although autonomies were not estimated across these traits—and indeed have not been estimated for a class of traits except in this meta-analysis of behavioral traits—these average correlations correspond to autonomies of 0.87 and 0.82, respectively. These estimates suggest that behavioral syndromes, which produce a mean estimate of autonomy of 0.67, impose similar and potentially greater evolutionary constraints as those due to correlations between morphological or life-history traits.
Our meta-analysis demonstrated that genetic correlations can impose constraints on the evolution of behavioral variation and thereby addresses questions about the ability of populations to respond to any selection pressure. This is currently unique not only by addressing behavioral evolution but also because published studies examining other types of traits have instead focused on the question of whether genetic correlations hamper responses to current selection pressures (Schluter 1996; Agrawal et al. 2006). For example, a study by Schluter (1996) demonstrated that genetic variation and covariation was generally oriented in the same direction as current selection, implying that correlations facilitated evolutionary responses to current selection. However, if the direction of selection experienced by the populations examined changed, then these results would no longer be informative regarding the potential for evolutionary constraint (Conner 2012). In contrast, our estimation of autonomy considers how correlations are oriented relative to selection in general and thus is robust to changes in current selection regimes.
Our findings also highlight 2 key issues that researchers should consider in the examination of behavioral syndromes. First, more estimates of behavioral syndromes at the genetic level (i.e., behavioral G matrices) are needed to properly understand their general evolutionary implications. Although evolutionary ecologists as a whole have a long history of quantifying genetic correlations between traits (e.g., Lande 1979), the relative paucity of behavioral G matrices limits the ability to ask comparative questions. For example, across available estimates, autonomy varied more between species than between other taxonomic groupings. However, there was little replication within classes or orders, which prevents strong comparative conclusions from being drawn.
Second, future research should address the stability of behavioral correlations at the genetic level. The genetic stability of personalities is important to consider because correlations—like those in the 35 additive genetic matrices used in this analysis—can be produced in a variety of ways and via mechanisms that have different evolutionary implications. First, genetic correlations can result from past correlated selection or other nonrandom events, resulting in what has been termed “selection-induced linkage disequilibrium” (Roff 1997). If behavioral genetic correlations emerge from selection-induced linkage disequilibrium, then they would be rapidly eroded under changing or relaxed selective regimes (Roff 1997; Beldade et al. 2002). This possibility can be explicitly tested by conducting artificial correlational selection in which combinations of traits opposed to the direction of the genetic correlation are selected for (Beldade et al. 2002; Delph et al. 2011). For example, in species in which there is a positive genetic correlation between aggression and boldness, selection would be imposed favoring highly aggressive but very shy individuals. If linkage disequilibrium is the primary contributor to genetic correlations, it will be possible for the experimental populations to respond to this selection and to instead produce individuals with high values for one and low values for the other behavior (i.e., aggressive-shy or unaggressive-bold).
As a second mechanism, genetic correlations—and thus behavioral syndromes—can result from the pleiotropic effects of genes on multiple behaviors (Walsh and Blows 2009). If the genetic correlations underlying behavioral syndromes are due to pleiotropy, then they will be difficult to break apart via selection and thus behavioral syndromes would have a long-term constraining effect on evolution (Roff 1997). This difficulty in undoing pleiotropy is because breaking the connection between traits requires gene duplication or the evolution of redundancy through other major changes at the molecular level. Additional genetic mechanisms that can produce trait correlations include direct physical linkage, physical linkage of regulatory regions, and long distance linkage due to chromosomal rearrangements and inversions that affect recombination. These alternative genetic mechanisms are similar in their evolutionary effects to pleiotropy in that they require molecular changes to be overridden and thus the correlations they generate will persist longer than those due to selection-induced linkage disequilibrium.
It is not currently clear which of these mechanisms explains the near ubiquity of behavioral syndromes but work with one of the model species of syndrome research provides some support for a selection-induced linkage disequilibrium explanation. Specifically, in three-spined stickleback (Gasterosteus aculeatus), differences in predation pressure between closely related populations or changes in predation pressure within populations correspond to differences in syndrome structure (Bell and Sih 2007; Dingemanse et al. 2007) with behavioral correlations being stronger in magnitude (or only present) in populations that co-occur with aquatic predators (Dingemanse, Dochtermann, et al. 2010). The observed rapid development or erosion of correlations suggests—at least in sticklebacks—that behavioral syndromes emerge from selection-induced linkage disequilibrium. However, genetic correlations can arise via pleiotropic effects while also being mitigated by gene-by-environment interactions (Sgro and Hoffmann 2004), which is also consistent with experimental data from sticklebacks (Dingemanse et al. 2009). In contrast, both correlations and causal interactions between behaviors and hormones provide evidence in other systems for pleiotropic explanations. For example, in both eastern fence lizards (Sceloporus undulatus) (Thaker et al. 2010) and side-blotched lizards (Uta stansburiana) (Mills et al. 2008), experimental manipulation of hormones whose natural expression is thought to be under moderate to strong genetic control leads to profound behavioral and morphological changes. Thus, whether selection-induced linkage disequilibrium, pleiotropy, or other molecular mechanisms represent a general explanation for the occurrence of behavioral syndromes remains to be determined. Ultimately selection experiments designed to break genetic correlations (Beldade et al. 2002; Conner et al. 2011) will be needed to distinguish between these mechanisms and determine whether behavioral syndromes can indeed impose long-term evolutionary constraints.
SUPPLEMENTARY MATERIAL
Supplementary material can be found at http://www.beheco.oxfordjournals.org/
FUNDING
N.J.D. was supported by the Max Planck Society.
We thank C.R. Feldman, M.L. Forister, W. Forstmeier, J.P. Hayes, S. Nakagawa, and H. Schielzeth for critical discussions and comments.
REFERENCES
Author notes
Handling editor: Shinichi Nakagawa
