


Abstract
• Background and Aims Nouelia insignis Franch., a monotypic genus of the Asteraceae, is an endangered species endemic in Yunnan and Sichuan Provinces of China. Most of the populations are seriously threatened. Some of them are even at the brink of extinction. In this study, the genetic diversity and differentiation between populations of this species were examined in two drainage areas.
• Methods DNA fingerprinting based on inter-simple sequence repeat polymorphisms was employed to detect the genetic variation and population structure in the species.
• Key Results Genetic diversity at species level was high with P = 65·05 % (percentage of polymorphic loci) and Ht = 0·2248 (total genetic diversity). The coefficient of genetic differentiation among populations, Gst, which was estimated by partitioning the total gene diversity, was 0·2529; whereas, the genetic differentiation between populations in the Jinsha and Nanpan drainage areas was unexpectedly low (Gst = 0·0702).
• Conclusions Based on the genetic analyses of the DNA fingerprinting, recent habitat fragmentation may not have led to genetic differentiation or the loss of genetic diversity in the rare species. Spatial apportionment of fingerprinting polymorphisms provides a footprint of historical migration across geographical barriers. The high diversity detected in this study holds promise for conservation and restoration efforts to save the endangered species from extinction.
INTRODUCTION
Nouelia insignis Franch., a monotypic genus of the Mutisieae (Asteraceae), is restricted in distribution to the Jinsha and Nanpan drainage areas in south-western China. This region has been recognized as a biodiversity hotspot that maintains high species diversity and is characterized by high endemism in the floristic composition. About 8000 species of flowering plants have been recorded (Li and Li, 1993; Wang et al., 1993; Wang and Zhang, 1994), of which numerous genera and species, e.g. Nouelia insignis, Trailliaedoxa gracilis W. W. Sm. et Forrest (Rubiaceae) and Acanthochlamys bracteata P. C. Kao (Velloziaceae), are indigenous to the region. Floristic characteristics of the hoptspot include adaptive radiation with a large number of plant groups, and the occurrence of many relict plant lineages (Wu, 1988; Wilson, 1992; Li and Li, 1993; Ying et al., 1993; Wang and Zhang, 1994; Boufford and van Dijk, 1999; Sun, 2002). The area has been referred to as the South-Central China Hotspot (Myers et al., 2000) or the Hengduan Mountains Hotspot (Boufford and van Dijk, 1999). Undoubtedly, it provides a natural laboratory for studying the origin and conservation of biodiversity.
Nouelia insignis grows in dry valleys, ranging from 1000 to 2800 m a.s.l., in northern Yunnan and western Sichuan Provinces (Wang, 1989). The species is a diploid shrub (2n = 54) (Peng et al., 2003) with abundant branches and a height of 3–5 m. In recent decades, Nouelia insignis has become endangered due to rapid habitat destruction and fragmentation. Most of the extant populations consist of fewer than 50 individuals. According to observations made for this study, no more than 5000 individuals survive in the wild. Moreover, this species suffers from reproductive failure because of low seed productivity and seed germination rates. Accordingly, very few seedlings could be located in the natural habitats.
Declining populations are predicted to possess low levels of genetic diversity because of the high probability of inbreeding within populations driven by random genetic drift (Ellstrand and Elam, 1993). In this species, given both small population number and size, genetic diversity is likely to be reduced. As long-term population viability is associated with the levels of genetic variability (Barrett and Kohn, 1991), the erosion of genetic diversity would eventually harm the health of populations and species. Considering the unusual woody life-form and limited population number and size, this endemic and rare Asteraceae species should be assigned a high priority for protection.
Genetic variation at the intraspecies level is a prerequisite for future adaptive change or evolution, and has profound implications for species conservation (Schaal et al., 1991). Understanding genetic variation within and between populations is essential for the establishment of effective and efficient conservation practices for rare species. Several aspects of conservation biology, such as loss of genetic diversity in conservation programmes and restoration of threatened population, can only be addressed by detailed population genetic studies (Hamrick and Godt, 1996). So far, the genetic variation of Nouelia insignis has been estimated based on allozyme analysis (Peng et al., 2003). Because the number of allozyme loci that can be probed is limited, and they only correspond to coding sequences, allozyme variation may not be able to provide an accurate or complete measure of nucleotide variation in the genome (Clegg, 1990; Xiao et al., 2004). In contrast, molecular fingerprinting allows noncoding DNA sequences to be examined, thereby providing more penetrating insights into population genetic structures. Among DNA fingerprinting techniques, inter-simple sequence repeats (ISSR) represent noncoding sequences between simple sequence repeats, which supply an effective means to assess genetic diversity. ISSR studies of natural populations demonstrated a hyper-variable nature of these DNA fingerprints and their potential use for population-level studies (Ge and Sun, 1999; Culley and Wolfe, 2001).
The objectives of this study are to examine the levels of ISSR variation and genetic differentiation among Nouelia insignis populations between different drainage areas. Based on genetic analyses, the evolutionary factors that influenced the spatial apportionment of genetic diversity are estimated. This molecular information will provide effective and efficient measures for protecting Nouelia insignis.
MATERIALS AND METHODS
Sample collection
Ten populations from the Jinsha drainage area and three extant populations (JC, HN and ML) from the Nanpan drainage area were surveyed (Fig. 1). Of these populations, PZH, MY and DC are distributed in Sichuan Province, while the others occur in Yunnan Province. From each population, leaf tissue of 17 individuals (only 16 from the Jiangchuan population) was randomly sampled (Table 1). In total, young, healthy leaflets of 220 individuals were collected, dried with silica gel and stored at 4 °C until they were processed.
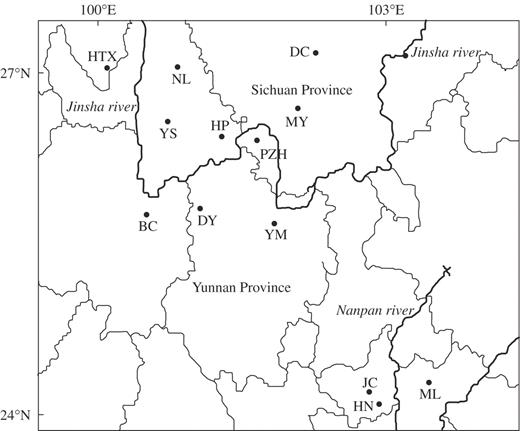
Map showing locations of the populations of Nouelia insignis sampled. Population symbols follow Table 1.
Sites and sample size for 13 populations of Nouelia insignis examined in the ISSR analysis
| Code | Drainage | Population | Sample size | Latitude (N) | Longitude (E) |
|---|---|---|---|---|---|
| BC | JS | Bingchuan | 17 | 25°50' | 100°36' |
| DC | JS | Dechang | 17 | 27°38' | 102°17' |
| DY | JS | Dayao | 17 | 25°51' | 101°06' |
| HP | JS | Huaping | 17 | 26°35' | 101°21' |
| HTX | JS | Hutiaoxia | 17 | 27°19' | 100°08' |
| MY | JS | Miyi | 17 | 26°54' | 102°13' |
| NL | JS | Ninglang | 17 | 27°21' | 100°51' |
| PZH | JS | Panzhihua | 17 | 26°24' | 101°46' |
| YM | JS | Yuanmou | 17 | 25°46' | 101°50' |
| YS | JS | Yongsheng | 17 | 26°34' | 100°48' |
| HN | NP | Huaning | 17 | 24°17' | 102°51' |
| JC | NP | Jiangchuan | 16 | 24°21' | 102°43' |
| ML | NP | Mile | 17 | 24°41' | 103°40' |
DNA extraction and polymerase chain reaction (PCR)
Leaf tissue of the above materials was ground to a powder in liquid nitrogen. Genomic DNA was extracted from the powdered tissue following CTAB procedures (Doyle, 1991). The DNA was amplified with PCR using ISSR primers from the University of British Columbia (UBC). Of 100 ISSR primers, 11 produced clear and reproducible bands, and were selected for the subsequent experiment (Fig. 2 and Table 2). PCR amplification was carried out in a total volume of 20 μL, consisting of 20 ng template DNA, 2·0 μL 10× PCR buffer, 2·2 mm MgCl2, 0·12 mm dNTPs, 3 % formamide, 400 nm primer, 0·5 U of Taq polymerase (Takara) and double-distilled water. PCR was programmed on an ABI Prism Reaction Dye Terminator Cycle with a hot bonnet (Perkin-Elmer) as one cycle of denaturation at 94 °C for 5 min, 38 cycles of 30 s denaturation at 94 °C, 1 min 30 s annealing at 53 °C, and 1 min extension at 72 °C, followed by a 7-min extension at 72 °C. A negative control, in which template DNA was omitted, was included in every PCR protocol for testing contamination. Amplification products were electrophoretically separated on 1·5 % agarose gels buffered with 0·5× TBE. A DNA ladder was applied as a size marker (100–2500). After staining with ethidium bromide for 30 min, DNA fragments were identified by image analysis software for gel documentation. Only those gels that showed consistent and clear bands were considered; while those smeared and weak were excluded.
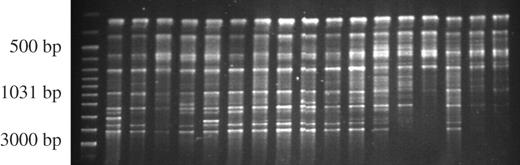
Electrophoresis of PCR products amplified with primer UBC # 857 for the Ninglang population.
List of ISSR primers and the sequences used in this study, number of reliable bands and polymorphic bands of each primer generated and the Nm value for each primer
| Primer code | Nucleotide sequence 5′ to 3′ | No. of bands analysed | No. of polymorphic bands | Nm |
|---|---|---|---|---|
| 807 | (AG)7T | 11 | 7 | 1·0835 |
| 811 | (GA)8C | 9 | 7 | 0·8086 |
| 822 | (TC)8A | 6 | 3 | 0·7178 |
| 827 | (AC)8G | 13 | 10 | 0·5656 |
| 840 | (GA)8YT | 11 | 8 | 0·6921 |
| 855 | (AC)8YT | 9 | 7 | 1·2411 |
| 856 | (AC)8YA | 10 | 6 | 0·5735 |
| 857 | (AC)8YG | 9 | 6 | 0·6254 |
| 881 | (GGGGT)3 | 10 | 8 | 0·6103 |
| 889 | DBD(AC)7 | 7 | 3 | 1·9153 |
| 890 | VHV(GT)7 | 8 | 2 | 1·1687 |
| Total | 103 | 67 |
Y = (A, C); D = (A, G, T); B = (C, G, T); H = (A, C, T); V = (A, C, G).
Data analysis
ISSR bands were scored as 1 (present) or 0 (absent) binary characters. The software program POPGENE v. 1·31 (Yeh et al., 1999) was used to obtain the genetic diversity parameters, percentage of polymorphic loci (P), allele number per locus (A), effective allele number per locus (Ae), and expected heterozygosity (He). Genetic diversity measures (Ht, total gene diversity; Gst, coefficient of gene differentiation) were tested using Nei's (1973) gene diversity statistics. Nei's genetic identity, I ranging from 0·0 to 1·0, and distance D, ranging from 0.0 to infinity, were computed for each population pair. The Shannon diversity index was calculated as Ho = −ΣPilog2Pi (Lewontin, 1972), in which Pi represents the frequency of the given ISSR fragments. This index was then used to measure the total diversity (Hsp) and the mean intra-population diversity (Hpop).
The proportion of diversity among populations was calculated as (Hsp − Hpop)/Hsp. AMOVA (analysis of molecular variance) was also employed to estimate the hierarchical apportionment of variation. Additionally, to test for putative correlations between genetic distances (D) and geographical distances among populations, a Mantel test was performed with Tools for Population Genetic Analysis (Miller, 1997), by computing 10 000 permutations, and the Arlequin program (Schneider et al., 2000) was used to test the significant values of pairwise genetic distances.
The gene flow estimates (Nm) were calculated as Nm = (1 − Gst)/4Gst (Slatkin and Barton, 1989), where Nm is the number of migrants per generation. The significance of the association between Gst and geographical distance was determined by a regression F-test using the SPSS program (Norusis, 1994). A UPGMA dendrogram based on unbiased genetic distance (Nei, 1972) was generated using POPULATIONS (Langella, 2000). Bootstrapping based on the fingerprinting data was conducted with 1000 replicates.
RESULTS
Genetic diversity
In this study, genetic diversity was examined in Nouelia insignis, based on ISSR fingerprinting. In total, 11 primers produced 103 reliable ISSR bands, of which 67 (65·05 %) were polymorphic. The percentage of polymorphic loci (P) averaged 36·89 with a range from 31·07 % (NL) to 41·75 % (YM and HP) at the population level. The mean number of alleles (A) per locus was 1.65, while the effective number (Ae) was 1.33. Assuming Hardy–Weinberg equilibrium, the expected heterozygosity within populations (Hep) was 0·1491 (Table 3) on average, and the genetic diversity within the species (Hes) was 0·2248. Shannon indices (I) were 0·2245 and 0·3024, respectively. Among the 13 populations examined in this study, population YM had the highest level of variability, with He = 0·1820 and I = 0·2614, while the Dayao population exhibited the lowest diversity, with He = 0·1265 and I = 0·1842. No private bands were detected in either population. That is, the ISSR divergence among populations was mainly attributed to differences of the DNA-fragment frequency rather than allele fixation. When the populations within the Jinsha or Nanpan drainage area were pooled together, the percentage of polymorphic loci of group Jinsha was 62·14, and of group Nanpan was 48·54. Other indexes supplied by POPGENE also indicated that group Jinsha had higher genetic diversity than Nanpan. Taking Shannon's diversity index as an example, the value was 0·3398 and 0·2783, respectively, for the two groups with a mean value of 0·3090.
Genetic variability within populations of Nouelia insignis revealed by ISSR analysis
| Population | P | He | Ho |
|---|---|---|---|
| BC | 34·95 | 0·1488 (0·2083) | 0·2148 (0·2980) |
| DC | 32·04 | 0·1311 (0·2015) | 0·1899 (0·2857) |
| DY | 32·04 | 0·1265 (0·1975) | 0·1842 (0·2824) |
| HP | 41·75 | 0·1771 (0·2174) | 0·2554 (0·3096) |
| HTX | 39·81 | 0·1658 (0·2200) | 0·2377 (0·3102) |
| MY | 33·01 | 0·1405 (0·2050) | 0·2029 (0·2937) |
| NL | 31·07 | 0·1352 (0·2065) | 0·1940 (0·2938) |
| PZH | 39·81 | 0·1659 (0·2124) | 0·2402 (0·3036) |
| YM | 41·75 | 0·1820 (0·2195) | 0·2614 (0·3130) |
| YS | 34·95 | 0·1419 (0·2045) | 0·2062 (0·2920) |
| JC | 37·86 | 0·1650 (0·2174) | 0·2367 (0·3089) |
| ML | 34·95 | 0·1328 (0·1948) | 0·1957 (0·2808) |
| HN | 33·01 | 0·1260 (0·1912) | 0·1857 (0·2767) |
| Mean | 35·92 (8·74) | 0·1491 (0·0560) | 0·2158 (0·1857) |
P is the percentage of polymorphic loci; He is the expected heterozygosity; Ho is the observed heterozygosity. Values in brackets are s.d.
Genetic divergence
Genetic analysis showed that the highest identity (0·9746) existed between populations BC and MY, while the lowest (0·8918) occurred between populations HTX and HN (Table 4). The percentage of the total genetic variation found among populations (Gst = 0·2529) was moderate, which means 74·71 % of the variation existed within populations. This result was further confirmed by AMOVA analysis among populations, which showed that 22·25 % of the variance existed among populations.
Nei's pairwise genetic identity (above diagonal) and genetic distance (below diagonal) between Nouelia insignis populations
| Population | BC | DC | DY | HP | HTX | MY | NL | PZH | YM | YS | HN | JC | ML |
|---|---|---|---|---|---|---|---|---|---|---|---|---|---|
| BC | – | 0·9598 | 0·9524 | 0·9430 | 0·9457 | 0·9746 | 0·9479 | 0·9467 | 0·9367 | 0·9358 | 0·9301 | 0·9449 | 0·9225 |
| DC | 0·0410 | – | 0·9418 | 0·9352 | 0·9420 | 0·9740 | 0·9627 | 0·9482 | 0·9303 | 0·9361 | 0·9227 | 0·9398 | 0·9110 |
| DY | 0·0654 | 0·0600 | – | 0·9458 | 0·9402 | 0·9554 | 0·9519 | 0·9540 | 0·9524 | 0·9363 | 0·9233 | 0·9415 | 0·9443 |
| HP | 0·0586 | 0·0546 | 0·0558 | – | 0·9684 | 0·9469 | 0·9459 | 0·9703 | 0·9437 | 0·9624 | 0·8962 | 0·9474 | 0·9197 |
| HTX | 0·0558 | 0·0597 | 0·0616 | 0·0321 | – | 0·9363 | 0·9444 | 0·9592 | 0·9246 | 0·9611 | 0·8918 | 0·9287 | 0·8995 |
| MY | 0·0257 | 0·0264 | 0·0456 | 0·0546 | 0·0659 | – | 0·9563 | 0·9554 | 0·9514 | 0·9447 | 0·9336 | 0·9612 | 0·9291 |
| NL | 0·0535 | 0·0380 | 0·0493 | 0·0557 | 0·0572 | 0·0447 | – | 0·9487 | 0·9357 | 0·9576 | 0·9428 | 0·9603 | 0·9397 |
| PZH | 0·0548 | 0·0532 | 0·0471 | 0·0302 | 0·0417 | 0·0423 | 0·0527 | – | 0·9458 | 0·9608 | 0·9118 | 0·9467 | 0·9200 |
| YM | 0·0654 | 0·0723 | 0·0488 | 0·0579 | 0·0784 | 0·0498 | 0·0665 | 0·0557 | – | 0·9356 | 0·9125 | 0·9327 | 0·9245 |
| YS | 0·0664 | 0·0661 | 0·0658 | 0·0383 | 0·0397 | 0·0569 | 0·0433 | 0·0400 | 0·0666 | – | 0·9007 | 0·9440 | 0·9013 |
| HN | 0·0724 | 0·0804 | 0·0798 | 0·1096 | 0·1145 | 0·0687 | 0·0589 | 0·0924 | 0·0916 | 0·1045 | – | 0·9531 | 0·9483 |
| JC | 0·0566 | 0·0621 | 0·0603 | 0·0541 | 0·0739 | 0·0395 | 0·0406 | 0·0548 | 0·0697 | 0·0573 | 0·0480 | – | 0·9587 |
| ML | 0·0807 | 0·0932 | 0·0573 | 0·0837 | 0·1059 | 0·0736 | 0·0622 | 0·0834 | 0·0785 | 0·1039 | 0·0531 | 0·0422 | – |
No significant genetic differentiation was found between the populations of Jinsha and Nanpan drainage areas. The level of genetic differentiation between these two areas was low, as revealed by Gst = 0·0702. Deduced from the Gst value, the level of gene flow (Nm) was estimated at 3·3130, indicating a very high migration rate between populations of the two drainage areas. These results agreed with the genetic structure estimated by Shannon's diversity index and AMOVA analysis, with 10·38 % and 13·10 % (Table 5) of the genetic variation existing between areas, respectively. A Mantel test showed a positive correlation between genetic differentiation and geographical distance (P = 0·002) (Fig. 3).
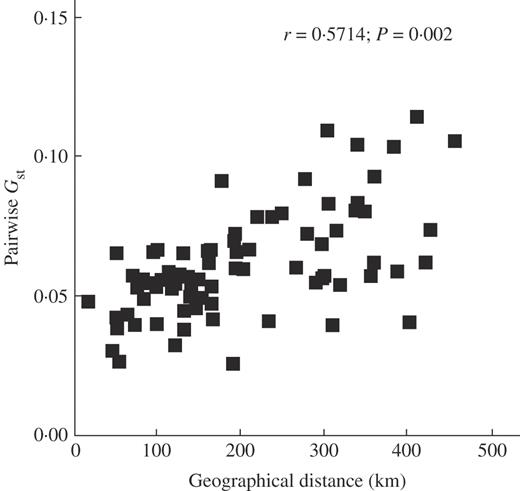
Correlation between pairwise Gst of Nouelia insignis and geographical distance.
Nested AMOVA for Nouelia insignis
| Source of variance | d.f. | Sum of squares | Mean squares | Variance component | % total variance | P value |
|---|---|---|---|---|---|---|
| Among areas | 1 | 114·1001 | 114·100 | 1·113 | 13·10 | <0·0010 |
| Among populations within areas | 11 | 311·5356 | 28·321 | 1·314 | 15·46 | <0·0010 |
| Within populations | 207 | 1256·7279 | 6·071 | 6·071 | 71·44 | <0·001 |
A UPGMA dendrogram (Fig. 4) was reconstructed based on the pairwise genetic distances between populations, none of which was identified as significant based on the Arlequin analysis. In total, two major clusters were identified, i.e. (ML, HN) vs. all others, of which (YM, DY), [YS, PZH, (HP, HTX)] and [(NL, JC), (DC, (BC, MY))] were further clustered. Nevertheless, only the clustering of ML and HN was significantly supported with a bootstrap value of 99 %; while all others were not unambiguously resolved.
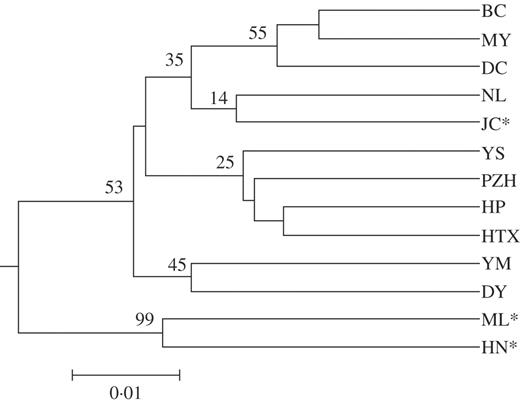
UPGMA dendrogram based on Nei's (1972) genetic distance. * Populations found in the Nanpan drainage area.
DISCUSSION
High levels of genetic diversity within the rare species
In this present study, the genetic variance within Nouelia insignis was investigated. Despite its rarity, unexpectedly high levels of genetic diversity (P = 65·05 %, Hep = 0·1491, He = 0·2248) were detected, as compared with a previous allozyme investigation, with A = 1·6, P = 37·5 %, Ho = 0·143, He = 0·141 in Yunnan populations (Peng et al., 2003), and also to the means of allozyme variation for 100 endemics (P = 40·0 %, Hep = 0·096, Hes = 0·063) (Hamrick and Godt, 1989). Generally, species with small geographic ranges tend to maintain less genetic diversity than geographically widespread species (Hamrick and Godt, 1989). However, exceptions are not uncommon (Gitzendanner and Soltis, 2000; Lopez-Pujol et al., 2002; Wang et al., 2004). For example, Castilleja levisecta is a rare species, with a distribution restricted to two island populations of British Columbia and nine populations in Washington State. Despite its small range and the few extant populations, this species has high genetic diversity with P = 100 %, Hep 0·285 and Hes = 0·213 (Godt et al., 2005).
High genetic diversity maintained in rare plants is attributable to a number of factors (Zawko et al., 2001), such as recent reduction of population size plus insufficient time for isolation, or extensive, recurrent gene flow (Maguire and Sedgley, 1997; Chiang et al., 2006). Field observations showed that plants of Nouelia insignis are perennials pollinated by a small bee-fly, which largely promotes outcrossing. In addition, sepals of this species develop specialized pappi, a structure facilitating fruit dispersal via wind. Both mechanisms help to maintain genetic polymorphisms across populations, even in this rare species.
Population genetic theory predicts that larger populations tend to maintain higher allelic diversity (Hedrick, 1985; Ellstrand and Elam, 1993). High levels of genetic diversity based on allozyme and ISSR evidence suggest a large effective population size of the species. However, populations of Nouelia insignis in the Jinsha drainage area remain fragmented in the wild and are separated from each other by less than 50 km. The rarity of this long-life perennial species is likely to be attributable to large-scale habitat destruction caused by human activities. During the past few decades, this plant has been over-exploited for firewood use, inevitably causing a dramatic decline of this species. Many plants now are scattered along roadsides where habitats are accessible. Such habitat fragmentation and population isolation of Nouelia insignis in the Jinsha drainage area may have occurred only recently as indicated by high levels of genetic diversity and the lack of genetic differentiation. In other words, the present isolated and fragmented populations were likely to be derived from a previously large population.
Lack of genetic differentiation between populations and between geographical regions
The percentage of total genetic variation among populations (Gst) was 25·29 %, which is close to the mean Gst values found for 52 endemic plants (25 %) (Godt et al., 2005). Within Jinsha and Nanpan drainage areas, a positive correlation (P = 0·002) was found between genetic distance and geographic distance, agreeing with an ‘isolation by distance’ model, which suggests that the genetic exchangeability is constrained between geographically distant populations. In contrast, as the possibilities of pollen and seed flow across the long distance between the two geographical regions, which is over 150 km, are expected to be low, high Nm values were unexpectedly detected between the Jinsha and Nanpan groups (3·3130), revealing an unusual migratory mode deviated from the regular stepping-stone, Wright's island, or isolation by-distance models (Hamrick and Nason, 1996).
It is known that, as current gene flow is limited between populations, high Nm values estimated from genetic structure tend to represent historical genetic exchange, and are not indicative of current migration rates. For rare species, it is of greater concern when gene flow estimates are high since they may reflect previous intermingling of populations; and they should not be interpreted as indicating the present state of population isolation (Godt et al., 2005). In this study, the high estimated Nm values between populations, plus high levels of genetic diversity within geographical regions, suggest a likely migrant-pool migratory model (Wade and McCauley, 1998), which describes a migratory pattern with colonists recruited from a random sample of previously existing populations. This model is usually associated with glaciation or vicariance events (Huang et al., 2001; Chiang and Schaal, 2006).
According to the geological evidence, following the uplifting of the Yunnan-Guizhou Plateau, the climate in this region has remained relatively steady since the Tertiary (Peng et al., 2003) in the Jinsha drainage area. The refugia thereby provided shelters for Nouelia insignis during the Quaternary glaciations. Subsequently, as Pleistocene glaciers retreated, plants from refugia expanded and colonized newly available habitats (Hewitt, 1996, 2001). Random samples of Nouelia insignis thereby migrated into Nanpan from the Jinsha drainage area. The high level of deduced gene flow between these two areas may reflect such ancient expansion events. Furthermore, the UPGMA dendrogram (Fig. 4), revealing a close phenetic relationship between population JC of the Nanpan drainage area and all populations of the Jinsha drainage area, also supports such historical migration.
Implications for conservation
The maintenance of genetic variation is one of the major objectives for conserving endangered and threatened species (Avise and Hamrick, 1996). Knowledge of genetic variation between and within populations provides essential information in the formulation of appropriate management strategies directed towards their conservation (Milligan et al., 1994). From the results obtained from this study, it is possible to draw inferences on the conservation of Nouelia insignis. Severe habitat loss and fragmentation predominantly ascribed to anthropogenic pressures caused local extinction of this species. The reduced size of most extant populations makes the species susceptible to the loss of genetic polymorphisms shaped by effects of random genetic drift and inbreeding.
Action for conserving this rare species for its long-term survival should be taken immediately. High levels of genetic polymorphisms maintained in this species ensure the conservation practices, despite the limited size of most populations. Among the extant populations, population YS has the largest size, with about 1000 individuals. Therefore, this population should be considered as the high priority for in-situ conservation to expand the population range and enlarge the population size. Additionally, adult individuals in the JC population were much taller than those in other populations, i.e. 8–20 m vs. <5 m. Besides, the age structure of this population is much healthier than others, altogether indicating less anthropogenic disturbance in JC. This population is distributed along slopes of a small mountain, where a Buddhist Biyun Temple is located. Proximity to the temple may have protected plants from human exploitation and ensured survival of a great number of old individuals of Nouelia insignis. Therefore, introduction of foreign germplasm to enhance the genetic diversity of this population may be a good way to protect this species as well.
In contrast, as ex-situ conservation is conducted, sampling from Jinsha drainage area may be sufficient considering the genetic diversity of the Jinsha group is higher than the Nanpan group. The absence of private DNA bands suggests that the Jinsha population can provide almost all the genetic polymorphisms of this species. In addition, because of its long life-cycle, seed collection to preserve the germplasm resource in botanical gardens or other institutions is also practical. The safest way may be to use a combination of the three methods mentioned above to protect the major components of genetic diversity of this species.
These authors contributed equally.
We are grateful to two anonymous reviewers and Mr L-Q Xiao for their valuable suggestions and comments on the manuscript. Thanks also go to Dr Scher for his great help in language improvement. This work was supported by the National Natural Science Foundation of China (Grant No. 40332021).
LITERATURE CITED
Avise JC, Hamrick JL.
Barrett SCH, Kohn JR.
Boufford DE, van Dijk PP.
Chiang TY, Schaal BA.
Chiang YC, Hung KH, Schaal BA, Ge XJ, Hsu TW, Chaing TY.
Clegg MT.
Culley TM, Wolfe AD.
Doyle J.
Ellstrand NC, Elam DR.
Ge XJ, Sun M.
Gitzendanner MA, Soltis PS.
Godt MJW, Caplow F, Hamrick JL.
Hamrick JL, Godt MJW.
Hamrick JL, Godt MJW.
Hamrick JL, Nason JD.
Hewitt GM.
Hewitt GM.
Huang S, Chiang YC, Schaal BA, Chou CH, Chiang TY.
Langella O.
Li XW, Li J.
Lopez-Pujol J, Bosch M, Simon J, Blanche C.
Maguire TL, Sedgley M.
Miller MP.
Milligan BG, Leebens-Mack J, Strand AE.
Myers N, Mittermeier RA, Mittermeier CG, Fonseca GA da, Kent J.
Nei M.
Peng YL, Hu YQ, Sun H.
Schaal BA, Leverich WJ, Rogstad SH.
Schneider S, Roessli D, Excoffier L.
Slatkin M, Barton NH.
Sun H.
Wade MJ, McCauley DE.
Wang HS.
Wang HS, Zhang YL.
Wang WT, Wu SG, Lang KY, Li PQ, Pu FT, Chen SK.
Wang ZF, Hamrick JL, Godt MJW.
Xiao LQ, Ge XJ, Gong X.
Yeh FC, Yang RC, Boyle T.
Ying TS, Boufford DE, Zhang YL.
Author notes
1Laboratory of Biodiversity and Biogeography, Kunming Institute of Botany, Chinese Academy of Sciences, Kunming 650204, PR China and 2Department of Life Sciences, Cheng Kung University, Tainan, Taiwan 701
