


Abstract
Aims : To assess the variation in heavy drinking and alcohol dependence by living arrangements, and the contribution of social and behavioural factors to this variation. Design : The Health 2000 survey is a nationally representative cross-sectional survey conducted in Finland in 2000–2001 ( N = 4589 in the age-range of 30–54 years, response rate 81%). Measurements : Living arrangements; married, cohabiting, living with other(s) than a partner, and living alone. Consumption of beer, wine and spirits in the past month was converted into grams of alcohol/week, and heavy drinking was classified as ⩾280 (men) and ⩾140 (women) grams/week. Twelve-month prevalence of alcohol dependence was diagnosed by a mental health interview (CIDI). Findings : As compared to the married, cohabiting and living alone associated with heavy drinking (age-adjusted OR; 95% CI: 1.71;1.17–2.49 and OR 2.15;1.55–3.00 in men; OR 1.54;0.96–2.46 and OR 1.67;1.07–2.63 in women) and alcohol dependence (OR 2.29;1.44–3.64 and OR 3.66;2.39–5.59 in men; OR 2.56;1.10–5.94 and OR 4.43;2.03–9.64 in women). Living with other(s) than a partner associated with heavy drinking. Those who cohabited without children or lived alone had the highest odds for alcohol dependence. Among both genders, adjusting for main activity and financial difficulties attenuated the odds for heavy drinking and alcohol dependence by ∼5–30% each, and additionally among women adjusting for urbanisation attenuated the odds for heavy drinking by ∼15–45%. Conclusions : Cohabiting and living alone are associated with heavy drinking and alcohol dependence. Unemployment, financial difficulties and low social support, and among women also living in an urban area, seem to contribute to the excess risk.
Introduction
Marital status groups are known to differ in terms of health and mortality in different societes, with non-married persons being in a disadvantaged position compared with married persons (Hu and Goldman, 1990 ; Joung et al. , 1996 ; Martikainen et al. , 2005 ). However, in the past decades, there have been demographic changes in the composition of families and households and in the marital status distribution and living arrangements. Thus, official marital status no longer reflects the living arrangements of single, divorced and widowed persons, as they may either live alone, with a partner, with their children, or with others. In particular, the growing proportion of cohabiters has diversified the experience of living arrangements in many Western societies (Haskey, 2001 ; Miettinen, 2005 ; Saluter, 1996 ). One's current health seems to be strongly associated with the level and quality of social interaction and social bonds with persons that live in the same household. For example, cohabiting, living alone, and living with children have been shown to associate with health and health related behaviours (Caetano et al. , 2006 ; Davis et al. , 2000 ; Horwitz and White, 1998 ; Joung et al. , 1995 ; Lahelma et al. , 2002 ; Lund et al. , 2002 ; Ross et al. , 1990 ; Schoenborn, 2004 ; Umberson, 1992 ). However, relatively little is known about health differences between living arrangement groups. In particular, the excessive consumption of alcohol ranks among the world's major public health problems (Rehm et al. , 2003 ), and alcohol consumption may play a major role in the overall health and well-being of persons in less advantaged living arrangements.
Earlier research has brought out differences in alcohol-related health and unhealthy alcohol use by marital status and living arrangements. Alcohol-related causes of death (e.g. alcoholic cirrhosis of the liver) are most common in divorced persons, particularly in men (Joung et al. , 1996 ; Martikainen et al. , 2005 ). Also, different dimensions of unhealthy alcohol use, such as excess alcohol consumption (Power et al. , 1999 ; Schoenborn, 2004 ), substance use disorders, and alcohol abuse (Alonso et al. , 2004 ; Richards et al. , 1997 ; Klose and Jacobi, 2004 ), are more common in non-married persons. Single parents, persons living alone, and persons living with other(s) than a partner have been shown to have high prevalence of alcohol dependence and other substance use disorders (Bijl et al. , 1998 ; Klose and Jacobi, 2004 ; Sundquist and Frank, 2004 ; Wang and El-Guebaly, 2004 ), and cohabiters and persons living alone seem to consume more alcohol than married persons (Caetano et al. , 2006 ; Helmert and Shea, 1998 ; Horwitz and White, 1998 ; Joung et al. , 1995 ; Power et al. , 1999 ; Schoenborn, 2004 ). Furthermore, living with children appears to be associated with lower levels of alcohol consumption and disorders (Chilcoat and Breslau, 1996 ; Hajema and Knibbe, 1998 ; Power et al. , 1999 ; Umberson, 1992 ), but this finding has not been supported by all studies (Horwitz et al. , 1996 ).
Differences in unhealthy alcohol use according to living arrangements may originate from various factors. First, according to the causal hypothesis, marriage or partnership and parenthood may promote a healthy life style—including moderate alcohol consumption or abstinence—through different dimensions of social support (Ross et al. , 1990 ; Wyke and Ford, 1992 ). In longitudinal studies, acquiring the spousal or parental role seems to have beneficial effects on alcohol consumption (Chilcoat and Breslau, 1996 ; Hajema and Knibbe, 1998 ; Prescott and Kendler, 2001 ). Social control of behaviour in particular, appears to be an important mechanism by which marriage and other living arrangements, including living with a proximate adult or children, affect health behaviour (Anson, 1989 ; Umberson, 1992 ). In addition to psychosocial factors, material aspects may also have a similar mediating role (Alonso et al. , 2004 ; Schoenborn, 2004 ). In addition, divorce and bereavement are particularly stressful life events, which tend to promote poor health and increased alcohol consumption in previously married persons (Horwitz et al. , 1996 ; Lee et al. , 2005 ; Power et al. , 1999 ), and probably also in previously cohabiting persons.
Second, the observed differences in unhealthy alcohol use by living arrangements may arise from factors pertaining to one's environment, living conditions and experiences in different earlier stages of life which affect both one's living arrangements and alcohol use. For example, social environment in childhood and educational level, as well as urbanisation and lack of religious activity, have been shown to associate with unhealthy alcohol use (Anda et al. , 2002 ; Alonso et al. , 2004 ; Bataille et al. , 2003 ; Bijl et al. , 1998 ; Hope et al. , 1998 ; Horwitz et al. , 1996 ; Koenig, 2001 ; Kendler et al. , 2002 ; Richards et al. , 1997 ; Sundquist and Frank, 2004 ). As these factors also appear to be related to marital status and living arrangements (Fu and Goldman, 1996 ; Horwitz et al. , 1996 ; Huurre et al. , 2006 ; Richards et al. , 1997 ), they may partially explain the association between living arrangements and alcohol-related health.
Third, unhealthy alcohol use may affect living arrangements. For example, heavy drinking has been shown to associate with lower chances of marriage and higher chances of divorce (Chilcoat and Breslau, 1996 ; Cheung, 1998 ; Fu and Goldman, 1996 ), although some studies have not supported this selection effect (Horwitz et al. , 1996 ; Power et al. , 1999 ).
In short, the literature supports the notion that unhealthy alcohol use is more common among persons in less advantaged living arrangements. However, more research is needed in order to determine which subgroups of the growing proportion of non-married persons are the most vulnerable. Furthermore, more data are needed on the mechanisms that contribute to differences in unhealthy alcohol use between living arrangement groups in order to support the most vulnerable groups and narrow the differences. This study aims to find out whether there are differences in heavy drinking and alcohol dependence by living arrangements among middle-aged Finns. We also examine the contribution of several causally preceding as well as mediating factors to the differences in unhealthy alcohol use by living arrangements.
Methods
The Health 2000 survey is a nationally representative cross-sectional study conducted in 2000–2001 in Finland (Aromaa and Koskinen, 2004 ). The data were obtained by computer aided interviews, self-administered questionnaires and a health examination. A structured mental health interview, the Composite International Diagnostic Interview (CIDI) (Wittchen and Pfister, 1997 ), was included in the health examination. In this study, we consider subjects in the age-range of 30 to 54 years, in which cohabiting and living with children is common ( N = 4589). We excluded persons with missing information on household size ( N = 17), as well as pregnant women ( N = 31). After these exclusions, information of alcohol consumption was obtained from 81% ( N = 3722), on alcohol dependence from 78% ( N = 3573), and on all variables from 73% ( N = 3347) of the sample.
The subjects were asked to separately report average weekly consumption of ‘spirits’, ‘wine’ and ‘beer, cider and long drinks’ (in the Finnish context, ’long drink’ refers to a specific ready-mixed mild gin-flavoured alcoholic beverage), during the past month. The total consumption was converted into grams of alcohol per week. Heavy drinking was classified as ⩾280 (men) and ⩾140 (women) grams of alcohol/week. These risk levels were determined according to the Finnish Current Care Guideline for Treatment of Alcohol Abuse (Working group appointed by the Finnish Society of Addiction Medicine, 2006 ). The 12 month prevalence of alcohol dependence according to the DSM-IV was diagnosed by the computerized Munich-Composite International Diagnostic Interview (M-CIDI), which has been found to have good psychometric properties (Wittchen et al. , 1998 ). In the remainder of the article, we use the term ‘unhealthy alcohol use’ (Saitz, 2005 ) when referring to both our outcome variables.
We defined living arrangements as married, cohabiting, living with other(s) than a partner, and those living alone based on self-reported marital status and household size. We classified persons reporting one or more under-18-year old person living in the household for over 1 month per year as ‘living with children’. As only the size and crude age structure of the household were available, the composition of the heterogeneous group of respondents living with other(s) than a partner could not be firmly assessed. Judging from available data, about 80% of women and about 40% of men in this category were lone parents. More than a third of men, but less than 10% of women living with other(s) than a partner appeared to live with their parent(s).
Factors preceding unhealthy alcohol use and current living arrangements included social environment in childhood, education, urbanisation and religious activity. The subjects were asked to report their family structure in childhood (i.e. at the age of seven, which is the age when children start school in Finland). We dichotomized responses as ‘living with both parents’ and ‘not living with both parents’. Reported parental adversities in youth (i.e. under 16 years of age) were classified into: long term financial difficulties, either parent's drinking problem, either parent's mental health problem, and serious conflicts within the family. We classified educational level as ‘basic’ (no matriculation examination, and at most, a vocational course or on-the-job training), ‘intermediate’ or ‘higher education’ (university qualification). We classified urbanisation level as ‘urban’ (= ten largest cities), ‘other urban or semi-urban’ and ‘rural municipalities’. Going to church or practicing other religious activities at least once a month was defined as having regular religious activity. Age was treated as a continuous variable.
The following factors were conceptualized as potentially mediating the effects of living arrangements on unhealthy alcohol use. We classified main activity as ‘full-time or part-time employed’, ‘other’ (i.e. student, retired, or taking care of household or family members) and ‘unemployed or laid off’. Financial difficulties were classified as ‘no’, ‘some’ or ‘major difficulties’ on the basis of responses to the question ‘How would you describe the current balance between income and expenditure in your household?’. Social support was assessed by questions regarding emotional and practical help from others and social contacts. Availability of emotional and practical help was based on the questions: ‘Who do you think really cares about you no matter what happened to you?’ and ‘From whom do you get practical help when needed?’ Several alternatives of the following could be chosen: spouse/partner; other relative; friend; fellow worker; neighbour; no one. We constructed the categories ‘⩾2 persons’ and ‘0–1 person’ from the total score. We classified social contacts as ‘rare’ if subjects reported visits with family, friends or neighbours a few times a year or less frequently.
Statistical methods
We performed these analyses with the survey procedures of Stata (version 8.0), which take the sampling design into account. Taylor linearized variance estimation was used (StataCorp, 2003 ). The age-adjusted prevalences were calculated by using the predictive margins approach (Graubard and Korn, 1999 ). Age associated significantly with living arrangements ( P < 0.001), with heavy drinking among men ( P = <0.001) and with alcohol dependence among women ( P = 0.020). In Table 1 , we report the age-adjusted prevalences of social adversities in childhood, sociodemographic variables, religious activity, and social support variables by living arrangements on subjects, with data on either heavy drinking or alcohol dependence ( N = 3840). The significance of the differences in all variables between living arrangements was assessed by the adjusted Wald test. We analysed the bivariate associations between the outcome measures and living arrangements and all other variables by logistic regression analysis, adjusting for age.
Age-adjusted prevalence (%) of social environment in childhood, sociodemographic variables, religious activity, and social support variables by living arrangements and gender, age group 30–54 years ( N = 3840)
| Living arrangements a | ||||||||||
|---|---|---|---|---|---|---|---|---|---|---|
| Women | Men | |||||||||
| Variable | Married | Cohabiting | Living with other(s) | Living alone | All | Married | Cohabiting | Living with other(s) | Living alone | All |
| Crude numbers (weighted %) | 1207 | 294 | 216 | 273 | 1990 | 1095 | 289 | 136 | 330 | 1850 |
| (61%) | (15%) | (11%) | (14%) | (100%) | (59%) | (16%) | (7%) | (18%) | (100%) | |
| Living with children b | ||||||||||
| Yes | 64 | 44 | 71 | — | 61 | 69 | 44 | 31 | — | 61 |
| Pc | <0.001 | <0.001 | ||||||||
| Family structure in childhood | ||||||||||
| Not living with both parents | 6 | 8 | 10 | 10 | 7 | 6 | 9 | 7 | 11 | 7 |
| P | <0.05 | <0.05 | ||||||||
| Serious conflicts within the family in childhood | ||||||||||
| Yes | 20 | 24 | 25 | 22 | 21 | 14 | 16 | 9 | 18 | 15 |
| P | 0.0869 | <0.05 | ||||||||
| Financial problems in childhood | ||||||||||
| Yes | 20 | 23 | 31 | 23 | 21 | 17 | 22 | 18 | 23 | 19 |
| P | <0.01 | 0.0676 | ||||||||
| Either parent's drinking problem | ||||||||||
| Yes | 21 | 23 | 18 | 18 | 21 | 14 | 20 | 8 | 21 | 16 |
| P | ns | <0.001 | ||||||||
| Either parent's mental health problem | ||||||||||
| Yes | 7 | 7 | 10 | 9 | 7 | 6 | 5 | 3 | 7 | 6 |
| P | ns | ns | ||||||||
| Education | ||||||||||
| High | 15 | 12 | 13 | 19 | 15 | 15 | 8 | 6 | 9 | 12 |
| Medium | 65 | 62 | 59 | 58 | 63 | 63 | 62 | 63 | 56 | 62 |
| Low | 20 | 26 | 29 | 23 | 22 | 22 | 31 | 32 | 35 | 26 |
| P | <0.01 | <0.001 | ||||||||
| Urbanisation | ||||||||||
| Rural | 26 | 23 | 17 | 10 | 22 | 23 | 18 | 31 | 22 | 23 |
| Semi-urban | 43 | 39 | 38 | 38 | 41 | 44 | 45 | 45 | 43 | 44 |
| Urban | 31 | 38 | 45 | 53 | 37 | 32 | 37 | 24 | 34 | 33 |
| P | <0.001 | <0.01 | ||||||||
| Religious activity | ||||||||||
| Yes | 11 | 3 | 11 | 10 | 10 | 7 | 1 | 5 | 5 | 6 |
| P | <0.01 | <0.05 | ||||||||
| Main activity | ||||||||||
| Employed | 81 | 74 | 70 | 77 | 79 | 91 | 89 | 68 | 68 | 85 |
| Other | 11 | 14 | 9 | 11 | 11 | 5 | 6 | 15 | 13 | 7 |
| Unemployed | 8 | 12 | 21 | 12 | 10 | 4 | 4 | 17 | 19 | 8 |
| P | <0.001 | <0.001 | ||||||||
| Financial difficulties | ||||||||||
| No difficulties | 89 | 83 | 66 | 81 | 85 | 90 | 88 | 85 | 77 | 87 |
| Some difficulties | 10 | 15 | 25 | 14 | 12 | 8 | 9 | 11 | 10 | 9 |
| Major difficulties | 1 | 2 | 9 | 6 | 3 | 1 | 3 | 5 | 13 | 4 |
| P | <0.001 | <0.001 | ||||||||
| Emotional help from others | ||||||||||
| 0–1 person | 26 | 28 | 49 | 45 | 31 | 44 | 40 | 63 | 61 | 48 |
| P | <0.001 | <0.001 | ||||||||
| Practical help from others | ||||||||||
| 0–1 person | 29 | 36 | 49 | 44 | 34 | 40 | 45 | 61 | 61 | 46 |
| P | <0.001 | <0.001 | ||||||||
| Social contacts | ||||||||||
| Rare | 20 | 22 | 24 | 25 | 21 | 29 | 36 | 36 | 37 | 32 |
| P | ns | <0.05 | ||||||||
Data on subjects with information on either alcohol consumption or alcohol dependence.
Persons living alone were excluded from these analyses.
P -value for the significance of the variable in the age-adjusted logistic regression model, adjusted Wald test.
ns = not significant.
The contribution of the hypothesized explanatory or mediating variables to the association between the outcome variables and living arrangements was assessed by separately adding them to the age-adjusted base model. Only variables that were at least marginally associated ( P < 0.1) with both living arrangements and either outcome measures among either gender were considered. The percentage change in the association between living arrangements and unhealthy alcohol use after adjusting for a specific variable was calculated as 100× [(OR (base model) − OR (base model+variable) )/(OR (base model) − 1)].
Results
About 60% of the respondents were married and ∼15% cohabited (Table 1 ). Living alone was more common among men, whereas living with other(s) was more common among women. About two thirds of the married as well as of women living with other(s) had co-resident children, whereas less than half of cohabiters and only 30% of men living with other(s) lived with children. Other variables were associated with living arrangements with at least marginal significance ( P < 0.1) among either or both genders, with the exception of either parent's mental health problems.
Heavy drinking was twice as prevalent in men (15%) than in women (8%) (Table 2 ). Compared with married persons, those in other living arrangements had elevated odds for heavy drinking, with stronger associations in men. Living with children did not associate with heavy drinking among either gender, and no statistically significant interaction was found between living arrangements and co-resident children. Most of the other variables had significant associations with heavy drinking among either gender, with the exception of family structure in childhood, either parent's mental health problem, and emotional and practical help.
Age-adjusted prevalence (%) of heavy drinking and alcohol dependence by gender, living arrangements, living with children, social environment in childhood, sociodemographic variables, religious activity, and social support variables, age-group 30–54 years
| Women | Men | |||||||
|---|---|---|---|---|---|---|---|---|
| Variable | Heavy drinking ⩾140 grams/week a | Alcohol dependence b | Heavy drinking ⩾280 grams/week c | Alcohol dependence d | ||||
| All N (%) | 153 (8%) | 40 (2%) | 277 (15%) | 136 (8%) | ||||
| % | OR | % | OR | % | OR | % | OR | |
| Living arrangements | ||||||||
| Married | 7 | 1.00 | 1 | 1.00 | 12 | 1.00 | 5 | 1.00 |
| Cohabiting | 10 | 1.54 | 4 | 2.56 | 18 | 1.71 | 10 | 2.29 |
| Living with other(s) | 10 | 1.62 | 1 | 0.65 | 20 | 1.93 | 7 | 1.37 |
| Living alone | 10 | 1.67 | 5 | 4.43 | 22 | 2.15 | 16 | 3.66 |
| Pe | <0.05 | <0.01 | <0.001 | <0.001 | ||||
| Living with children f | ||||||||
| Yes | 7 | 1.00 | 1 | 1.00 | 13 | 1.00 | 5 | 1.00 |
| No | 8 | 1.39 | 3 | 3.16 | 15 | 0.98 | 8 | 1.40 |
| P | ns | <0.05 | ns | ns | ||||
| Family structure in childhood | ||||||||
| Living with both parents | 8 | 1.00 | 2 | 1.00 | 15 | 1.00 | 7 | 1.00 |
| Not living with both parents | 5 | 0.57 | 3 | 1.43 | 19 | 1.36 | 14 | 1.97 |
| P | ns | ns | ns | <0.05 | ||||
| Serious conflicts within the family in childhood | ||||||||
| No | 7 | 1.00 | 1 | 1.00 | 16 | 1.00 | 8 | 1.00 |
| Yes | 12 | 1.74 | 5 | 3.12 | 14 | 0.90 | 10 | 1.30 |
| P | <0.01 | <0.001 | ns | ns | ||||
| Financial problems in childhood | ||||||||
| No | 7 | 1.00 | 2 | 1.00 | 15 | 1.00 | 7 | 1.00 |
| Yes | 11 | 1.57 | 2 | 1.13 | 19 | 1.37 | 11 | 1.53 |
| P | <0.05 | ns | <0.05 | 0.0573 | ||||
| Either parent's drinking problem | ||||||||
| No | 7 | 1.00 | 2 | 1.00 | 15 | 1.00 | 7 | 1.00 |
| Yes | 12 | 1.77 | 4 | 2.74 | 18 | 1.27 | 9 | 1.28 |
| P | <0.01 | <0.01 | ns | ns | ||||
| Either parent's mental health problem | ||||||||
| No | 8 | 1.00 | 2 | 1.00 | 16 | 1.00 | 8 | 1.00 |
| Yes | 11 | 1.44 | 4 | 2.26 | 13 | 0.80 | 8 | 1.08 |
| P | ns | 0.0731 | ns | ns | ||||
| Education | ||||||||
| High | 12 | 1.00 | 2 | 1.00 | 9 | 1.00 | 5 | 1.00 |
| Medium | 7 | 0.56 | 2 | 0.90 | 17 | 2.12 | 8 | 1.68 |
| Low | 8 | 0.76 | 2 | 1.15 | 15 | 1.68 | 8 | 1.63 |
| P | <0.05 | ns | <0.01 | ns | ||||
| Urbanisation | ||||||||
| Rural | 4 | 1.00 | 1 | 1.00 | 15 | 1.00 | 7 | 1.00 |
| Semi-urban | 6 | 1.60 | 2 | 2.29 | 16 | 1.04 | 6 | 0.99 |
| Urban | 12 | 3.31 | 3 | 2.93 | 15 | 1.02 | 11 | 1.72 |
| P | <0.001 | ns | ns | <0.05 | ||||
| Religious activity | ||||||||
| Yes | 3 | 1.00 | 1 | 1.00 | 5 | 1.00 | 4 | 1.00 |
| No | 9 | 2.80 | 2 | 4.13 | 16 | 3.5 | 8 | 1.92 |
| P | <0.05 | ns | <0.05 | ns | ||||
| Main activity | ||||||||
| Employed | 8 | 1.00 | 2 | 1.00 | 15 | 1.00 | 7 | 1.00 |
| Other | 5 | 0.51 | 3 | 1.93 | 11 | 0.73 | 7 | 1.04 |
| Unemployed | 11 | 1.51 | 5 | 3.18 | 29 | 2.37 | 24 | 4.28 |
| P | <0.05 | <0.01 | <0.001 | <0.001 | ||||
| Financial difficulties | ||||||||
| No difficulties | 8 | 1.00 | 2 | 1.00 | 15 | 1.00 | 7 | 1.00 |
| Some difficulties | 7 | 0.86 | 3 | 1.51 | 16 | 1.04 | 9 | 1.30 |
| Major difficulties | 23 | 3.56 | 13 | 9.50 | 26 | 2.05 | 32 | 6.25 |
| P | <0.01 | <0.001 | <0.05 | <0.001 | ||||
| Emotional help from others | ||||||||
| ⩾2 persons | 8 | 1.00 | 2 | 1.00 | 16 | 1.00 | 8 | 1.00 |
| 0–1 person | 8 | 1.00 | 3 | 1.98 | 15 | 0.90 | 8 | 1.00 |
| P | ns | <0.05 | ns | ns | ||||
| Practical help from others | ||||||||
| ⩾2 persons | 8 | 1.00 | 2 | 1.00 | 15 | 1.00 | 7 | 1.00 |
| 0–1 person | 9 | 1.23 | 3 | 1.67 | 16 | 0.99 | 8 | 1.12 |
| P | ns | ns | ns | ns | ||||
| Social contacts | ||||||||
| Frequent | 7 | 1.00 | 2 | 1.00 | 15 | 1.00 | 7 | 1.00 |
| Rare | 11 | 1.70 | 3 | 1.90 | 15 | 0.99 | 9 | 1.28 |
| P | <0.01 | 0.0752 | ns | ns | ||||
N = 1923 (= all data available for alcohol consumption or alcohol dependence).
N = 1860 (= all data available for alcohol consumption or alcohol dependence).
N = 1799 (= all data available for alcohol consumption or alcohol dependence).
N = 1713 (= all data available for alcohol consumption or alcohol dependence).
P -value for the significance of the variable in the age-adjusted logistic regression model, adjusted Wald test.
Persons living alone were excluded from these analyses.
ns = not significant.
Alcohol dependence was clearly less common than heavy drinking in men (8%) and women (2%) (Table 2 ). Among both genders, cohabiters and persons living alone had the highest odds for alcohol dependence. Women who did not live with children were three times more likely to be alcohol dependent. Among men, the main effect of living with children was not significant, but a weak ( P = 0.06) interaction between co-resident children and living arrangements was found, suggesting that having children in the household decreased the odds for alcohol dependence among cohabiting men, whereas in men living with other(s), those living with children were more likely to be alcohol dependent than those living with other adults (Fig. 1 ). With the exception of education, religious activity and practical help, all the other variables were associated with alcohol dependence among either gender.
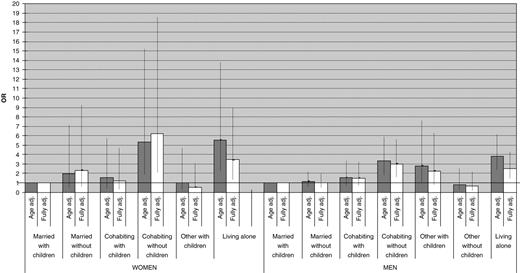
Age-adjusted 12-month prevalence of alcohol dependence by gender, living arrangements and co-resident children*, age group 30 to 54 years (OR, reference group Married with children = 1)
*Among women living with other(s) than a partner and without children there were no subjects with alcohol dependence. Age adj. = age-adjusted.
Fully adj. = adjusted for age, social environment in childhood, sociodemographic variables and social support variables.
Compared with married women, the elevated relative odds for heavy drinking of women in other living arrangements were reduced by ∼15–45% after adjustment for urbanisation (Table 3 ). Adjusting for religious activity attenuated the odds by 15% among cohabiting women. Also, adjusting for main activity, financial difficulties, and social contacts slightly attenuated the association between living arrangements and heavy drinking in women ( P -values rendered non-significant in the fully adjusted model). In men living alone, adjusting for main activity and financial difficulties attenuated the relative odds by ∼15 and ∼5%. In men living with other(s), adjustments for financial problems in childhood and adulthood, main activity and social contacts each slightly attenuated the odds for heavy drinking. Little effect was seen in cohabiting men.
Age-adjusted odds ratios for heavy drinking in the past month (women ⩾140 grams/week; men ⩾280 grams/week) by gender, living arrangements, social environment in childhood, sociodemographic variables, religious activity, and social contacts, age-group 30 to 54 years (OR with 95% CI)
| Living arrangements | Age | Age + serious conflicts within the family | Age + financial problems in childhood | Age + either parent's drinking problem | Age + educational level | Age + urbanisation | Age + religious activity | Age + main activity | Age + financial difficulties | Age + social contacts | Age + all |
|---|---|---|---|---|---|---|---|---|---|---|---|
| Women | |||||||||||
| Married | 1.00 | 1.00 | 1.00 | 1.00 | 1.00 | 1.00 | 1.00 | 1.00 | 1.00 | 1.00 | 1.00 |
| Cohabiting | 1.54 | 1.49 | 1.53 | 1.53 | 1.54 | 1.44 | 1.46 | 1.53 | 1.51 | 1.54 | 1.40 |
| 0.96–2.46 | 0.85–2.29 | ||||||||||
| Living with other(s) | 1.62 | 1.61 | 1.62 | 1.78 | 1.61 | 1.41 | 1.64 | 1.52 | 1.53 | 1.58 | 1.21 |
| 1.01–2.60 | 0.71–2.05 | ||||||||||
| Living alone | 1.67 | 1.72 | 1.73 | 1.73 | 1.63 | 1.37 | 1.67 | 1.66 | 1.64 | 1.63 | 1.30 |
| 1.07–2.63 | 0.81–2.08 | ||||||||||
| Pa | <0.05 | ns | |||||||||
| Men | |||||||||||
| Married | 1.00 | 1.00 | 1.00 | 1.00 | 1.00 | 1.00 | 1.00 | 1.00 | 1.00 | 1.00 | 1.00 |
| Cohabiting | 1.71 | 1.74 | 1.70 | 1.73 | 1.69 | 1.70 | — c | 1.75 | 1.70 | 1.72 | 1.70 |
| 1.17–2.49 | 1.14–2.56 | ||||||||||
| Living with other(s) than a partner | 1.93 | — b | 1.73 | — b | 1.91 | 1.93 | — c | 1.83 | 1.68 | 1.86 | 1.54 |
| 1.29–2.88 | 0.99–2.41 | ||||||||||
| Living alone | 2.15 | 2.25 | 2.17 | 2.15 | 2.16 | 2.15 | 2.16 | 2.00 | 2.09 | 2.15 | 1.93 |
| 1.55–3.00 | 1.32–2.81 | ||||||||||
| Pa | <0.001 | <0.01 |
P -value for the significance of the variable in the logistic regression model, adjusted Wald test.
There were no cases of heavy drinking among men with specific childhood adversity.
There were no cases of heavy drinking among men with regular religious activity.
ns = not significant.
Among cohabiting women, adjustments for serious conflicts within the family in childhood, main activity, and financial difficulties attenuated the relative odds for alcohol dependence compared with married women by ∼10% each, but we found no such effects in cohabiting men (Table 4 ). In women living alone, adjustment for urbanisation, main activity and financial difficulties as well as social support variables attenuated the relative odds by ∼5–30% each. In men living alone, adjustment for either parent's drinking problem attenuated the relative odds by 7%, whereas main activity and financial difficulties attenuated the elevated odds ratios by ∼25% each, and in the fully adjusted model, their relative odds were attenuated by ∼40%.
Age-adjusted odds ratios for 12-month prevalence of alcohol dependence by gender, living arrangements, social environment in childhood, sociodemographic variables, and social support variables, age group 30 to 54 years (OR with 95% CI)
| Living arrangements | Age | Age + family structure in childhood | Age + serious conflicts within the family | Age + financial problems in childhood | Age + either parent's drinking problem | Age + urbanisation | Age + main activity | Age + financial difficulties | Age + emotional help from others | Age + social contacts | Age + all |
|---|---|---|---|---|---|---|---|---|---|---|---|
| Women | |||||||||||
| Married | 1.00 | 1.00 | 1.00 | 1.00 | 1.00 | 1.00 | 1.00 | 1.00 | 1.00 | 1.00 | 1.00 |
| Cohabiting | 2.56 | 2.54 | 2.40 | 2.59 | 2.50 | 2.51 | 2.41 | 2.43 | 2.48 | 2.53 | 2.31 |
| 1.10–5.94 | 0.96–5.54 | ||||||||||
| Living with other(s) | 0.65 | — a | 0.59 | 0.64 | 0.67 | 0.61 | 0.54 | 0.45 | 0.56 | — a | 0.35 |
| 0.15–2.90 | 0.07–1.89 | ||||||||||
| Living alone | 4.43 | 4.46 | 4.45 | 4.42 | 4.31 | 3.94 | 4.20 | 3.48 | 4.03 | 4.24 | 2.63 |
| 2.03–9.64 | 1.15–6.01 | ||||||||||
| Pb | <0.01 | <0.05 | |||||||||
| Men | |||||||||||
| Married | 1.00 | 1.00 | 1.00 | 1.00 | 1.00 | 1.00 | 1.00 | 1.00 | 1.00 | 1.00 | 1.00 |
| Cohabiting | 2.29 | 2.27 | 2.32 | 2.29 | 2.26 | 2.25 | 2.32 | 2.24 | 2.35 | 2.30 | 2.21 |
| 1.44–3.64 | 1.35–3.63 | ||||||||||
| Living with other(s) | 1.37 | 1.38 | — a | 1.37 | 1.40 | 1.44 | 1.08 | 1.29 | 1.43 | 1.35 | 1.21 |
| 0.66–2.88 | 0.55–2.63 | ||||||||||
| Living alone | 3.66 2.39–5.59 | 3.57 | 3.52 | 3.57 | 3.48 | 3.69 | 2.99 | 2.94 | 3.70 | 3.52 | 2.55 1.58–4.11 |
| Pb | <0.001 | <0.001 |
There were no cases of alcohol dependence among subjects with specific childhood adversity or with rare social contacts.
P -value for the significance of the variable in the logistic regression model, adjusted Wald test.
Discussion
This study provides new information on differences in heavy drinking and alcohol dependence by living arrangements. Previous studies have focused on the relationship between marital status and alcohol consumption or substance use disorders, while relatively few studies have assessed living arrangements and co-resident children, or made adjustments for factors associated with unhealthy alcohol use separately for men and women.
Main results
We found marked differences between living arrangement groups in terms of heavy drinking and alcohol dependence. Cohabiters and persons living alone were about two to four times more likely than married persons to be heavy drinkers or to have alcohol dependence, and those living with other(s) than a partner were more likely to be heavy drinkers. Women living without children were about three times more likely to be alcohol dependent. Co-resident children attenuated the odds for alcohol dependence among all cohabiters. Among men living with other(s) than a partner, those living with children were more likely to be alcohol dependent than those living with other adults. Compared with married women, adjustment for urbanisation attenuated the odds for heavy drinking among cohabiting women and women living alone or with other(s) by ∼15–45%. Among both genders, adjusting for main activity and financial difficulties attenuated the relative odds for heavy drinking and alcohol dependence by ∼5–30% as compared with married persons, particularly in persons living alone. Little overall effect of adjustments was seen in the original relative odds for heavy drinking or alcohol dependence among cohabiting men.
Living arrangements, heavy drinking and alcohol dependence in Finland and elsewhere
In line with our results, cohabiters have been shown to have high levels of alcohol consumption among men and women in the United States, the Netherlands and Great Britain (Caetano et al. , 2006 ; Fryar et al. , 2006 ; Joung et al. , 1995 ; Power et al. , 1999 ; Schoenborn, 2004 ), and only among women in Germany (Helmert and Shea, 1998 ), as compared with the married. Compared with their married counterparts, there is evidence that cohabiting Canadian women appear to have more symptoms of alcohol use disorders (Fleming, 1996 ), cohabiting American women have high odds for alcohol dependence (Caetano et al. , 2006 ), and young American cohabiters have elevated levels of “alcohol problems” (Horwitz and White, 1998 ). With caution, we assume that these North American and Northern European countries resemble Finland and other Scandinavian countries in that cohabiting is relatively common, and it is an accepted social institution (Kiernan, 2002 ; Prinz, 1995 ; Smock and Gupta, 2002 ).
In support of our findings, living alone has been shown to associate with higher levels of unhealthy alcohol use in the United States (Hughes and Gove, 1981 ), and among elderly men in Finland, Italy and the Netherlands (van Gelder et al, 2006 ).
Having children and gaining the parental role have been shown to associate with decreased risk of heavy drinking and alcohol disorders in the United States (Chilcoat and Breslau, 1996 ; Umberson, 1992 ) and the Netherlands (Hajema and Knibbe, 1998 ), whereas another study found no association between co-resident children and “alcohol problems” (Horwitz et al. , 1996 ). These inconsistencies may arise from different effects of living with children depending on the parents' overall living arrangements, which the studies mentioned here did not assess. In our data, cohabiters not living with children had particularly elevated odds for alcohol dependence. However, as there were only 40 cases of alcohol dependence among women, this result should be interpreted with caution. Regarding lone parenthood, we presumed that men living with other(s) than a partner were a heterogeneous group whereas equivalent women were mostly lone parents. Heavy drinking, but not alcohol dependence, seemed to be elevated in persons living with other(s), but the associations rendered non-significant after adjustments. In the Netherlands, a high prevalence of substance use disorders has been reported among persons living with parent(s) or with other(s) than a partner (Bijl et al. , 1998 ). In Germany, the Netherlands and the United States, lone parents had elevated odds for substance use disorders (Afifi et al. , 2006 ; Bijl et al. , 1998 ; Klose and Jacobi, 2004 ). We found limited support for previous findings on excess alcohol dependence among lone parents, but the small number of cases of alcohol dependence among women limits any interpretations. It is also probable that in Finland, lone parenthood does not reflect a disadvantaged social position to the same extent than in other countries, as women's employment is supported by social policies and public childcare (Lahelma et al. , 2002 ).
Factors contributing to living arrangement differences in heavy drinking and alcohol dependence
We assumed that differences in unhealthy alcohol use by living arrangements may partially be explained by factors preceding both living arrangements and unhealthy alcohol use. Our general finding was that childhood adversities associated with unhealthy alcohol use particularly in women, as reported previously (Pirkola et al. , 2005a ), but the association between childhood adversities and current living arrangements was rather weak. Therefore no marked effects of adjusting for childhood adversities were seen on the association between living arrangements and unhealthy alcohol use in the logistic models.
In line with previous studies (Bloomfield et al. , 2006 ), among women high education associated with heavy drinking and with living alone, whereas the opposite was seen in men. This gender difference may result from higher levels of consumption classified as ‘heavy drinking’ among men, or it may reflect a true gender difference in drinking patterns.
Alcohol disorders have been shown to concentrate in urban areas in several European countries (Alonso et al. , 2004 ; Sundquist and Frank, 2004 ). Accordingly, we found urbanisation level to be the most important factor in the excess heavy drinking of all non-married women. “Stressful life circumstances and lack of social support” in urban areas may promote drinking (Sundquist and Frank, 2004 ), as well as lack of social control and the availability of diverse entertainment and locations for drinking alcohol. Living in urban areas was clearly more common among women not living with a partner compared with married or cohabiting women. This is partly due to the fact that in Finland, changes in the labour market have promoted internal migration from agriculture in rural areas to manufacturing and services in urban areas, and the sex-selective migration has resulted in a surplus of women in urban areas (Kupiszewski et al. , 2000 ).
Religion has rarely been assessed in studies on associations between living arrangements and health. We found adjustment for religious activity to reduce the excess heavy drinking of cohabiting women by 15%. Regular participation in religious activities has been reported to associate with high marriage rates (Fu and Goldman, 1996 ), and marital happiness and stability seem to be common among the more religious (Koenig, 2001 ). As religious subjects have been shown to report lower levels of “alcohol use/abuse”, religion seems to be an agent of social control (Koenig, 2001 ). All in all, we found only modest support for the assumption that the association between living arrangements and unhealthy alcohol use results from factors preceding these both.
However, the role of other, possibly mediating factors was somewhat stronger, as adjustments for main activity and financial difficulties reduced the relative odds for heavy drinking and alcohol dependence among men and women. Accordingly, previous studies have reported strong associations between unemployment, unhealthy alcohol use and living alone (Alonso et al. , 2004 ; Bijl et al. , 1998 ; Schoenborn, 2004 ). Particularly among men, not living with a spouse may be associated with the accumulation of risk factors, such as unemployment, financial difficulties and little social support, which may further lead to unhealthy alcohol use and social marginalisation. It is plausible that the effect of these factors works both ways, as unhealthy alcohol use may lead to unemployment and financial problems, which cause stress on personal relationships. Among women, rare social contacts and little emotional help associated with unhealthy alcohol use, but adjustments for social support variables had only modest effects.
Due to limitations in our data, we were not able to assess direct selection, according to which those using alcohol excessively may end up in unfavourable living arrangements. In addition, our data did not include other factors that probably affect both living arrangements and unhealthy alcohol use, such as social control and other psychosocial factors. Some form of social control of unhealthy behaviour may have existed among cohabiters, as the odds for heavy drinking and alcohol dependence were consistently highest in persons living alone. Living with children did not seem to associate with heavy drinking, but the protective effect of co-resident children on women's alcohol dependence appears to be in line with the social control theory (Umberson, 1992 ). In particular, children may act as an independent source of social control among cohabiters. Living with children may also reflect mutual commitment and social and economic support between partners that may be lacking in childless cohabiters.
Methodological considerations
Self-reported data on parental adversities should be interpreted with caution, as subjects not living with a partner or with current unhealthy alcohol use may be more likely to report parental drinking problems and other childhood adversities due to a need to explain the current state. Second, self-reports probably under-estimate the real levels of alcohol consumption, but this phenomenon is unlikely to vary by living arrangements. Third, we do not have information about the unhealthy alcohol use of about one fifth of the original sample, which is mostly accounted for by refusal to attend the health examination (Aromaa and Koskinen, 2004 ). Compared with those who completed the CIDI interview, those who only attended the health interview were more often single or widowed, and they had a low grade education. They also had more symptoms of depression and psychological distress (Pirkola et al. , 2005b ). It is thus likely that the drop-out population included more persons living alone and more persons with unhealthy alcohol use, and therefore our results probably underestimate differences in unhealthy alcohol use by living arrangements. Finally, the cross-sectional design of the study makes it difficult to draw definite conclusions about the relative importance of selection vs. causal explanations to the association between unhealthy alcohol use and living arrangements. Despite these limitations, our data provide valuable new information on the health of persons in different living arrangements.
Conclusions
Our study, in convergence with scattered evidence from other studies, shows that cohabiters, particularly those without co-resident children, persons living alone, and lone parents, seem to be the most vulnerable groups, on whom prevention and intervention programs on unhealthy alcohol use should focus. The accumulation of risk factors, such as unemployment, financial difficulties, little social support, and among women also living in urban areas, in the non-married population, seems to contribute to their high prevalence of unhealthy alcohol use and may lead to further social marginalisation.
This work was funded by a grant from the Academy of Finland (No.203418). Pekka Martikainen is supported by the Academy of Finland.
