


Abstract
The absence of individual-level socioeconomic information in most US health surveillance data necessitates using area-based socioeconomic measures (ABSMs) to monitor health inequalities. Using the 1989–1991 birth weight data from Massachusetts, the authors compared estimates of health disparities detected with census tract- and block group-level ABSMs pertaining to poverty and education, as well as parental education, both independently and together. In separate models, adjusted for infant's sex, mother's age, and parents' race/ethnicity, worst-off categories of census tract ABSMs and parental education had a comparable birth weight deficit of ∼70 g. Similar results were observed for low birth weight (<2,500 g), with worst-off categories of census tract ABSMs and parental education having an odds ratio of ∼1.37 (p < 0.001). In mutually adjusted models for birth weight and low birth weight, census tract ABSMs still detected an effect estimate nearly 50% of that detected by parental education. Additionally, census tract ABSMs detected socioeconomic gradients in birth weight among births to mothers aged less than 25 years, an age group in which educational attainment is unlikely to be completed. These results suggest that aptly chosen ABSMs can be used to monitor socioeconomic inequalities in health. The risk, if any, in the absence of individual-level socioeconomic information is a conservative estimate of socioeconomic inequalities in health.
The absence of socioeconomic information at the individual level in most health surveillance data in the United States imposes severe restriction for quantifying socioeconomic inequalities in health (1, 2). Even when such information is available, from a public health monitoring perspective, validity of individual-based socioeconomic measures limits the wider application of such information (3, 4). For instance, it is well known that educational information on older, less-educated, deceased individuals tends to be “inflated” (5, 6). Individual-based educational levels also tend to be less meaningful for quantifying health disparities for younger persons (e.g., aged <25 years) who have not necessarily completed their educational attainment. Under such circumstances, area-based socioeconomic measures (ABSMs) (7) can be uniquely relevant for monitoring population-level socioeconomic health inequities (1, 8). It is well known that ABSMs miss a substantial proportion of between-individual/within-area variation in education and income (9, 10), but there is evidence that the area-based measures capture other aspects of socioeconomic position that often cannot be captured by individual-based measures of socioeconomic position (11, 12). The aim of this study is to compare the performance of census tract ABSM estimates with individual-based education estimates in predicting birth weight, an outcome that is well known for its relevance for a range of outcomes (13–21), in addition to being sensitive to measures of socioeconomic position (22).
MATERIALS AND METHODS
Data
The study consisted of all births (n = 267,531) occurring in Massachusetts for the time period, 1989–1991. Birth certificate data were provided by the Massachusetts Department of Public Health. Geocoding of the birth certificates to block groups and census tracts was done by a commercial firm chosen on the basis of accuracy of geocoding and completeness (23). We excluded births to mothers aged less than 15 years or more than 55 years. Additional exclusions were on observations with missing birth weight, multiple births, “outlier” birth weights (either <150 or >6,000 g), and block groups/census tracts with missing socioeconomic data, resulting in a final analytical sample of 226,927 births. US Census Bureau data on ABSMs were obtained from the 1990 Census Summary Tape File 3A (STF 3A) (http://www.census.gov/mp/www/90CD/msrom6ae.html) for census tracts and block groups. The block group, a subdivision of the census tract, is the smallest geographic census unit for which census socioeconomic data are tabulated and, on average, contains 1,000 people (24). Census tracts, meanwhile, on average, contain 4,000 persons and are defined as “small, relatively permanent statistical subdivisions of a county” (24, p. A-11) by the US Census Bureau and are “designed to be relatively homogeneous with respect to population characteristics, economic status, and living conditions” (24, p. A-11). Use of the data was approved by the Massachusetts Department of Public Health and the Human Subjects Committee of the Harvard School of Public Health.
Outcome
We modeled birth weight as both a continuous response variable (measured in grams) and a binary outcome, low birth weight (<2,500 g) or not. Given our focus on evaluating the change in effect of ABSMs under different model specifications, modeling birth weight as a continuous outcome allows interpretation of the resultant differences in absolute terms (i.e., actual birth weight) and, as such, is not sensitive to transformations (e.g., log of the odds, probability, odds ratio, or relative risk). Given the clinical and policy relevance of low birth weight, we additionally conducted analysis with low birth weight as an outcome.
Predictors
Table 1 presents the individual-based and area-based predictors (or independent variables) considered for the statistical models. At the individual level, we considered infant's sex, mother's age, mother's and father's race/ethnicity, and mother's and father's educational status. Missingness on parental race/ethnicity and education was modeled as a separate category given their potential social patterning (25, 26). At the block group and census tract levels, we considered three ABSM categories: 1) fraction of the population aged 25 or more years with less than a high school education; 2) fraction of the population aged 25 or more years with a college education or greater; and 3) fraction of the population living below the federal poverty line. Although the fraction of the population living in poverty has been shown to be consistent and useful for monitoring health disparities (27), the two area-based education measures reflect the area analogs of individual-level education. The a priori cutpoints for all three ABSMs were informed by prior research on estimating the burden of socioeconomic inequalities in health (8, 27–29).
Frequency of variables, along with mean birth weight, standard deviation, and low birth weight births, Massachusetts, 1989–1991
Predictor variables | Frequency | Mean birth weight (g) | Standard deviation (g) | Low birth weight births (<2,500 g) | ||||
|---|---|---|---|---|---|---|---|---|
| No. | % | No. | % | |||||
| Infant's sex | ||||||||
| Male | 116,355 | 51.3 | 3,480 | 582 | 5,100 | 4.4 | ||
| Female | 110,572 | 48.7 | 3,350 | 551 | 5,689 | 5.1 | ||
| Mother's age (years) | ||||||||
| 15–19 | 15,654 | 6.9 | 3,250 | 578 | 1,148 | 7.3 | ||
| 20–24 | 43,655 | 19.2 | 3,340 | 561 | 2,390 | 5.5 | ||
| 25–29 | 69,272 | 30.5 | 3,430 | 559 | 2,943 | 4.2 | ||
| 30–34 | 65,234 | 28.7 | 3,460 | 564 | 2,652 | 4.1 | ||
| ≥35 | 33,112 | 14.6 | 3,460 | 590 | 1,656 | 5.0 | ||
| Mother's race/ethnicity | ||||||||
| White, non-Hispanic | 174,563 | 76.9 | 3,460 | 556 | 6,885 | 3.9 | ||
| Black, non-Hispanic | 18,171 | 8.0 | 3,190 | 640 | 1,821 | 10.0 | ||
| Asian, Pacific Islander, non-Hispanic | 5,899 | 2.6 | 3,190 | 495 | 374 | 6.3 | ||
| American Indian, non-Hispanic | 368 | 0.2 | 3,310 | 604 | 28 | 7.6 | ||
| Other, non-Hispanic | 2,105 | 1.5 | 3,310 | 566 | 136 | 6.5 | ||
| Hispanic | 24,934 | 11.0 | 3,300 | 559 | 1,488 | 6.0 | ||
| Missing | 887 | 0.4 | 3,360 | 685 | 57 | 6.4 | ||
| Father's race/ethnicity | ||||||||
| White, non-Hispanic | 160,391 | 70.7 | 3,480 | 547 | 5,702 | 3.6 | ||
| Black, non-Hispanic | 11,280 | 5.0 | 3,290 | 615 | 846 | 7.5 | ||
| Asian, Pacific Islander, non-Hispanic | 4,201 | 1.9 | 3,210 | 483 | 248 | 5.9 | ||
| American Indian, non-Hispanic | 328 | 0.1 | 3,360 | 649 | 24 | 7.3 | ||
| Other, non-Hispanic | 1,719 | 0.8 | 3,330 | 568 | 108 | 6.3 | ||
| Hispanic | 19,359 | 8.5 | 3,320 | 539 | 984 | 5.1 | ||
| Missing | 29,649 | 13.1 | 3,210 | 631 | 2,877 | 9.7 | ||
| Mother's education | ||||||||
| Less than high school | 39,383 | 17.3 | 3,270 | 577 | 2,863 | 7.3 | ||
| High school | 71,904 | 31.7 | 3,390 | 577 | 3,723 | 5.2 | ||
| Some college | 53,036 | 23.4 | 3,460 | 562 | 2,087 | 3.9 | ||
| College or greater | 61,426 | 27.1 | 3,500 | 540 | 2,035 | 3.3 | ||
| Missing | 1,178 | 0.5 | 3,320 | 675 | 81 | 6.9 | ||
| Father's education | ||||||||
| Less than high school | 25,624 | 11.3 | 3,330 | 558 | 1,405 | 5.5 | ||
| High school | 67,250 | 29.6 | 3,420 | 559 | 2,941 | 4.4 | ||
| Some college | 36,796 | 16.2 | 3,470 | 556 | 1,398 | 3.8 | ||
| College or greater | 66,457 | 29.3 | 3,500 | 538 | 2,105 | 3.2 | ||
| Missing | 30,800 | 13.6 | 3,210 | 627 | 2,940 | 9.5 | ||
| Census tract adult population fraction aged ≥25 years with less than a high school education (%) | ||||||||
| 0.0–14.9 | 475 | 36.7 | 3,490 | 80 | 2,653 | 3.6 | ||
| 15.0–24.9 | 402 | 31.0 | 3,440 | 77.5 | 3,077 | 4.3 | ||
| 25.0–39.9 | 267 | 20.6 | 3,360 | 98.9 | 3,160 | 5.8 | ||
| 40.0–100 | 151 | 11.7 | 3,310 | 137 | 1,899 | 6.9 | ||
| Block group adult population fraction aged ≥25 years with less than a high school education (%) | ||||||||
| 0.0–14.9 | 2,279 | 41.8 | 3,480 | 154 | 3,034 | 3.6 | ||
| 15.0–24.9 | 1,450 | 26.6 | 3,450 | 133 | 2,570 | 4.3 | ||
| 25.0–39.9 | 1,109 | 20.3 | 3,380 | 151 | 2,925 | 5.7 | ||
| 40.0–100 | 620 | 11.4 | 3,310 | 148 | 2,260 | 6.9 | ||
| Census tract adult population fraction aged ≥25 years with college education or greater (%) | ||||||||
| 0.0–14.9 | 383 | 29.6 | 3,360 | 121 | 4,579 | 6.1 | ||
| 15.0–24.9 | 357 | 27.6 | 3,430 | 78.7 | 2,956 | 4.5 | ||
| 25.0–39.9 | 305 | 23.6 | 3,470 | 86.8 | 1,993 | 3.9 | ||
| 40.0–100 | 250 | 19.3 | 3,470 | 105 | 1,261 | 3.7 | ||
| Block group adult population fraction aged ≥25 years with college education or greater (%) | ||||||||
| 0.0–14.9 | 1,691 | 31.0 | 3,370 | 162 | 4,818 | 6.0 | ||
| 15.0–24.9 | 1,371 | 25.1 | 3,440 | 137 | 2,668 | 4.5 | ||
| 25.0–39.9 | 1,286 | 23.6 | 3,470 | 142 | 1,969 | 3.9 | ||
| 40.0–100 | 1,110 | 20.3 | 3,480 | 162 | 1,334 | 3.6 | ||
| Census tract population fraction below poverty line (%) | ||||||||
| 0.0–4.9 | 486 | 37.5 | 3,490 | 64.7 | 2,914 | 3.5 | ||
| 5.0–9.9 | 384 | 29.7 | 3,440 | 77.2 | 2,737 | 4.3 | ||
| 10.0–19.9 | 225 | 17.4 | 3,390 | 117 | 2,180 | 5.4 | ||
| 20.0–100 | 200 | 15.4 | 3,280 | 99.0 | 2,958 | 7.5 | ||
| Block group population fraction below poverty line (%) | ||||||||
| 0.0–4.9 | 2,518 | 46.1 | 3,480 | 153 | 3,446 | 3.7 | ||
| 5.0–9.9 | 1,262 | 23.1 | 3,440 | 131 | 2,180 | 4.2 | ||
| 10.0–19.9 | 953 | 17.5 | 3,400 | 152 | 2,180 | 5.3 | ||
| 20.0–100 | 725 | 13.3 | 3,300 | 145 | 2,983 | 7.4 | ||
Statistical analysis
Multilevel linear regression techniques (30, 31) were utilized to model the variation in birth weight with a four-level hierarchical structure of 226,927 singleton births (level 1) nested within 5,458 block groups (level 2), 1,295 census tracts (level 3), and 14 counties (level 4). Low birth weight, meanwhile, was modeled by a multilevel logistic regression approach with the above structure. Given the multilevel structure of the data and our interest in estimating the effects of area-level variables, a multilevel modeling approach was appropriate (32–34). The regression estimates from the linear models are maximum likelihood based, using the iterative generalized least-squares algorithm, while the estimates for the logistic models are based on penalized/predictive quasi-likelihood estimates with second-order Taylor series linearization procedures (30, 35).
Modeling strategy
We calibrated two types of models. We separately modeled birth weight and low birth weight as a function of either census tract or block group ABSM or parental education, adjusting for individual demographic variables (model A). This model allowed quantification of disparities in birth weight and low birth weight by census tract and block group ABSMs and by individual-based socioeconomic measure, each in the absence of the other. Model B considered census tract and block group ABSMs and parental education simultaneously, in addition to individual-level demographic variables, thus quantifying socioeconomic disparities that are uniquely attributable to ABSMs and parental education. All models considered each ABSM separately. Because prior studies suggest age-specific trends in prevalence of (low) birth weight (36, 37), we also repeated model B across three maternal age strata: 15–19, 20–24, and 25 or more years. Our motivation was that the use of ABSMs for quantifying socioeconomic inequalities in birth weight would be even more relevant in ages less than 25 years, where individual-level education is less informative.
RESULTS
The kernel density plot of the birth weight distribution by categories of census tract ABSM (figure 1) suggests a downward shift in the entire birth weight distribution associated with each of the categories of the three census tract ABSMs, with worst-off census tracts having lower mean birth weight. The crude birth weight deficits in the worst-off census tracts (compared with the best off) were 213 g for the fraction of the population living below the poverty level, 199 g for the fraction of the population with less than a high school education, and 130 g for the fraction of the population with a college-level education or greater. Census tracts that were worst off had a far greater proportion of low birth weight infants compared with the best-off census tracts. The crude birth weight deficit translated to an approximately twofold increase in low birth weight prevalence. In census tracts with more than 20 percent poverty, the low birth weight prevalence was 7.5 percent compared with 3.5 percent in the census tracts with less than 5 percent poverty. Similarly, the range (across extreme categories) in low birth weight prevalence in the other educational census tract ABSMs was 7.0–3.6 percent for the fraction of the population with less than a high school education and 6.0–3.7 percent for the fraction of the population with a college education or greater.
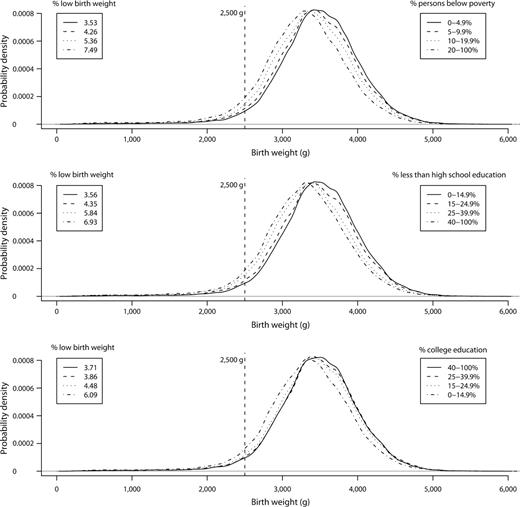
Birth weight distribution for categories of census tract population fractions below the poverty line (top), with less than a high school education (middle), and with a college education or greater (bottom), Massachusetts, 1989–1991.
Adjusting for infants's sex, mother's age, and parental race/ethnicity, we observed an independent association between census tract ABSMs and birth weight (table 2). Infants in census tract ABSM categories associated with the population having the highest fraction of less than a high school education and poverty weighed ∼70 g less than did those in the lowest fraction of these two census tract ABSMs. The census tract gradient in the fraction of the population with a college education was smaller, with a birth weight deficit of ∼45 g in areas with the lowest fraction. A similar pattern was observed with block group ABSMs, with the best/worst birth weight differential being smaller compared with similar census tract ABSMs (table 2). Parental education was a strong predictor of birth weight (even after adjustment for parental race/ethnicity and mother's age) (table 2). Infants whose mothers or fathers had less than a high school education weighed ∼80 g and ∼60 g less compared with those whose mothers or fathers had a college education or greater. Of note, infants whose fathers did not report their education had the largest birth weight deficit of 93 g.
Fixed-part results showing the relation among birth weight (in grams), parental education, and three area-based socioeconomic measures, Massachusetts, 1989–1991*
Predictor variables | Model A | Model B | ||||||||||||||||||||
|---|---|---|---|---|---|---|---|---|---|---|---|---|---|---|---|---|---|---|---|---|---|---|
| Area-based socioeconomic measure | Parental education | Adult population fraction aged ≥25 years | Population fraction living below the federal poverty line | |||||||||||||||||||
| Census tract | Block group | Less than a high school education | College education or greater | |||||||||||||||||||
| β | 95% confidence interval | β | 95% confidence interval | β | 95% confidence interval | β | 95% confidence interval | β | 95% confidence interval | β | 95% confidence interval | |||||||||||
| Census tract adult population fraction aged ≥25 years with less than a high school education (%) | ||||||||||||||||||||||
| 0.0–14.9 | Referent | Referent | Referent | Referent | ||||||||||||||||||
| 15.0–24.9 | −17.8 | −24.6, −11.1 | −5.3 | −13.2, 2.5 | ||||||||||||||||||
| 25.0–39.9 | −50.2 | −58.2, −42.2 | −20.2 | −30.8, −9.5 | ||||||||||||||||||
| 40.0–100 | −72.0 | −82.5, −61.6 | −27.3 | −42.8, −11.9 | ||||||||||||||||||
| Block group adult population fraction aged ≥25 years with less than a high school education (%) | ||||||||||||||||||||||
| 0.0–14.9 | Referent | Referent | Referent | Referent | ||||||||||||||||||
| 15.0–24.9 | −12.5 | −19.0, −6.0 | 1.5 | −6.0, 9.0 | ||||||||||||||||||
| 25.0–39.9 | −42.6 | −50.0, −35.3 | −11.5 | −21.2, −1.7 | ||||||||||||||||||
| 40.0–100 | −62.7 | −72.2, −53.4 | −13.9 | −27.8, −0.1 | ||||||||||||||||||
| Census tract adult population fraction aged ≥25 years with college education or greater (%) | ||||||||||||||||||||||
| 40.0–100 | Referent | Referent | Referent | Referent | ||||||||||||||||||
| 25.0–39.9 | 5.9 | −2.9, 14.7 | 14.7 | 3.3, 26.0 | ||||||||||||||||||
| 15.0–24.9 | −13.7 | −22.3, −5.1 | 6.8 | −6.1, 19.7 | ||||||||||||||||||
| 0.0–14.9 | −44.4 | −53.5, −35.3 | −5.4 | −19.8, 9.0 | ||||||||||||||||||
| Block group adult population fraction aged ≥25 years with college education or greater (%) | ||||||||||||||||||||||
| 40.0–100 | Referent | Referent | Referent | Referent | ||||||||||||||||||
| 25.0–39.9 | −1.0 | −9.3, 7.2 | 1.6 | −9.3, 12.5 | ||||||||||||||||||
| 15.0–24.9 | −15.8 | −24.1, −7.5 | −2.1 | −14.4, 10.2 | ||||||||||||||||||
| 0.0–14.9 | −43.9 | −52.3, −35.4 | −12.5 | −26.1, 1.0 | ||||||||||||||||||
| Census tract population fraction below poverty line (%) | ||||||||||||||||||||||
| 0.0–4.9 | Referent | Referent | Referent | Referent | ||||||||||||||||||
| 5.0–9.9 | −20.9 | −27.6, −14.3 | −9.8 | −16.9, −2.6 | ||||||||||||||||||
| 10.0–19.9 | −47.5 | −55.7, −39.3 | −24.5 | −34.4, −14.6 | ||||||||||||||||||
| 20.0–100 | −69.6 | −79.1, −60.1 | −37.6 | −50.6, −24.6 | ||||||||||||||||||
| Block group population fraction below poverty line (%) | ||||||||||||||||||||||
| 0.0–4.9 | Referent | Referent | Referent | Referent | ||||||||||||||||||
| 5.0–9.9 | −14.9 | −21.4, −8.4 | −4.6 | −11.5, 2.3 | ||||||||||||||||||
| 10.0–19.9 | −35.2 | −42.6, −27.7 | −8.5 | −17.4, 0.4 | ||||||||||||||||||
| 20.0–100 | −54.8 | −63.4, −46.1 | −10.0 | −21.8, 1.9 | ||||||||||||||||||
| Mother's education | ||||||||||||||||||||||
| Less than high school | −78.5 | −88.2, −68.7 | −73.3 | −83.1, −63.4 | −75.1 | −85.0, −65.3 | −73.8 | −83.6, −64.0 | ||||||||||||||
| High school | −40.8 | −48.4, −33.2 | −37.9 | −45.5, −30.3 | −39.1 | −46.7, −31.5 | −38.8 | −46.4, −31.2 | ||||||||||||||
| Some college | −2.2 | −9.4, 4.9 | −0.7 | −7.9, 6.5 | −1.6 | −8.8, 5.6 | −1.6 | −8.7, 5.6 | ||||||||||||||
| College education or greater | Referent | Referent | Referent | Referent | Referent | Referent | Referent | Referent | ||||||||||||||
| Missing | −8.3 | −46.2, 29.5 | −6.3 | −44.1, 31.6 | −7.1 | −44.9, 30.8 | −6.9 | −44.8, 30.9 | ||||||||||||||
| Father's education | ||||||||||||||||||||||
| Less than high school | −60.6 | −70.7, −50.4 | −54.8 | −65.1, −44.5 | −57.0 | −67.2, −46.7 | −55.4 | −65.6, −45.1 | ||||||||||||||
| High school | −36.1 | −43.4, −28.7 | −32.8 | −40.2, −25.4 | −33.9 | −41.4, −26.5 | −33.6 | −40.9, −26.2 | ||||||||||||||
| Some college | −11.5 | −19.2, −3.9 | −9.6 | −17.3, −1.9 | −10.5 | −18.2, −2.8 | −10.3 | −17.9, −2.6 | ||||||||||||||
| College education or greater | Referent | Referent | Referent | Referent | Referent | Referent | Referent | Referent | ||||||||||||||
| Missing | −93 | −118.5, −67.5 | −88.3 | −113.8, −62.8 | −90.4 | −115.9, −64.9 | −88.5 | −113.9, −63.0 | ||||||||||||||
Results adjusted for infant's sex, mother's age, parents' race/ethnicity, and random effects associated with counties, census tracts, and block groups.
The model B columns in table 2 present the mutually adjusted effect estimates for each ABSM and parental education on birth weight. With adjustment for parental education, infants in census tract categories associated with the highest population fraction of less than a high school education and poverty continued to experience statistically significant birth weight deficits (27 and 38 g, respectively). The socioeconomic differentials in birth weight by census tract fraction population with a college education or greater were, however, substantially smaller. The birth weight differentials by block group ABSMs were also weak, compared with those observed at the census tract level. Parental education remained a strong predictor of birth weight in models that mutually adjust for census tract and block group ABSM, with infants born to mothers and fathers with less than a high school education weighing 74 and 55 g less compared with those whose parents have a college education or greater.
Generally, in models that mutually adjusted for ABSMs and parental education (compared with models that did not mutually adjust for each other, i.e., model A), the attenuation in effect estimates was substantially greater for ABSMs than it was for parental education, with larger attenuation observed for block group compared with census tract ABSMs. Importantly, even after adjustment for parental education, the ABSM effects remained significant, and the birth weight deficit among infants born to mothers in the poorest census tracts (compared with the least poorest) was ∼37 g, a quantity slightly over half the deficit for infants born to mothers with the least compared with most education (∼70 g).
Area- and individual-level socioeconomic patterning in birth weight remained in models with low birth weight as the outcome (table 3). Because the socioeconomic birth weight disparities detected by the population fraction with a college education were not marked, the results in table 3 are presented for the ABSMs percent poverty and percent population with less than a high school education. In models that did not mutually adjust for area- and individual-level socioeconomic measures, the odds associated with low birth weight for mothers and fathers with less than a high school education were 1.37 (95 percent confidence interval (CI): 1.26, 1.49) and 1.41 (95 percent CI: 1.29, 1.54), respectively, compared with those with a college education or greater. Compared with that in census tracts having the least population fraction with less than a high school education, the odds ratio for low birth weight for census tracts with the greatest population fraction with less than a high school education was 1.43 (95 percent CI: 1.34, 1.54). Similarly, compared with that in census tracts having the least poverty, the low birth weight prevalence was substantially greater in census tracts having the most poverty (odds ratio = 1.41, 95 percent CI: 1.31, 1.51). In models that mutually adjust for parental education and block group ABSM, the low birth weight differential-associated census tract ABSM was attenuated but remained substantial. The odds ratios for low birth weight were 1.14 (95 percent CI: 1.01, 1.27) for the ABSM associated with percent less than a high school education and 1.17 (95 percent CI: 1.06, 1.29) for the ABSM associated with percent poor.
Odds ratios and 95% confidence intervals associated with parental education and two area-based socioeconomic measures for being low birth weight (<2,500 g), Massachusetts, 1989–1991*
Predictor variables | Model A | Model B | ||||||||||||||||
|---|---|---|---|---|---|---|---|---|---|---|---|---|---|---|---|---|---|---|
| Area-based socioeconomic measure | Parental education | Adult population fraction aged ≥25 years with less than a high school education | Population fraction living below the federal poverty line | |||||||||||||||
| Census tract | Block group | |||||||||||||||||
| Odds ratio | 95% confidence interval | Odds ratio | 95% confidence interval | Odds ratio | 95% confidence interval | Odds ratio | 95% confidence interval | Odds ratio | 95% confidence interval | |||||||||
| Census tract adult population fraction aged ≥25 years with less than a high school education (%) | ||||||||||||||||||
| 0.0–14.9 | Referent | Referent | Referent | Referent | ||||||||||||||
| 15.0–24.9 | 1.14 | 1.08, 1.21 | 1.04 | 0.98, 1.12 | ||||||||||||||
| 25.0–39.9 | 1.28 | 1.21, 1.36 | 1.08 | 0.99, 1.18 | ||||||||||||||
| 40.0–100 | 1.43 | 1.34, 1.54 | 1.14 | 1.01, 1.27 | ||||||||||||||
| Block group adult population fraction aged ≥25 years with less than a high school education (%) | ||||||||||||||||||
| 0.0–14.9 | Referent | Referent | Referent | Referent | ||||||||||||||
| 15.0–24.9 | 1.11 | 1.05, 1.18 | 1.02 | 0.95, 1.09 | ||||||||||||||
| 25.0–39.9 | 1.26 | 1.19, 1.33 | 1.07 | 0.99, 1.16 | ||||||||||||||
| 40.0–100 | 1.39 | 1.30, 1.49 | 1.11 | 0.99, 1.23 | ||||||||||||||
| Census tract population fraction below poverty line (%) | ||||||||||||||||||
| 0.0–4.9 | Referent | Referent | Referent | Referent | ||||||||||||||
| 5.0–9.9 | 1.14 | 1.08, 1.20 | 1.07 | 1.01, 1.14 | ||||||||||||||
| 10.0–19.9 | 1.25 | 1.17, 1.33 | 1.10 | 1.01, 1.19 | ||||||||||||||
| 20.0–100 | 1.41 | 1.31, 1.51 | 1.17 | 1.06, 1.29 | ||||||||||||||
| Block group population fraction below poverty line (%) | ||||||||||||||||||
| 0.0–4.9 | Referent | Referent | Referent | Referent | ||||||||||||||
| 5.0–9.9 | 1.08 | 1.02, 1.14 | 1.01 | 0.95, 1.07 | ||||||||||||||
| 10.0–19.9 | 1.19 | 1.12, 1.26 | 1.04 | 0.97, 1.12 | ||||||||||||||
| 20.0–100 | 1.34 | 1.26, 1.43 | 1.10 | 1.00, 1.21 | ||||||||||||||
| Mother's education | ||||||||||||||||||
| Less than high school | 1.37 | 1.26, 1.49 | 1.32 | 1.21, 1.43 | 1.33 | 1.22, 1.44 | ||||||||||||
| High school | 1.21 | 1.13, 1.30 | 1.19 | 1.11, 1.27 | 1.20 | 1.12, 1.28 | ||||||||||||
| Some college | 1.02 | 0.96, 1.10 | 1.01 | 0.94, 1.09 | 1.02 | 0.95, 1.09 | ||||||||||||
| College education or greater | Referent | Referent | Referent | Referent | Referent | Referent | ||||||||||||
| Missing | 1.08 | 0.82, 1.42 | 1.06 | 0.81, 1.40 | 1.07 | 0.81, 1.42 | ||||||||||||
| Father's education | ||||||||||||||||||
| Less than high school | 1.41 | 1.29, 1.54 | 1.35 | 1.23, 1.47 | 1.36 | 1.24, 1.49 | ||||||||||||
| High school | 1.29 | 1.20, 1.38 | 1.26 | 1.17, 1.35 | 1.26 | 1.18, 1.36 | ||||||||||||
| Some college | 1.16 | 1.08, 1.25 | 1.14 | 1.06, 1.23 | 1.15 | 1.07, 1.24 | ||||||||||||
| College education or greater | Referent | Referent | Referent | Referent | Referent | Referent | ||||||||||||
| Missing | 1.48 | 1.22, 1.81 | 1.44 | 1.18, 1.75 | 1.44 | 1.18, 1.75 | ||||||||||||
Results adjusted for infant's sex, mother's age, and parents' race/ethnicity in the fixed part and random effects associated with counties, census tracts, and block groups.
We additionally calibrated models for the continuous measure of birth weight stratified by three age categories: teenaged mothers aged 15–19 years, young adults aged 20–24 years, and adults aged 25 or more years. We found that, in the age stratum 15–19 years, the ABSM-based socioeconomic disparities in birth weight were imprecisely estimated, while infants born to mothers or fathers with less than a high school education weighed 24 or 36 g less than did those born to parents with a high school education, respectively. Among births to mothers aged 20–24 years, the ABSM associated with census tract poverty detected a birth weight differential (a deficit of 42 g for infants in the poorest census tracts) similar to those observed using mother's and father's educational levels (birth weight deficits of 57 g and 45 g for mother's and father's having less than a high school education, respectively). In the age stratum of 25 or more years, the results are approximately similar to those reported for age-adjusted models, except that the socioeconomic inequalities for both parental education and ABSMs were systematically smaller.
DISCUSSION
Our analysis has three key findings. First, the census tract ABSMs related to the categories of the population fraction below poverty and the population fraction with less than a high school education are equally predictive of birth weight, after adjustment for demographic factors, as are the mother's and father's educational levels in models. The birth weight deficit between the census tracts with the most and least poverty, without adjustment for parental education, is ∼70 g, which is about the deficit (78 g) for mothers with less than a high school education (compared with mothers with a college education), without adjustment for ABSM. In the absence of individual-level data on parental education, the census tract ABSM also detected a similar differential in low birth weight. The prevalence of low birth weight was 41 percent higher in census tracts with the most poverty compared with census tracts having the least poverty, while mothers with less than a high school education were 37 percent more likely to have low birth weight babies compared with those with a college education. Second, in models that mutually adjust for ABSMs and parental education, the attenuation in effect sizes was greater for the census tract ABSM compared with parental education. Importantly, however, the census tract ABSM still detected an effect estimate equivalent to almost 50 percent of that detected by the mother's education. Third, in the age group 20–24 years, census tract poverty was able to detect more than three fourths of the effects detected by the mother's education.
Do the findings suggest that ABSMs meaningfully estimate the socioeconomic disparities in birth weight? We believe that they do. In the absence of individual-based socioeconomic information, census tract ABSM-based socioeconomic inequalities in birth weight are likely to approximate or provide conservative estimates of the socioeconomic inequalities detected using parental measures of educational status. The discordance between census tract ABSM and mother's education is even smaller when quantifying socioeconomic inequalities in birth weight among young mothers aged less than 25 years. Given that in younger age groups educational attainment is typically not completed (and other socioeconomic position variables such as occupation and income are even less applicable), individual-based measures are likely to be less informative of the mother's socioeconomic position in this age group.
The availability of educational status and residential address of the parents in birth weight data provided a unique opportunity to evaluate the relative importance of the individual-level and area-level measures within a multilevel framework (33, 38, 39). The evidence presented in this study supporting an independent association between census tract ABSM and birth weight, over and above the effect of individual risk factors, makes our finding additionally relevant from a substantive and etiologic perspective (37, 40–50). Differences in birth weight or variations in low birth weight prevalence between census tracts (conceptualized as one possible realization of people's residential setting) often tend to be attributed to the differences among the characteristics of the infants and their parents who live in these census tracts, thereby invoking “compositional” explanations for area variations in (low) birth weight. It may be noted, however, that compositional explanations do not necessarily suggest individual explanations as, for the latter to be invoked, individual-level socioeconomic exposures would need to be truly “randomly” distributed across areas, which is rarely the case (51). Census tract differences in (low) birth weight, meanwhile, may also arise for reasons less directly associated with the individual characteristics of the infants and their parents who live in them. In the context of birth weight, a differential distribution of pregnancy and maternal health-related services, as well as socioenvironmental stressors, could be a potential contributor to producing area variations in birth weight. The independent effect of ABSMs on birth weight, even after adjustment for individual-level education, suggests that ABSMs and the individual-level socioeconomic measure are not interchangeable. Consequently, interpreting ABSMs as a shared collective or contextual dimension that all individuals within a context share is more appropriate and important in its own right (32, 52). This interpretation holds regardless of whether the motivation for their use is restricted to situations where no individual-level socioeconomic measures are available.
Additional considerations that have implications for interpreting our study's primary and secondary findings are now discussed. The first relates to the choice of ABSM, given that the two measures of socioeconomic deprivation (population fraction living below poverty and population fraction with less than a high school education) more closely approximated the effect estimate obtained with mother's education than did the ABSM associated with the population fraction with a college education or greater. Measures such as the population fraction with a college education or greater tend to capture the presence of protective mechanisms, based on access to social and institutional resources, that concentrated “affluence” may generate (53–55). As such, these measures are distinct from measures of disadvantage or deprivation (e.g., population fraction living below poverty) that capture mainly the absence of critical resources necessary for individual well-being. Our results, however, suggest that areas characterized in terms of deprivation seem to yield more consistent patterns with individual-level socioeconomic position, as opposed to areas characterized in terms of affluence.
The second issue concerns the geographic level at which the ABSMs are measured. Census tract ABSMs were considerably stronger predictors of birth weight than were block group ABSMs. This finding is in accord with previous studies that have considered multiple levels of geographies but in a separate rather than simultaneous manner (8, 27–29, 56). Moreover, the size of the census tract-based socioeconomic differential was similar to that of individual socioeconomic position from models that do not mutually adjust for each other. To our knowledge, this is the first time that ABSMs measured at multiple levels of geographies have been considered in a simultaneous multilevel manner, thus allowing an interpretation of the relative importance of different levels. Although novel approaches to delineating neighborhoods are likely to yield important insights regarding the etiologic importance of people's residential context (57), the census tract as a level and census-based ABSMs have been shown to be reasonable approximations for delineating neighborhoods (58). The relevance of census tracts (including comparison with block groups) gains further prominence given the routine use of census tracts by federal, state, and local governments, including public health departments, to delineate and characterize jurisdictions, determine eligibility for diverse programs, and allocate resources (59–61). The overall importance of the census tract, compared with the block group, level for birth weight is likely to be due to the importance of pregnancy and maternal health-related services and their policy relevance for identifying low income areas or medically underserved areas, both of which tend to operate in relatively larger than smaller spaces.
We acknowledge the implications of omitted variables (both observable and unobservable) for etiologic research on socioeconomic determinants of health. Including more individual- and area-level socioeconomic measures, in general, is obviously desirable to tease out the relative impacts of individual and neighborhood exposures on heath (22, 33). For the purpose of monitoring population distributions of health, however, it is inappropriate to adjust for variables that might be in the causal pathway (e.g., for birth weight, smoking); the latter is germane to etiologic research, but not for quantifying the actual magnitude of social disparities in health. Indeed, for the purposes of our study, the critical test is between two models that separately ascertain birth weight disparities by individual- and area-based socioeconomic measures. Accordingly, our results suggest that, from a standpoint of quantifying socioeconomic inequalities in health for public health monitoring, area-based inequality assessments are likely to generate effect estimates analogous to those yielded by individual-level measures or else be conservative. Indeed, area-based assessment may well be the only means to understand the extent and nature of birth weight inequities at younger ages, as the available individual-level socioeconomic data are unlikely to be meaningful (e.g., educational level for teens and young adults aged less than 25 years). At the same time, we do not claim that the reported area-based socioeconomic disparities in birth weight are entirely due to those specific socioeconomic dimensions. Finally, because our analyses were based on data observed in 1990, the extent to which our results apply to more contemporaneous circumstances is an important empirical question. If the trends in birth weight and area-based socioeconomic measures have changed in the same direction and by approximately similar magnitude, the time period of the study itself is likely to be less important.
From both policy and etiologic perspectives, it is necessary to have an estimate of the magnitude and patterning of the health problem, including whether the problem is getting better or worse over time, which then requires inquiries for systematic explanations. The primary objective of this study was to demonstrate the relevance of ABSMs in obtaining an estimate of the differential burden of (ill) health in populations, as reflected through inequalities in birth weight. Area- and individual-based socioeconomic measures, meanwhile, do not have the same meaning and, therefore, are not interchangeable. However, contrary to an earlier assessment questioning the validity of ABSMs (9, 10), our study demonstrates, at least in the case of disparities in (low) birth weight, that aptly chosen ABSMs provide estimates of health inequalities that are comparable with those based on individual-based socioeconomic measures. The risk, if any, in the absence of individual-based socioeconomic information is a conservative estimate of socioeconomic inequalities in health.
Editor's note:An invited commentary on this article appears on page , and the authors' response appears on page .
S. V. Subramanian is supported by National Heart, Lung, and Blood Institute Career Development Award 1 K25 HL081275 from the National Institutes of Health. The data used in this study were collected as part of a project funded by the National Institute of Child Health and Human Development and Office of Behavioral and Social Science Research (1 R01 HD36865-01; Principal Investigator: Nancy Krieger), also of the National Institutes of Health.
The authors thank Dr. Daniel Friedman (former Assistant Commissioner, Bureau of Health Statistics, Research, and Evaluation, Massachusetts Department of Public Health) for facilitating the data collection. They would also like to thank Alice Mroszczyk, Massachusetts Department of Public Health, and Elaine Trudeau and Charlene Zion, Registry of Vital Records and Statistics, for helping them access the birth weight data.
Conflict of interest: none declared.
References
Krieger N. Overcoming the absence of socioeconomic data in medical records: validation and application of census-based methodology.
Krieger N, Chen JT, Ebel G. Can we monitor socioeconomic inequalities in health? A survey of U.S. health departments' data collection and reporting practices.
Liberatos P, Link BG, Kelsey JL. The measurement of social class in epidemiology.
Krieger N, Williams D, Moss N. Measuring social class in US public health research: concepts, methodologies, and guidelines.
Makuc DM, Feldman JJ, Mussolino ME. Validity of education and age as reported on death certificates. In: Proceedings of the social statistics section. Alexandria, VA: American Statistical Association,
Sorlie P, Johnson NJ. Validity of education information on the death certificate.
Gordon D. Area-based deprivation measures—a UK perspective. In: Kawachi I, Berkman LF, eds. Neighborhoods and health. New York, NY: Oxford University Press,
Krieger N, Chen JT, Waterman PD, et al. Painting a truer picture of US socioeconomic and racial/ethnic health inequalities: the Public Health Disparities Geocoding Project.
Geronimus AT, Bound J. Use of census-based aggregate variables to proxy for socioeconomic group: evidence from national samples.
Geronimus AT, Bound J, Neidert LJ. On the validity of using census geocode characteristics to proxy individual socioeconomic characteristics.
Kawachi I, Berkman LF, eds. Neighborhoods and health. New York, NY: Oxford University Press,
Sampson RJ. Neighborhood-level context and health: lessons from sociology. In: Kawachi I, Berkman LF, eds. Neighborhoods and health. New York, NY: Oxford University Press,
Schoendorf KC, Hogue CJR, Kleinman JC, et al. Mortality among infants of black as compared wth white college-educated parents.
Poulter NR, Chang CL, MacGregor AJ, et al. Association between birth weight and adult blood pressure in twins: historical cohort study.
Nelson KB, Grether JK. Cerebral palsy in low-birth weight infants: etiology and strategies for prevention.
Brooks AM, Byrd RS, Weitzman M, et al. Impact of low birth weight on early childhood asthma in the United States.
Kaelber CT, Pugh TF. Influence of intrauterine relations on the intelligence of twins.
McCormick MC, Brooks-Gunn J, Workman-Daniels K, et al. The health and developmental status of very low-birth weight children at school age.
Richards M, Hardy R, Kuh D, et al. Birth weight and cognitive function in the British 1946 birth cohort: longitudinal population based study.
Currie J, Gruber J. Saving babies: the efficacy and cost of recent changes in the Medicaid eligibility of pregnant women.
O'Campo P. Invited commentary: advancing theory and methods for multilevel models of residential neighborhoods and health.
Krieger N, Waterman P, Lemieux K, et al. On the wrong side of the tracts? Evaluating the accuracy of geocoding in public health research.
US Census Bureau. Appendix A: Census 2000 geographic terms and concepts. Washington, DC: US Department of Commerce,
Nicolaidis C, Ko CW, Saha S, et al. Racial discrepancies in the association between paternal vs. maternal educational level and risk of low birth weight in Washington State.
Tan H, Wen SW, Walker M, et al. Missing paternal demographics: a novel indicator for identifying high risk population of adverse preganancy outcomes.
Krieger N, Chen J, Waterman PD, et al. Choosing area-based socioeconomic measures to monitor social inequalities in low birth weight and childhood lead poisoning—the Public Health Disparities Geocoding Project.
Krieger N, Chen J, Waterman PD, et al. Geocoding and monitoring US socioeconomic inequalities in mortality and cancer incidence: does choice of area-based measure and geographic level matter?: The Public Health Disparities Geocoding Project.
Krieger N, Chen JT, Waterman PD, et al. Race/ethnicity, gender, and monitoring socioeconomic gradients in health: a comparison of area-based socioeconomic measures—The Public Health Disparities Geocoding Project.
Raudenbush S, Bryk A. Hierarchical linear models: applications and data analysis methods. Thousand Oaks, CA: Sage Publications,
Subramanian SV. Multilevel methods, theory and analysis. In: Anderson N, ed. Encyclopedia on health and behavior. Thousand Oaks, CA: Sage Publications,
Subramanian SV. The relevance of multilevel statistical models for identifying causal neighborhood effects.
Subramanian SV, Jones K, Duncan C. Multilevel methods for public health research. In: Kawachi I, Berkman LF, eds. Neighborhoods and health. New York, NY: Oxford University Press,
Rasbash J, Steele F, Browne W, et al. A user's guide to MLwiN version 2.0. London, United Kingdom: Centre for Multilevel Modelling, Institute of Education,
Rich-Edwards JW, Buka SL, Brennan RT, et al. Diverging associations of maternal age with low birth weight for black and white mothers.
Rauh VA, Andrews HF, Garfinkel RS. The contribution of maternal age to racial disparities in birth weight: a multilevel perspective.
Blakely T, Subramanian SV. Multilevel studies. In: Oakes M, Kaufman J, eds. Methods for social epidemiology. San Francisco, CA: Jossey Bass,
Greenland S. Ecologic versus individual-level sources of bias in ecologic estimates of contextual health effects.
Kaufman JS, Dole N, Savitz DA, et al. Modeling community-level effects on preterm birth.
English PB, Kharrazi M, Davies S, et al. Changes in the spatial pattern of low birth weight in a southern California county: the role of individual and neighborhood level factors.
Buka SL, Brennan RT, Rich-Edwards JW, et al. Neighborhood support and the birth weight of urban infants.
Pickett KE, Ahern JE, Selvin S, et al. Neighborhood socioeconomic status, maternal race and preterm delivery: a case-control study.
O'Campo P, Xue X, Wang M, et al. Neighborhood risk factors for low birth weight in Baltimore: a multilivel analysis.
Luo Z, Kierans W, Wilkins R, et al. Disparities in birth outcomes by neighborhood income: temporal trends in rural and urban areas, British Columbia.
Pearl M, Braveman P, Abrams B. The relationship of neighborhood socioeconomic characteristics to birth weight among 5 ethnic groups in California.
Roberts EM. Neighborhood social environments and the distribution of low birth weight in Chicago.
Fang J, Madhavan S, Alderman MH. Low birth weight: race and maternal nativity—impact of community income.
Kirby D, Coyle K, Gould JB. Manifestations of poverty and birthrates among young teenagers in California zip code areas.
Ponce NA, Hoggatt KJ, Wilhelm M, et al. Preterm birth: the interaction of traffic-related air pollution with economic hardship in Los Angeles neighborhoods.
Subramanian SV, Kubzansky L, Berkman L, et al. Neighborhood effects on the self-rated health of elders: uncovering the relative importance of structural and service-related neighborhood environments.
Macintyre S, Ellaway A. Ecological approaches: rediscovering the role of physical and social environment. In: Berkman LF, Kawachi I, eds. Social epidemiology. New York, NY: Oxford University Press,
Massey D. The age of extremes: concentrated affluence and poverty in the twenty-first century.
Brooks-Gunn J, Duncan G, Kato P, et al. Do neighborhoods influence child and adolescent behavior?
Morenoff JD, Sampson RJ, Raudenbush SW. Neighborhood inequality, collective efficacy, and the spatial dynamics of homicide.
Krieger N, Waterman PD, Chen J, et al. Monitoring socioeconomic inequalities in sexually transmitted infections, tuberculosis, and violence: geocoding and choice of area-based socioeconomic measures—the Public Health Disparities Geocoding Project (US).
Grannis R. The importance of trivial streets: residential streets and residential segregation.
Sampson RJ, Morenoff JD. Assessing neighborhood effects: social processes and new directions in research.
Boston Public Health Commission. Race and the elimination of health disparities in the city of Boston: promoting the health of the underserved. Boston, MA: Boston Public Health Commission,
Health Resources and Services Administration. Health professional shortage areas. Rockville, MD: US Department of Health and Human Services,

