


Abstract
The authors evaluated whether statistically significant violations of Hardy-Weinberg equilibrium (HWE) or the magnitude of deviations from HWE may contribute to the problem of replicating postulated gene-disease associations across different studies. Forty-two gene-disease associations assessed in meta-analyses of 591 studies were examined. Studies with disease-free controls in which HWE was violated gave significantly different results from HWE-conforming studies in five instances. Exclusion of the former studies resulted in loss of statistical significance of the overall meta-analysis in three instances and more than a 10% change in the summary odds ratio in six. Exclusion of HWE-violating studies changed the formal significance of the estimated between-study heterogeneity in three instances. After adjustment for the magnitude of the deviation from HWE for the controls, formal significance was lost in another three instances. Studies adjusted for the magnitude of deviation from HWE tended to become more heterogeneous among themselves, and, for seven gene-disease associations, between-study heterogeneity became significant, while it was not so in the unadjusted analyses. Gene-disease association studies and meta-analyses thereof should routinely scrutinize the potential impact of HWE violations as well as nonsignificant deviations from the exact frequencies expected under HWE. Postulated genetic associations with modest-sized odds ratios and borderline statistical significance may not be robust in such sensitivity analyses.
Genetic associations for complex diseases are important to establish because they are expected to cumulatively account for a substantial proportion of susceptibility to many diseases of considerable public health impact (1, 2). However, concerns are increasing about the lack of replication of proposed gene-disease associations (3–5). Various reasons have been proposed for this phenomenon, including, among others, exaggerated early results (3), publication bias and time-lag bias against “negative” studies (3, 6), differences between small and larger studies (7), and population stratification and “racial/ethnic” heterogeneity (8). Empirical evidence has been accumulating on the relative role of some of these potential problems (3, 4, 7–9).
An additional major theoretical concern is that associations may be spurious if the distribution of genotypes in the healthy control groups in genetic case-control studies deviates from Hardy-Weinberg equilibrium (HWE). HWE depends on a series of assumptions about the tested population, including, for example, no new mutation, no selection, and random mating (10). Departures from HWE, if not due to chance or violation of these assumptions, therefore may point to genotyping error or other biases (11, 12). Empirical evidence suggests that in about 10 percent of case-control studies in the field, the distributions of genotypes in the healthy control group violate HWE; that is, they show formally statistically significant deviations from the HWE-expected frequencies (12–14). Nevertheless, investigators uncommonly report appropriately on testing and departures from HWE, even in genetics journals (14). Moreover, given the fact that most studies in the field have relatively small sample sizes, the power of available statistical tests to detect HWE violation is limited (14).
Despite these concerns, there is no known large-scale empirical evidence on whether HWE deviations may cause serious bias when estimating the magnitude of genetic associations in gene-disease association studies. Here, we examine whether studies that violate HWE give systematically different genetic effect sizes compared with studies in which HWE is not formally violated, and whether between-study heterogeneity may be explained in part by HWE violations. We also evaluate whether deviations from the exact frequencies expected under HWE, even if not formally statistically significant, may still affect the postulated genetic associations.
MATERIALS AND METHODS
Database
We used a database of 134 meta-analyses of binary disease outcomes with genetic markers not belonging to the human leukocyte antigen (HLA) system (last update, May 2004); details on the selection criteria, the search algorithms, and data extraction have been described previously (3, 7, 8). In brief, these meta-analyses 1) contained at least three studies published over two different calendar years and 2) pertained to binary outcomes. A comprehensive algorithm was used to select the main genetic contrast (3). Study-level numerical data were extracted either from the meta-analysis publication or after communication with the authors of each meta-analysis. Separate case-control comparisons of different “racial/ethnic”–descent populations described in the same report were treated as separate studies (8).
All these meta-analyses were screened for eligibility for the current project. Only those of biallelic markers were retained (15). Meta-analyses in which controls were not disease free and those in which the genotype frequencies in the controls were not available per study were also excluded because HWE testing was not possible. Relying on investigators' claims regarding HWE testing is known to be unreliable (14).
Information on genotype distribution in the controls included in each constituent study was recorded from each eligible meta-analysis. Data were extracted by two investigators. Discrepancies were discussed and were resolved in a consensus meeting.
HWE testing
In each constituent study, we tested for HWE by using an asymptotic χ2 test or an exact test (16) among the disease-free controls. The exact test was preferred when the expected count under the Hardy-Weinberg law was less than five for any of the three genotypes. For consistency, in this paper we use the terms “violations” to describe departures from HWE that reach formal statistical significance and “deviations” to describe any departure from the exact frequencies expected under HWE, regardless of whether the departure is formally statistically significant.
Meta-analyses: summary effects and heterogeneity testing
The odds ratio was used as the metric of choice. For each meta-analysis, we calculated the summary odds ratio by including all available studies, and then we calculated it separately for studies with statistically significant deviation from HWE and for HWE-conforming studies. Summary estimates were obtained with random-effects (DerSimonian and Laird) models (17), which allow for between-study variability and incorporate it in the calculations. Fixed-effects syntheses were not used because variability in the study results on the same association is very common (3, 7). We tested for between-study heterogeneity with Cochran's χ2-based Q statistic (considered significant for p < 0.10) (18), and we estimated its extent with the I2 statistic (19). I2 represents the percentage of the observed between-study variability due to heterogeneity rather than to chance. It ranges between 0 percent and 100 percent; values above 75 percent imply very large heterogeneity (19).
Impact of HWE-violating studies on summary effects and heterogeneity estimates
We evaluated whether the statistical significance status (at the 0.05 significance level) of each meta-analysis changed after HWE-violating studies were excluded. We also used a standardized z score to assess whether findings from HWE-violating studies differed from those of the HWE-conforming studies beyond chance (20). The z score is calculated by dividing the difference of the natural logarithms of the odds ratios in HWE-violating and in HWE-conforming studies by the standard deviation of this difference.
We also examined whether HWE-violating studies were responsible for some of the observed heterogeneity in each meta-analysis. The extent of between-study heterogeneity, as conveyed by the I2 and Q statistics, was compared before and after excluding HWE-violating studies.
Impact of correction for HWE deviations on summary effects and heterogeneity estimates
Finally, we assessed whether the magnitude, statistical significance, and between-study heterogeneity of the genetic association in each meta-analysis depended on the magnitude of deviations from the Hardy-Weinberg law, regardless of whether these deviations corresponded to formally statistically significant violations. The odds ratio and the variances of the individual studies were corrected to account for departures from HWE, as previously suggested (21, 22), and then each meta-analysis was performed again.
For allele-based contrasts, the variance of each study's effect size was adjusted by a factor of 1 + F (14, 21), where F is the inbreeding coefficient for the combined cases and controls. The inbreeding coefficient is calculated by
For genotype-based contrasts, every study's odds ratio was corrected by using the HWE-predicted genotype counts in the control instead of the observed counts (22). The variances of the natural logarithms of the adjusted odds ratios were corrected as previously suggested (refer to the Appendix) (22). Corrected variances are usually smaller than those based on the observed genotype frequencies (22).
Software
Analyses were conducted with Intercooled Stata 8.2 software (Stata Corporation, College Station, Texas) by using the genhwi and metan modules, and R 1.9.1 (R Foundation for Statistical Computing, Vienna, Austria) by using the gap software package. In this paper, all p values are two tailed.
RESULTS
Database
Forty-two meta-analyses with 591 studies met the inclusion criteria (table 1) (23–52), and 23 of these meta-analyses showed statistically significant gene-disease associations. Ten studies were excluded from the analyses (five part of a meta-analysis of 34 studies, and five part of a meta-analysis of 23 studies) because HWE could not be assessed (separate genotype counts were not available). Overall, control genotype frequencies in 60 studies (table 1) (60/591 = 10 percent, or even 60/581 = 10 percent, since HWE could not be assessed for 10 studies) from 27 meta-analyses violated the Hardy-Weinberg law. Fifteen meta-analyses did not include any such studies.
Characteristics of the meta-analyses included in the present investigation*
ID | Gene (polymorphism): contrast | Disease | HWE conforming | HWE violating | Reference no. | ||||||||
|---|---|---|---|---|---|---|---|---|---|---|---|---|---|
| No. of studies | No. of cases | No. of controls | No. of studies | No. of cases | No. of controls | ||||||||
| 1 | DRD2 (TaqIA): allele A1 vs. A2 | Alcoholism | 14 | 1,950 | 1,542 | 1 | 80 | 254 | 23 | ||||
| 2 | ACE (insertion/deletion): DD vs. DI + II | Ischemic stroke | 6 | 1,334 | 826 | 0 | 0 | 0 | 24 | ||||
| 3 | MTHFR (C677T): TT vs. CT + CC | Neural tube defects (patients) | 12 | 1,048 | 2,046 | 1 | 203 | 583 | 25 | ||||
| 4 | MTHRF (C677T): TT vs. CT + CC | Neural tube defects (mother) | 8 | 603 | 1,352 | 0 | 0 | 0 | 25 | ||||
| 5 | MTHFR (C677T): TT vs. CT + CC | Neural tube defects (father) | 5 | 200 | 750 | 0 | 0 | 0 | 25 | ||||
| 6 | ITGB3 (L33P): A1A2 + A2A2 vs. A1A1 | Coronary artery disease | 24† | 6,371 | 6,119 | 5† | 1,109 | 1,445 | 28 | ||||
| 7 | ITGB3 (L33P): A2A2 + A1A2 vs. A1A1 | Fractures | 11 | 799 | 2,420 | 2 | 113 | 248 | 29 | ||||
| 8 | HTR2A (G1438A): allele A vs. G | Bulimia | 3 | 434 | 6,92 | 0 | 0 | 0 | 26 | ||||
| 9 | HTR2A (G1438A): allele A vs. G | Anorexia | 7 | 1,330 | 2,368 | 0 | 0 | 0 | 26 | ||||
| 10 | FCGR2A (R131H): RR vs. RH + HH | SLE | 21 | 2,637 | 2,580 | 0 | 0 | 0 | 34 | ||||
| 11 | COMT (V158M): MM vs. MV + VV | Parkinson's disease | 3 | 456 | 508 | 0 | 0 | 0 | 27 | ||||
| 12 | ACE (insertion/deletion): DD vs. DI + II | IgA nephropathy | 7 | 917 | 857 | 0 | 0 | 0 | 30 | ||||
| 13 | FCGR2A (R131H): HH vs. RR + RH | HIT | 6 | 626 | 1,313 | 0 | 0 | 0 | 31 | ||||
| 14 | VDR (TaqI): tt vs. Tt + TT | Prostate cancer | 15 | 1,763 | 2,627 | 2 | 107 | 216 | 47 | ||||
| 15 | VDR (BsmI): allele B vs. b | Prostate cancer | 3 | 1,350 | 2,066 | 1 | 322 | 594 | 47 | ||||
| 16 | VDR (Fok1): allele f vs. F | Prostate cancer | 3 | 1,028 | 1,090 | 0 | 0 | 0 | 47 | ||||
| 17 | UCHL1 (S18Y): YY + YS vs. SS | Parkinson's disease | 10 | 1,896 | 2,069 | 1 | 74 | 155 | 50 | ||||
| 18 | CTSD (C224T): allele T vs. C | Alzheimer's disease | 14 | 5,176 | 4,946 | 2 | 1,172 | 1,650 | 48 | ||||
| 19 | FCGR2A (R131H): RR vs. RH + HH | Antiphospholipid syndrome | 10 | 479 | 1,655 | 0 | 0 | 0 | 35 | ||||
| 20 | FCGR2A (F158V): allele F vs. V | SLE | 11 | 1,642 | 2,390 | 2 | 198 | 520 | 36 | ||||
| 21 | CYP17 (MspI): A1A2 + A2A2 vs. A1A1 | Prostate cancer | 11 | 2,303 | 2,555 | 1 | 101 | 200 | 45 | ||||
| 22 | SRD5A2 (V98L): LL + VL vs. VV | Prostate cancer | 11 | 2,396 | 3,065 | 1 | 162 | 284 | 46 | ||||
| 23 | SRD5A2 (A49T): TT + AT vs. AA | Prostate cancer | 6 | 1,206 | 1,676 | 2 | 388 | 461 | 46 | ||||
| 24 | F5 (Leiden mutation): allele V vs. v | Preeclampsia | 19 | 5,502 | 5,202 | 1 | 122 | 122 | 41 | ||||
| 25 | MTHFR (C677T): TT vs. CT + CC | Preeclampsia | 16‡ | 2,689 | 2,303 | 2‡ | 188 | 376 | 42 | ||||
| 26 | AGT (M235T): TT vs. MM | Essential hypertension | 40 | 7,146 | 7,002 | 0 | 0 | 0 | 49 | ||||
| 27 | AGT (M235T): TT vs. TM + MM | Ischemic heart disease | 17 | 6,569 | 12,222 | 4 | 575 | 694 | 49 | ||||
| 28 | HTR2A (C102T): allele T vs. C | Suicide | 8 | 1,084 | 1,754 | 1 | 108 | 252 | 38 | ||||
| 29 | DRD3 (S9G): S/S + G/G vs. S/G | Schizophrenia | 40 | 4,259 | 4,502 | 0 | 0 | 0 | 39 | ||||
| 30 | PON1 (Q192R): RR vs. QQ | Myocardial infarction | 17 | 2,647 | 3,925 | 2 | 609 | 728 | 52 | ||||
| 31 | PON1 (Q192R): RR vs. QR + QQ | Coronary stenosis | 25 | 4,263 | 7,465 | 1 | 120 | 80 | 52 | ||||
| 32 | PON1 (L55M): allele M vs. L | Myocardial infarction | 9 | 6,378 | 7,300 | 0 | 0 | 0 | 52 | ||||
| 33 | PON1 (L55M): LL vs. LM + MM | Coronary stenosis | 11 | 2,102 | 3,753 | 3 | 698 | 713 | 52 | ||||
| 34 | PON1 T(−107)C: TT vs. CT + CC | Coronary heart disease | 2 | 784 | 595 | 2 | 612 | 737 | 52 | ||||
| 35 | PON1 (S311C): allele S vs. C | Coronary heart disease | 6 | 2,268 | 3,570 | 1 | 728 | 630 | 52 | ||||
| 36 | ACE (insertion/deletion): II + DI vs. DD | Alzheimer's disease | 16 | 2,316 | 2,526 | 5 | 945 | 998 | 40 | ||||
| 37 | MTHFR (C677T): TT vs. CT + CC | Venous thromboembolism | 27 | 4,211 | 5,717 | 3 | 463 | 1,815 | 37 | ||||
| 38 | TGFBR1 (del(GGC)3): 66 + 69 vs. 99 | Cancer | 13 | 4,392 | 3,448 | 0 | 0 | 0 | 51 | ||||
| 39 | TP53 (P72R): P/P vs. R/P + R/R | Lung cancer | 13 | 2,830 | 3,275 | 4 | 656 | 753 | 43 | ||||
| 40 | MPO (G-463A): AA vs. GA + GG | Lung cancer | 7 | 2,228 | 2,567 | 3 | 458 | 758 | 33 | ||||
| 41 | KCNJ11/KIR6.2-BIR (E23K): KK vs. EK + EE | NIDDM | 3 | 1,094 | 1,058 | 2 | 378 | 293 | 44 | ||||
| 42 | ACE (insertion/deletion): DD vs. DI + II | Coronary restenosis | 11 | 1,390 | 2,545 | 5 | 293 | 404 | 32 | ||||
ACE, angiotensin converting enzyme; AGT, angiotensinogen; COMT, catechol-O-methyltransferase; CTSD, cathepsin D; CYP, cytochrome P-450; DRD2/DRD3, dopamine receptor D2/D3; F5, factor V; FCGR2A, low-affinity receptor of the Fc gamma domain of immunoglobulin G; HIT, heparin-induced thrombocytopenia; HTR2A, 5-hydroxytryptamine receptor 2A; HWE, Hardy-Weinberg equilibrium; ID, (operational) identification number; IgA, immunoglobulin A; ITGB3, platelet glycoprotein receptor IIIa; KCNJ11/KIR-BIR, adenosine 5′-triphosphate–sensitive K+ inwardly rectifier channel/beta cell inward rectifier; MPO, myeloperoxidase; MTHFR, methylentetrahydrofolate reductase; NIDDM, non-insulin-dependent diabetes mellitus; PON1, paraoxonase 1; SLE, systemic lupus erythematosus; SRD5A2, steroid 5 alpha reductase 2; TGFBR1, transforming growth factor beta receptor 1; TP53, tumor protein 53; UCLH1, ubiquitin carboxy-terminal hydrolase L1; VDR, vitamin D receptor.
There were another five studies (2,271 people) for which HWE for the controls could not be assessed.
There were another five studies (927 people) for which HWE for the controls could not be assessed.
Impact of HWE-violating studies
In 24 of 27 meta-analyses with at least one HWE-violating study, the statistical significance of the summary odds ratio remained the same before and after excluding the HWE-violating studies (figure 1). Nevertheless, the associations between the UCHL1 S18Y polymorphism and Parkinson's disease (11 studies, (operational) identification number (ID) 17 in table 1), between the MTHFR C677T polymorphism and venous thromboembolism (30 studies, ID 37), and between the KIR6.2BIR E23K polymorphism and type II diabetes (five studies, ID 41) were no longer formally significant after we excluded the HWE-violating studies. In these three instances, the summary p values before exclusion of the HWE-violating studies ranged between 0.007 and 0.025.
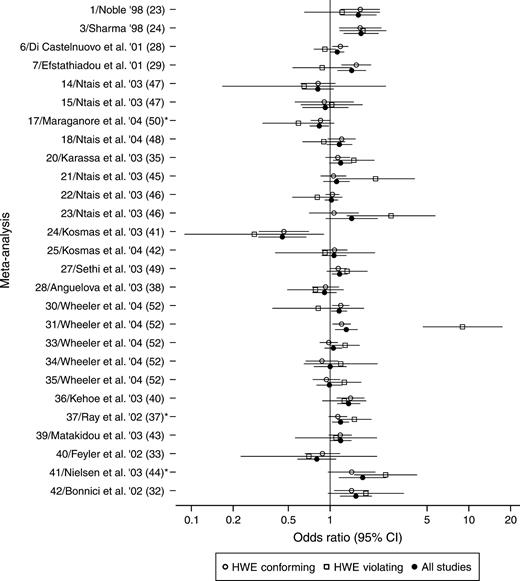
Meta-analyses that included or did not include studies violating Hardy-Weinberg equilibrium (HWE). Shown are 27 that included at least one association study in which departure from the Hardy-Weinberg law was statistically significant for the controls. Each meta-analysis is preceded by the (operational) identification number (ID) given in table 1, the first author of the study and the year of publication (e.g., '98 = 1998), and the reference number. For each meta-analysis, summary odds ratios and their 95% confidence intervals (CIs) are depicted. *, meta-analyses in which formal statistical significance was lost after HWE-violating studies were excluded.
In most meta-analyses, the absolute magnitude of the summary odds ratio was not substantially affected when HWE-violating studies were excluded from the calculations, but some exceptions were noted. The summary odds ratio changed by slightly over 10 percent in four meta-analyses and by 29 percent and 37 percent in two small meta-analyses with four and eight studies, respectively. In all other meta-analyses, the corresponding changes were much smaller (figure 1).
Studies showing significant departure from the Hardy-Weinberg law for the controls suggested either stronger (n = 13) or weaker (n = 14) estimates of association compared with the other studies (figure 1). In five instances, these discrepancies were beyond chance: HWE-violating studies showed no association between the ITGB3 L33P polymorphism and coronary artery disease or between the same marker and fractures (ID 6 and ID 7, respectively, in table 1), while other studies did. Conversely, HWE-violating studies claimed that the CYP17 MspI (ID 21) marker and the SRD5A2 A49T polymorphism (ID 23) conferred more than a twofold increased risk of prostate cancer, while the remaining studies showed no association. Similarly, a HWE-violating study showed an extreme association between the PON1 Q192R polymorphism and coronary stenosis (ID 31), while the effect was modest in the other studies (figure 1).
After we excluded HWE-violating studies, between-study heterogeneity lost its statistical significance for the association between the ITGB3 L33P polymorphism and fractures (ID 7 in table 1) and for the association between the MPO G-463A polymorphism and lung cancer (ID 40). Conversely, in the case of the MTHFR C677T polymorphism and neural tube defects (ID 3), the meta-analysis became significantly heterogeneous after we excluded the HWE-violating studies from our calculations. For the remaining 24 associations, there was no change in the formal significance status of heterogeneity. I2 did not consistently decrease or increase after exclusion of the HWE-violating studies (15 vs. nine instances, respectively, p = 0.18, adjusted for the three ties). Nevertheless, I2 decreased by more than 10 percent in six meta-analyses, whereas it did not increase by more than 10 percent in any instance (6 vs. 0, p = 0.014) (figure 2).
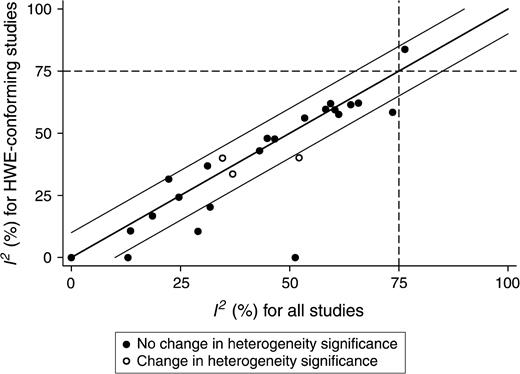
Extent of heterogeneity before and after exclusion of studies that violated Hardy-Weinberg equilibrium (HWE). I2 is shown before and after exclusion of studies in which the Hardy-Weinberg law was violated for the controls. The middle diagonal line is the line of equality. For studies plotted inside the area defined by the parallel lines above and below the line of equality, the change in I2 was less than 10%. The dashed reference lines correspond to I2 = 75%, the boundary for very high heterogeneity.
Impact of deviations from HWE
Adjustment for deviations from HWE changed the summary odds ratios by less than 10 percent in 33 of 42 meta-analyses. In the remaining nine meta-analyses, the change ranged between 10 percent and 31 percent, and the largest change was observed in a meta-analysis with only three studies. Overall, the summary adjusted odds ratio increased in 18 meta-analyses and decreased in 24 (figure 3). The pattern of changes was similar for allele-based meta-analyses and genotype-based meta-analyses (figure 3). In three meta-analyses of genotype-based contrasts, formal statistical significance of the postulated association was lost after adjustment for HWE deviations. Coronary artery disease was no longer associated with the L33P polymorphism of ITGB3 (ID 6 in table 1), schizophrenia was no longer associated with the Ser9Gly polymorphism of DRD3 (ID 29), and the same was true for myocardial infarction and the Q192R polymorphism of PON1 (ID 30). In all three instances, the p values in the original meta-analysis (without adjustment for HWE deviations) were relatively borderline (range, 0.02–0.04). There was no postulated gene-disease association that was nonsignificant in the unadjusted analysis but became significant after HWE adjustment.
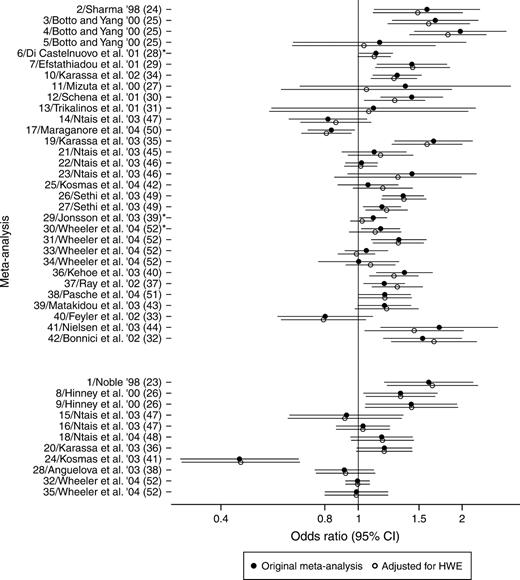
Meta-analyses before and after adjustments for departures from the Hardy-Weinberg law. Each meta-analysis is preceded by the (operational) identification number (ID) given in table 1, the first author of the study and the year of publication (e.g., '98 = 1998), and the reference number. The lower set of 11 meta-analyses used allele-based contrasts. For each meta-analysis, summary odds ratios and their 95% confidence intervals (CIs) are depicted. *, meta-analyses in which formal statistical significance was lost after adjustment for deviations from Hardy-Weinberg equilibrium (HWE).
After adjustments for deviations from HWE, between-study heterogeneity, as expressed by I2, increased in 28 meta-analyses and decreased in eight (p < 0.001, adjusted for six ties) (figure 4). In 11 instances, the increase in I2 was more than 10 percent, whereas, in two meta-analyses, I2 decreased by more than 10 percent, after the adjustments (p = 0.013). Heterogeneity became formally statistically significant in seven instances (the MTHFR C677T polymorphism and neural tube defects (ID 3 in table 1); the FCGR2A R131H polymorphism and systemic lupus erythematosus (ID 10); the UCHL1 S18Y polymorphism and Parkinson's disease (ID 17); the PON1 Q192R polymorphism and myocardial infarction (ID 30); the MTHFR C677T polymorphism and venous thromboembolism (ID 37); the TGFBR1 (del(GCC)3) polymorphism and cancer (ID 38); and the TP53 P72R polymorphism and lung cancer (ID 39)) where it was previously not formally significant; the opposite change was never seen. All seven instances in which heterogeneity became formally statistically significant after the correction used genotype comparisons.
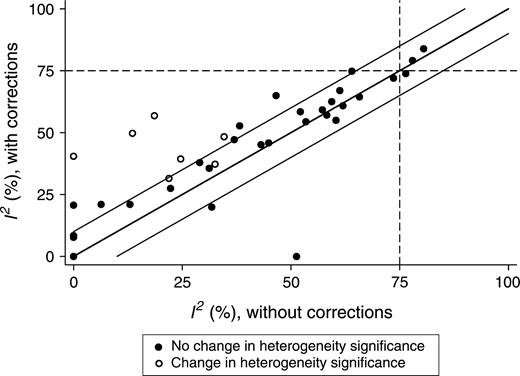
Extent of heterogeneity before and after adjustments for departures from the Hardy-Weinberg law for the controls. The layout is similar to that described for figure 2.
DISCUSSION
In this empirical investigation, we found that exclusion of HWE-violating studies may result in loss of the statistical significance of some postulated gene-disease associations and that adjustment for the magnitude of deviation from HWE may also have the same consequence for some other gene-disease associations. The two corrective measures seemed to affect different associations. Although the majority of the postulated gene-disease associations were not affected by these corrective measures, six of 23 gene-disease associations for which there was formally significant evidence lost their significance after exclusion of HWE-violating studies or adjustment for HWE deviations. In all of these instances, the results of the original meta-analysis were not highly statistically significant, and the original p values ranged between 0.007 and 0.04. Therefore, statistical significance was lost even though the change in the magnitude of the odds ratio was typically small with these corrective measures. None of the 19 nonsignificant associations became significant after we applied such HWE-related corrective measures. Exclusion of HWE-violating studies seemed to diminish modestly the between-study heterogeneity in some instances, whereas adjustment for HWE deviations tended to have the opposite effect.
Prior investigations seem to agree that significant deviations from HWE regarding genotype frequencies among healthy controls occur in approximately 10 percent of gene-disease association studies (14, 53–56). Only 5 percent would be expected by chance alone at the α = 0.05 significance level with adequately powered studies, and the actual expected percentage is probably even lower because several gene-disease association studies use very small, underpowered sample sizes (14). HWE may be violated because of genotyping error, chance, inbreeding, nonrandom mating, differential survival of marker carriers, genetic drifting, population stratification, or combinations of these reasons. Some of these effects may also occasionally act in different directions, canceling each other. Unfortunately, most gene-disease association studies report very limited information to provide any detailed insight into these potential problems. Thus, also at a meta-analysis level, typically there is no way to decipher for which of the above reasons the violation has occurred, except perhaps for population stratification under special conditions (57). For this reason, sensitivity analyses including and excluding the HWE-deviating studies have been recommended (58). However, most published meta-analyses systematically neglect such analyses (59). Adjustments for the magnitude of deviation from HWE are rarely performed in primary studies, and, to date, these corrections have not been introduced at all into meta-analyses, to our knowledge. Such adjustments are as useful to perform as exclusion of HWE-violating studies. The two corrective measures may offer complementary information.
Whenever HWE-related corrective measures resulted in loss of the significance of an association, the change in the estimates of the odds ratio was relatively small with these corrections. However, most effect sizes in genetic epidemiology are very modest anyway (3, 7–9). Formal statistical significance is routinely considered important for deciding whether or not the probed association is present. Our finding suggests that gene-disease associations should be pronounced with extra caution when p values are not much smaller than 0.05. Relatively minor deviations in the genotype frequencies could change whether or not formal significance is present. Thus, we recommend that meta-analyses and individual studies routinely examine whether their inferences are robust to accounting and correcting for HWE violations and deviations. When results are not robust, more data should be considered from well-designed studies. Moreover, the threshold for claiming statistical significance in gene-disease associations may need to shift toward smaller p values (60–63); however, no p-value threshold is likely to be perfect, and many methodologists are skeptical of p values. Alternatively, inferences should take into consideration not only the p value but also the prestudy probability that a postulated association is true and the potential for bias (64, 65).
The observed between-study heterogeneity for postulated gene-disease associations cannot be explained solely by the presence of HWE-violating studies. In fact, these studies seem to account for a small proportion of the observed heterogeneity. This finding may suggest that there are too few HWE-violating studies to make a difference in this regard, that formal HWE violation is an insensitive and/or unspecific marker of bias, that HWE tests are underpowered for most of the currently published case-control studies, or that there may be many other reasons that genetic association studies have heterogeneous results. Indeed, between-study heterogeneity in meta-analyses of gene-disease associations is typically substantial (66), and other tests, rather than simple HWE testing, may be more useful to dissect this heterogeneity (3, 7). It is prudent to exercise even greater caution when only a few studies are available, since early published data may be biased for other reasons (3, 66, 67).
After we adjusted for deviations from the Hardy-Weinberg law, studies became more heterogeneous among themselves, and, in seven meta-analyses, heterogeneity became formally significant. This finding is probably attributed mainly to the fact that, for genotype-based contrasts, the variance of each study's adjusted odds ratio becomes smaller after correcting for departures from HWE (22). Thus, correction for HWE deviations may make even more prominent the diversity in the results of studies on the same postulated association. The between-study heterogeneity observed in genetic epidemiology is usually larger compared with other research fields (7, 66). This heterogeneity is important to describe, quantify, and try to explain. Meta-analysis should aim at more than simply arriving to a grand mean (68), and dissection of between-study heterogeneity can provide some valuable information.
Some limitations of the present empirical evaluation should be discussed. First, the type of genetic contrast chosen may have affected some of the analyses we performed. For this reason, we used an a priori algorithm that had been already agreed on in previous research (3) to avoid subjectivity in choosing genetic contrasts. Second, only those meta-analyses for which genotype-level information was available were selected. This limitation was unavoidable, however, since one cannot rely on the assertions of the primary authors about HWE testing, because these assertions often do not represent the data accurately (14). Third, even though almost 600 studies were targeted, this number still represents only a small proportion of the gene-disease association studies conducted to date. However, there is no strong reason to believe that these studies and their meta-analyses would suffer from selection biases that would invalidate the aforementioned findings. Finally, the extent to which the HWE-related problems were due to genotyping error could not be probed. Doing so would require retesting samples from the analyzed studies and would be infeasible given the wide diversity of teams involved in these studies. The suggestion of correction for HWE violations might not seem very practical in genotype-based studies if individual studies have verified that the HWE violations were not due to genotyping error. However, apart from the fact that few—if any—studies can claim immunity to genotypic errors, departure from HWE even due to chance may introduce a statistical bias that would especially affect allele-based contrasts (69). Thus, correction for departures from HWE should be applicable even when the probability for substantial genotyping error is low. We should also acknowledge that the proposed corrections may be more complex if other covariates, and/or matching of cases and controls, have to be taken into account in a meta-analysis. Such issues might be addressed by using hierarchic meta-regression analyses in a Bayesian framework that would also take into account departures from HWE. However, the vast majority of case-control genetic association studies still present primarily and/or exclusively unmatched data without covariate adjustment.
Allowing for these caveats, we conclude that HWE should be routinely and transparently assessed in gene-disease association studies and their meta-analyses. Simple statistical testing for significant violations of the Hardy-Weinberg law may not suffice, and the data should be scrutinized by also taking into account nonsignificant deviations from HWE. Instructions and guidance to authors of gene-disease association studies and meta-analyses thereof may need to reinforce attention to HWE issues. Discrepant results in these analyses do not necessarily mean that postulated associations should be dismissed, but they should hint at the need for more evidence and validation.
APPENDIX
To correct for departures from HWE for the controls for genotype-based contrasts (22), let G1 and G2 be the genotype groups that are contrasted in an association study of a biallelic locus (alleles A and α) with a disease (by genotype groups, we refer to genotypes: AA, Aa, or aa; or combinations of genotypes: AA + Aa, Aa, + aa, etc.). The Lathrop correction for deviations from HWE in the controls calculates the adjusted odds ratio (ORadj) by using the HWE-predicted genotype counts in the control group (
Conflict of interest: none declared.
References
Khoury MJ, Little J. Human genome epidemiologic reviews: the beginning of something HuGE.
Ioannidis JP, Ntzani EE, Trikalinos TA, et al. Replication validity of genetic association studies.
Hirschhorn JN, Lohmueller K, Byrne E, et al. A comprehensive review of genetic association studies.
Little J, Khoury MJ, Bradley L, et al. The human genome project is complete. How do we develop a handle for the pump?
Easterbrook PJ, Berlin JA, Gopalan R, et al. Publication bias in clinical research.
Ioannidis JP, Trikalinos TA, Ntzani EE, et al. Genetic associations in large versus small studies: an empirical assessment.
Ioannidis JP, Ntzani EE, Trikalinos TA. ‘Racial’ differences in genetic effects for complex diseases.
Lohmueller KE, Pearce CL, Pike M, et al. Meta-analysis of genetic association studies supports a contribution of common variants to susceptibility to common disease.
Khoury MJ, Beaty TH, Cohen BH, eds. Fundamentals of genetic epidemiology. New York, NY: Oxford University Press,
Mitchell AA, Cutler DJ, Chakravarti A. Undetected genotyping errors cause apparent overtransmission of common alleles in the transmission/disequilibrium test.
Hosking L, Lumsden S, Lewis K, et al. Detection of genotyping errors by Hardy-Weinberg equilibrium testing.
Bardoczy Z, Gyorffy B, Kocsis I, et al. Re-calculated Hardy-Weinberg values in papers published in Atherosclerosis between 1995 and 2003.
Salanti G, Amountza G, Ntzani EE, et al. Hardy-Weinberg equilibrium in genetic association studies: an empirical evaluation of reporting, deviations, and power.
Shoemaker J, Painter I, Weir BS. A Bayesian characterization of Hardy-Weinberg disequilibrium.
Lau J, Ioannidis JP, Schmid CH. Quantitative synthesis in systematic reviews.
Higgins JP, Thompson SG, Deeks JJ, et al. Measuring inconsistency in meta-analyses.
Cappelleri JC, Ioannidis JP, Schmid CH, et al. Large trials vs meta-analysis of smaller trials: how do their results compare?
Schaid DJ, Jacobsen SJ. Biased tests of association: comparisons of allele frequencies when departing from Hardy-Weinberg proportions.
Noble EP. The D2 dopamine receptor gene: a review of association studies in alcoholism and phenotypes.
Sharma P. Meta-analysis of the ACE gene in ischaemic stroke.
Botto LD, Yang Q. 5,10-Methylenetetrahydrofolate reductase gene variants and congenital anomalies: a HuGE review.
Hinney A, Remschmidt H, Hebebrand J. Candidate gene polymorphisms in eating disorders.
Mizuta I, Mizuta E, Yamasaki S, et al. Meta-analysis of polymorphism of the catechol-O-methyltransferase gene in relation to the etiology of Parkinson's disease in Japan.
Di Castelnuovo A, de Gaetano G, Donati MB, et al. Platelet glycoprotein receptor IIIa polymorphism PLA1/PLA2 and coronary risk: a meta-analysis.
Efstathiadou Z, Tsatsoulis A, Ioannidis JP. Association of collagen Ialpha 1 Sp1 polymorphism with the risk of prevalent fractures: a meta-analysis.
Schena FP, D'Altri C, Cerullo G, et al. ACE gene polymorphism and IgA nephropathy: an ethnically homogeneous study and a meta-analysis.
Trikalinos TA, Karassa FB, Ioannidis JP. Meta-analysis of the association between low-affinity Fcgamma receptor gene polymorphisms and hematologic and autoimmune disease. (Letter).
Bonnici F, Keavney B, Collins R, et al. Angiotensin converting enzyme insertion or deletion polymorphism and coronary restenosis: meta-analysis of 16 studies.
Feyler A, Voho A, Bouchardy C, et al. Point: myeloperoxidase-463G → a polymorphism and lung cancer risk.
Karassa FB, Trikalinos TA, Ioannidis JP, et al. Role of the Fcgamma receptor IIa polymorphism in susceptibility to systemic lupus erythematosus and lupus nephritis: a meta-analysis.
Karassa FB, Bijl M, Davies KA, et al. Role of the Fcgamma receptor IIA polymorphism in the antiphospholipid syndrome: an international meta-analysis.
Karassa FB, Trikalinos TA, Ioannidis JP, et al. The Fc gamma RIIIA-F158 allele is a risk factor for the development of lupus nephritis: a meta-analysis.
Ray JG, Shmorgun D, Chan WS. Common C677T polymorphism of the methylenetetrahydrofolate reductase gene and the risk of venous thromboembolism: meta-analysis of 31 studies.
Anguelova M, Benkelfat C, Turecki G. A systematic review of association studies investigating genes coding for serotonin receptors and the serotonin transporter: II. Suicidal behavior.
Jonsson EG, Flyckt L, Burgert E, et al. Dopamine D3 receptor gene Ser9Gly variant and schizophrenia: association study and meta-analysis.
Kehoe PG, Katzov H, Feuk L, et al. Haplotypes extending across ACE are associated with Alzheimer's disease.
Kosmas IP, Tatsioni A, Ioannidis JP. Association of Leiden mutation in factor V gene with hypertension in pregnancy and pre-eclampsia: a meta-analysis.
Kosmas IP, Tatsioni A, Ioannidis JP. Association of C677T polymorphism in the methylenetetrahydrofolate reductase gene with hypertension in pregnancy and pre-eclampsia: a meta-analysis.
Matakidou A, Eisen T, Houlston RS. TP53 polymorphisms and lung cancer risk: a systematic review and meta-analysis.
Nielsen EM, Hansen L, Carstensen B, et al. The E23K variant of Kir6.2 associates with impaired post-OGTT serum insulin response and increased risk of type 2 diabetes.
Ntais C, Polycarpou A, Ioannidis JP. Association of the CYP17 gene polymorphism with the risk of prostate cancer: a meta-analysis.
Ntais C, Polycarpou A, Ioannidis JP. SRD5A2 gene polymorphisms and the risk of prostate cancer: a meta-analysis.
Ntais C, Polycarpou A, Ioannidis JP. Vitamin D receptor gene polymorphisms and risk of prostate cancer: a meta-analysis.
Ntais C, Polycarpou A, Ioannidis JP. Meta-analysis of the association of the Cathepsin D Ala224Val gene polymorphism with the risk of Alzheimer's disease: a HuGE gene-disease association review.
Sethi AA, Nordestgaard BG, Tybjaerg-Hansen A. Angiotensinogen gene polymorphism, plasma angiotensinogen, and risk of hypertension and ischemic heart disease: a meta-analysis.
Maraganore DM, Lesnick TG, Elbaz A, et al. UCHL1 is a Parkinson's disease susceptibility gene.
Pasche B, Kaklamani V, Hou N, et al. TGFBR1*6A and cancer: a meta-analysis of 12 case-control studies. (Letter).
Wheeler JG, Keavney BD, Watkins H, et al. Four paraoxonase gene polymorphisms in 11212 cases of coronary heart disease and 12786 controls: meta-analysis of 43 studies.
Gyorffy B, Kocsis I, Vasarhelyi B. Biallelic genotype distributions in papers published in Gut between 1998 and 2003: altered conclusions after recalculating the Hardy-Weinberg equilibrium. (Letter).
Gyorffy B, Kocsis I, Vasarhelyi B. Missed calculations and new conclusions: re-calculation of genotype distribution data published in Journal of Investigative Dermatology, 1998–2003. (Letter).
Kocsis I, Gyorffy B, Nemeth E, et al. Examination of Hardy-Weinberg equilibrium in papers of Kidney International: an underused tool.
Kocsis I, Vasarhelyi B, Gyorffy A, et al. Reanalysis of genotype distributions published in Neurology between 1999 and 2002.
Pritchard JK, Stephens M, Rosenberg NA, et al. Association mapping in structured populations.
Thakkinstian A, McElduff P, D'Este C, et al. A method for meta-analysis of molecular association studies.
Attia J, Thakkinstian A, D'Este C. Meta-analyses of molecular association studies: methodologic lessons for genetic epidemiology.
Risch N, Merikangas K. The future of genetic studies of complex human diseases.
Altshuler D, Kruglyak L, Lander E. Genetic polymorphisms and disease. (Letter).
Dahlman I, Eaves IA, Kosoy R, et al. Parameters for reliable results in genetic association studies in common disease.
Lander E, Kruglyak L. Genetic dissection of complex traits: guidelines for interpreting and reporting linkage results.
Wacholder S, Chanock S, Garcia-Closas M, et al. Assessing the probability that a positive report is false: an approach for molecular epidemiology studies.
Ioannidis JP. Why most published research findings are false.
Ioannidis JP, Trikalinos TA. Early extreme contradictory estimates may appear in published research: the Proteus phenomenon in molecular genetics research and randomized trials.
Trikalinos TA, Ntzani EE, Contopoulos-Ioannidis DG, et al. Establishment of genetic associations for complex diseases is independent of early study findings.
Lau J, Ioannidis JP, Schmid CH. Summing up evidence: one answer is not always enough.

