


Abstract
Poor respiratory function and obesity are associated with all-cause and cardiovascular disease mortality. Obese persons may also have impaired lung function, but the mechanism is unclear. The authors investigated the relation between abdominal pattern of obesity and respiratory function in the European Prospective Investigation into Cancer and Nutrition–Norfolk (EPIC-Norfolk) cohort in Norfolk, United Kingdom. This analysis included 9,674 men and 11,876 women aged 45–79 years with no known preexisting serious illness who had complete anthropometric and respiratory function measures obtained at a health visit between 1993 and 1997. Waist:hip ratio was used to assess abdominal obesity, and forced expiratory volume in 1 second (FEV1) and forced vital capacity (FVC), obtained by spirometry, were used to assess respiratory function. Both FEV1 and FVC were linearly and inversely related across the entire range of waist:hip ratio in both men and women. This relation persisted after adjustment for age, body mass index, cigarette smoking, social class, physical activity index, prevalent bronchitis/emphysema, and prevalent asthma. The association remained significant among nonobese nonsmokers without preexisting respiratory disease. In the general adult population, abdominal fat deposition may play a role in the impairment of respiratory function among the abdominally obese.
Received for publication September 18, 2003; accepted for publication January 8, 2004.
Impaired respiratory function is associated with morbidity (1) and mortality (1–7). Poor respiratory function predicts overall mortality, as well as death due to cancer (3, 6, 8), pulmonary disease (2, 9), cardiovascular disease (1–4, 6, 8), and stroke (8). This relation could simply reflect the effect of cigarette smoking, respiratory illness, or other preexisting disease (10–14). There is less information on determinants of respiratory function other than cigarette smoking in the general population. Obesity is also associated with morbidity and mortality (15). A number of studies have reported an inverse relation between respiratory function and various indices of obesity or fat distribution. These indices include measures of overall adiposity, such as weight or body mass index (weight (kg)/height (m)2) (14, 16–20), and measures of fat distribution, such as waist circumference (18), ratio of waist circumference to body surface area (18) or height (21), percentage of fat mass (22), and skinfold thickness (22, 23). Clinical studies have reported that waist:hip ratio, as a measure of abdominal obesity, was associated with poor respiratory function in both mildly obese (23) and morbidly obese (13) persons. Another study reported that lung function was associated with waist:hip ratio in older men but not in women (14, 22). Inferences from these studies are limited, because many have been restricted to men, have focused on extreme levels of obesity, or have had small sample sizes. It is also not clear whether the relation between waist:hip ratio and respiratory function observed in these studies is simply explained by body mass index. To address some of these limitations, we examined the relation between respiratory function and abdominal obesity in a large free-living population of men and women.
MATERIALS AND METHODS
The European Prospective Investigation into Cancer and Nutrition (EPIC) is a multicenter prospective study of diet and cancer in Europe. The EPIC cohort in Norfolk, United Kingdom (EPIC-Norfolk) expanded its aims to include determinants of other chronic diseases. In the EPIC-Norfolk cohort, recruitment started in 1993 and ended in 1997. The study was approved by the Norfolk Health District Ethics Committee. Details on procedures and participant recruitment have been published previously (21).
Briefly, participants aged 45–79 years were recruited through the age-sex registers of collaborating general practices in Norfolk. Persons who consented completed a health and lifestyle questionnaire from which demographic data were obtained. At a clinic visit, trained nurses took the anthropometric measurements of participants while they stood in light clothing without shoes, using a standard protocol (24). Height was measured to the nearest 0.1 cm using a free-standing stadiometer. Weight was measured to the nearest 100 g using digital scales (Salter, Tonbridge, United Kingdom). Body mass index was calculated from the weight and height measures. A D-loop nonstretch fiberglass tape was used for the circumference measures. Waist circumference was measured at the smallest circumference between the ribs and the iliac crest to the nearest 0.1 cm while the participant was standing with the abdomen relaxed, at the end of a normal expiration. Where there was no natural waistline, the measurement was taken at the level of the umbilicus. Hip circumference was measured at the maximum circumference between the iliac crest and the crotch while the participant was standing and was recorded to the nearest 0.1 cm. Waist:hip ratio was then calculated from the waist and hip measures (waist circumference/hip circumference). Respiratory function was assessed by spirometry (25). Forced expiratory volume in 1 second (FEV1) and forced vital capacity (FVC) were measured twice using a portable spirometer (Micro Medical, Rochester, United Kingdom).
On the questionnaire, participants were asked, “Has the doctor ever told you that you have any of the following?”, after which was a list of various medical conditions, including cancer (except nonmelanoma skin cancer), heart disease (also heart attack or myocardial infarction), stroke, bronchitis/emphysema, and asthma. Participants were considered to have the condition if they ticked the “yes” option alongside the specific medical condition. Participants were defined as current smokers if they reported currently smoking cigarettes (that is, gave an affirmative response to the question “Do you smoke now?”), former smokers if they reported having smoked previously (“yes” to the question “Have you ever smoked as much as one cigarette a day for as long as a year?” but “no” to the question “Do you smoke now?”), and never smokers if they gave no affirmative response to any of the questions on smoking.
Participants were grouped by occupational social class (26) as professional (I), managerial (II), skilled—nonmanual (IIIa), skilled—manual (IIIb), partly skilled (IV), or unskilled (V). Participants were also asked to describe their level of activity at work. This variable was defined as sedentary work (spending most of the time sitting), standing work (spending most of the time standing or walking but not doing any work requiring intense physical effort), physical work (doing work involving physical effort, including the handling of heavy objects and the use of tools), or heavy manual work (work involving very vigorous physical activity, including the handling of very heavy objects). Participants indicated the number of hours they spent in various activities during recreational and leisure time (walking, cycling, and other physical exercise). In a validation study conducted separately, the energy expenditure of the work- and leisure-related activity variables was shown to be related to total daily energy expenditure (27). On the basis of the combined information on level of activity at work and amount of hours spent in leisure activities, participants were then divided into four physical activity index groups, with level I designated the most sedentary (including persons who did not report any physical activity) and level IV defined as spending the most number of hours in leisure-time activities and/or involved in heavy manual work. The index represents the grouping of participants from the least active persons (level I) to the most active persons (level IV).
There were 25,623 participants who attended the health check. Of these, 24,605 were aged 45–79 years at the baseline health check. We excluded persons who had had cardiovascular disease (history of heart disease, myocardial infarction, or stroke) (n = 1,099) or cancer (except nonmelanoma skin cancer) (n = 1,373), those with missing data on anthropometric measures (n = 86), those who died within the first year after the date of the health-check visit (n = 129), and those who had no data on lung function measures (n = 504). After the exclusion of 3,055 persons (people may have had one or more of the exclusion criteria), the remaining 21,550 participants (9,674 men and 11,876 women) formed the basis of this analysis.
Abdominal obesity was assessed using the waist:hip ratio. Respiratory function was evaluated on the basis of the FEV1 and FVC measures. The higher values of the two readings for FEV1 and FVC were used for the analyses. Participants were divided into sex-specific quintiles of waist:hip ratio, and subsequent analyses were sex-specific. Mean values for FEV1 and FVC were computed for each quintile of waist:hip ratio. Actual individual FEV1 and FVC values were used, and the values were then adjusted for covariates, including age, height, body mass index, cigarette smoking (never, former, and current), prevalent bronchitis/emphysema (yes vs. no), asthma (yes vs. no), social class (class I, II, IIIa, IIIb, IV, or V), and physical activity index (level I, II, III, or IV). As covariates, age, height, and body mass index were treated as continuous variables, while the rest of the covariates were treated as categorical variables in the regression models.
The magnitude of the effect of every 0.05-unit increase in waist:hip ratio on respiratory function was assessed using univariate and multivariate regression models. The standard deviations of waist:hip ratio in men and women were 0.059 and 0.062, respectively. We used 0.05 as the value for a one-unit change in waist:hip ratio to allow comparability of estimates between men and women and to allow for more meaningful interpretations of the coefficients for FEV1 and FVC associated with a one-unit change in waist:hip ratio. To investigate the interrelation between lung function, waist:hip ratio, and body mass index, we stratified participants by quartiles of waist:hip ratio and body mass index and assessed their lung function. We also compared the magnitude of the effect of obesity measures on lung FEV1 and FVC. The associations of respiratory function with one-quintile changes in waist:hip ratio, body mass index, and waist circumference were determined in separate regression models (models 1–3), as well as in combined regression models for body mass index together with waist:hip ratio (model 4) or waist circumference (model 5). Quintiles of body mass index and of the adiposity terms were used in this particular analysis to allow comparability of effect sizes between the three measures.
The correlation of body mass index with waist:hip ratio was 0.57 in men and 0.41 in women, and its correlation with waist circumference was 0.85 in both men and women. Significance testing for trend was conducted using regression models. A value of p < 0.05 (two-sided) was used to determine statistical significance. Regression coefficients and 95 percent confidence intervals were also calculated. Intercooled Stata 8.0 (Stata Corporation, College Station, Texas) was used to perform statistical analyses.
RESULTS
In this cohort, mean age, body mass index, and waist:hip ratio for men were 59.6 years (standard deviation (SD), 8.8), 26.5 (SD, 3.3), and 0.930 (SD, 0.059), respectively. For women, mean age, body mass index, and waist:hip ratio were 59.3 years (SD, 8.8), 26.3 (SD, 4.3), and 0.793 (SD, 0.062), respectively. Men who had no data on respiratory function measures (n = 229) were slightly older (p = 0.05) and had a higher waist:hip ratio (p = 0.02), but there was no difference in body mass index (p = 0.45) or height (p = 0.44) when they were compared with men who were included in the current analysis. Women who had no data on respiratory function measures (n = 275) had a higher waist:hip ratio (p = 0.01), but there was no difference in age (p = 0.52), body mass index (p = 0.23), or height (p = 0.61) when they were compared with women included in this analysis.
Table 1 shows the characteristics of participants by quintiles of waist:hip ratio. Men and women who were in the higher waist:hip ratio quintiles were older and had higher values for anthropometric measures, a higher prevalence of bronchitis/emphysema and asthma, greater proportions of current smokers and persons in social classes IV and V, and a lower physical activity index. Mean FEV1 values were 2.92 liters (SD, 0.73) and 2.13 liters (SD, 0.52) for men and women, respectively. Across quintiles of waist:hip ratio, respiratory function values decreased. Comparing the top quintile with the bottom quintile, FEV1 and FVC were lower in men by 530 ml and 670 ml, respectively, and in women by 400 ml and 480 ml, respectively. The FEV1 and FVC values in the top quintile were approximately 17 percent lower than those in the bottom quintile in both men and women. After adjustment for age, height, body mass index, cigarette smoking, and other potential confounders, mean values for FEV1 and FVC decreased across waist:hip ratio quintiles in both sexes. In men, the covariate-adjusted FEV1 value was lower by approximately 290 ml between the lowest and highest quintiles of waist:hip ratio, while FVC was lower by 410 ml. In women, FEV1 and FVC values were lower by 80 ml and 140 ml, respectively.
Multivariate regression coefficients confirmed the presence of independent and inversely linear relations between waist:hip ratio and FEV1 and FVC (table 2). The inverse relation between respiratory function and waist:hip ratio remained significant after adjustment for age, height, body mass index, cigarette smoking, physical activity, and other covariates. These relations were still present after exclusion of current smokers and persons with previously known bronchitis/emphysema or asthma. Even among never smokers and those without known bronchitis/emphysema or asthma, FEV1 and FVC values associated with a 0.05-unit increase in waist:hip ratio in men were –62.9 ml (95 percent confidence interval (CI): –83.5, –42.3) and –103.6 ml (95 percent CI: –132.0, –75.2), respectively. Those values in women were –16.2 ml (95 percent CI: –25.0, –7.3) and –28.8 ml (95 percent CI: –40.4, –17.2), respectively.
Respiratory function was also examined across waist:hip ratio quartiles stratified by body mass index (figures 1 and 2). For a given body mass index quartile, mean FEV1 and FVC decreased with increasing waist:hip ratio in both men and women. For a given waist:hip ratio quintile, an inverse relation between respiratory function and body mass index was less apparent, particularly in men. In women, lung function was lowest among those who were in both the top waist:hip ratio quartile and the top body mass index quartile. In men, the lowest lung function values were noted among those in the top waist:hip ratio quartile but the bottom body mass index quartile. Their values for FEV1 and FVC were lower by 420 ml and 560 ml, respectively, when compared with the values of men in the bottom waist:hip ratio quartile and the top body mass index quartile.
The effect of obesity measures on FEV1 and FVC was also analyzed (table 3). Negative coefficients were apparent for lung function in men and women with increasing quintiles of waist:hip ratio, body mass index, and waist circumference, even after adjustment for age and height. Waist:hip ratio showed the biggest reduction in comparison with body mass index or waist circumference. When further adjustments for height were made, waist:hip ratio in men and waist circumference in women were associated with a bigger reduction in respiratory function compared with body mass index. Combining both waist:hip ratio and body mass index quintile in the same model, the negative coefficients for waist:hip ratio in men persisted and even increased in magnitude (model 4). In women, the effect of waist:hip ratio was attenuated by body mass index, but both measures were still inversely related to lung function. On its own, the age-adjusted regression model showed that waist circumference was inversely related to respiratory function in both men and women, but the coefficients were of lesser magnitude than those for waist:hip ratio or body mass index. Combining both waist circumference and body mass index in the same regression model (model 5) showed that the age-adjusted coefficients for waist circumference were attenuated in both men and women. However, the magnitude of the effect of waist circumference on lung function increased when height (model 3) or both height and body mass index (model 5) were added to the age-adjusted regression models.
DISCUSSION
An inverse relation between respiratory function and abdominal obesity was observed in this population of older men and women who had no previously known heart disease, stroke, or cancer. Both FEV1 and FVC mean values were lower among persons in the higher quintiles of waist:hip ratio, and this relation was consistent for both men and women. This relation remained significant even after adjustment for age, height, body mass index, cigarette smoking, physical activity, prevalent bronchitis/emphysema, prevalent asthma, and social class. Even among relatively healthy nonsmoking persons without preexisting respiratory disease, the association was significant.
Although the magnitude of the relation was not large, it was surprising that an effect was demonstrable given the measurement errors in assessing lung function. Even though only the better result of the two measurements taken was used in the analyses, FEV1 and FVC are highly influenced by the voluntary effort exerted in performing the maneuver (28). Baseline disability may influence performance in lung function tests. However, persons who had prevalent serious illness (those who had heart disease, stroke, or cancer at baseline) were excluded from the analyses. We also excluded from our analyses persons who had missing data on respiratory function measures. These persons had higher waist:hip ratios than persons included in this study. Hence, it is more likely that our study could only underestimate any true association in the general population. Exclusion of obese persons (body mass index >30) from the analyses did not significantly change the results. As in other reports, age and height were important determinants of respiratory function (10, 13, 28), and taking these variables into account attenuated the variation of the mean FEV1 and FVC values across waist:hip ratio quintiles. Adjustment for social class did not significantly change the findings. Moreover, the effect of social class or other socioeconomic indicators may be reflected through the smoking patterns and preexisting health conditions of the cohort.
Obesity and respiratory function could both reflect some underlying common etiology. Cigarette smokers have been reported to have lower FEV1 and FVC values (7, 10), as well as a higher waist:hip ratio (29–31). However, the inverse relation remained significant even among never smokers only. The proportions of persons with known respiratory illnesses such as chronic bronchitis, emphysema, and asthma, which could likewise reduce FEV1 and FVC (13), were highest in the top waist:hip ratio quintiles. Adjusting for or excluding persons with preexisting respiratory illnesses attenuated the relation, but the findings remained significant.
The inverse relation with respiratory function is consistent with the findings of other studies that measured waist:hip ratio (14, 22). Unlike the findings in the study by Lazarus et al. (22) and in the second Health and Lifestyle Survey (14), our current findings showed a relation not only in men but in women as well. Differences in the findings may be due to a lack of statistical power to detect small effects (22), the use of published regression equations to predict body composition (22), or the inclusion of women of much younger ages (18–45 years) (14) in the analyses. Of all the various indices of obesity, waist:hip ratio had the most consistent negative independent correlation with lung function in our cohort. This result differed from that of the study by Collins et al. (23), where lung function was more strongly negatively correlated with body mass index than waist:hip ratio. The high correlation of waist circumference and lung function in women is consistent with findings from another study (32). Although waist circumference, on its own or when adjusted for body mass index, is less related to respiratory function, adjusting further for height showed a strong inverse relation between lung function and waist circumference. The collinearity of waist circumference with body mass index makes the independent effect of waist circumference more difficult to interpret. Nevertheless, it is plausible that waist circumference, as an indicator of abdominal fat deposition, has to be understood in the context of body size to allow us to understand its full effect on respiratory function.
There was also an intriguing sex difference in our findings. In men, for any given level of waist:hip ratio, lung function became positively related to body mass index, but in women, a negative relation of lung function with body mass index was still apparent after adjustment for waist:hip ratio. The difference in the proportion of fat and lean mass and the difference in the fat mass distribution between men and women (33) are not necessarily reflected when using body mass index. After adjustment for waist:hip ratio, the independent effect of body mass index on respiratory function observed in men could reflect the influence of their higher ventilatory muscle mass or strength in comparison with women. However, we could not determine whether men would exert stronger effort than women in performing spirometry. Whatever the explanation for the varying relation of body mass index with respiratory function, the more consistent association of waist:hip ratio with lung function in both men and women and in all subgroups suggests that waist:hip ratio is a better indicator than body mass index in determining the role of obesity in predicting lung function in the general population.
Obesity may directly affect respiratory function through various mechanisms. The accumulation of fat may mechanically affect the expansion of the diaphragm, probably by encroaching into the chest by the chest wall or diaphragm (20) or by impeding the descent of the diaphragm during forced inspiration (22). Low FEV1 and FVC values suggest restrictive lung patterns among obese persons (34). Fat deposits between the muscles and the ribs may also decrease chest wall compliance (1, 13, 35), thereby increasing the metabolic demands and workload of breathing in the obese even when at rest (35–37). On the other hand, chronically obese persons have been shown to have peripheral airway obstruction independent of smoking (38). It is plausible that hypoxia due to chronic obstruction may then trigger the sympathetic nervous system activity leading to increased pulmonary vascular resistance (39, 40). Consequently, the capacity for air in the lungs decreases.
It is also possible that respiratory function and abdominal obesity are both related to physical activity. Increased physical activity is related to lower waist:hip ratio in adult men (31, 41) and in young adult men and women (42), but the relation between respiratory function and physical activity is not well documented. Increased lung function has been demonstrated after prolonged periods of training in select population groups such as athletes, particularly among children and younger swimmers (43, 44), but not among adult runners and rowers (44). In a longitudinal study, daily physical activity was positively related to FVC but not to FEV1 (45). Among elderly men, both FEV1 and FVC were positively associated with physical activity (10). In the EPIC-Norfolk cohort, various indicators of physical activity showed that persons engaged in more active leisure activities had better respiratory function than persons who were leading a more sedentary lifestyle and that those who were engaged in more vigorous leisure-time activities had a slower decline in FEV1 (46). The mechanism by which enhanced physical activity improves lung function is unclear, but it was suggested that ventilatory muscle-strength exercise enhanced maximal shortening of the inspiratory muscles (47), thereby increasing maximal respiratory pressure, which is positively associated with higher FVC (48). While adjustment for physical activity did not alter the relation of waist:hip ratio and lung function, it may be that measurement error in the assessment of physical activity did not permit adequate adjustment.
There were limitations in this study that should be considered. Our findings were obtained mainly in White British men and women; hence, our findings may be less generalizable to other populations or ethnic groups. Despite adjustments for possible confounders, we could not totally rule out residual confounding. The findings were based on cross-sectional analyses, and it remains to be seen whether reducing abdominal obesity, whether through physical activity or other means, will improve respiratory function or slow the age-related decline in lung function. Nevertheless, the relation of FEV1 and FVC with abdominal obesity appeared to be independent of other variables that are known to be important determinants of respiratory function. This relation was apparent across the entire normal population distribution of waist:hip ratio, even among nonobese never smokers and those without known respiratory disease.
Further exploration of this relation might highlight factors other than smoking and pulmonary disease that may be important determinants of respiratory function in the general population. The relation between abdominal obesity and pulmonary function may also suggest a possible role of abdominal obesity in the etiology of mortality associated with decreased pulmonary function, particularly death related to cardiovascular disease. Alternatively, impaired respiratory function may form part of the various pathways by which obesity may cause cardiovascular disease.
ACKNOWLEDGMENTS
The EPIC-Norfolk Study is supported by research program funding from the Cancer Research Campaign and the Medical Research Council, with additional grants from the Stroke Association, the British Heart Foundation, the Department of Health, the Europe Against Cancer Programme Commission of the European Union, the Food Standards Agency, and the Wellcome Trust.
Correspondence to Dr. Dexter Canoy, Department of Public Health and Primary Care, University of Cambridge, Strangeways Site, Worts’ Causeway, Cambridge CB1 8RN, United Kingdom (e-mail: dexter.canoy@srl.cam.ac.uk).
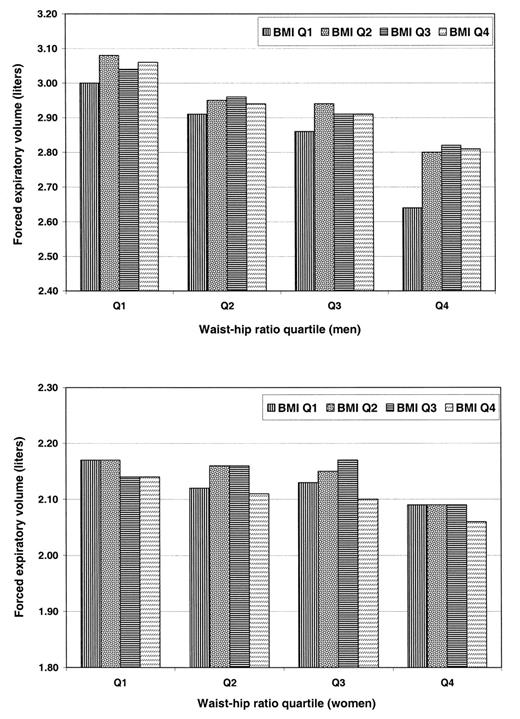
FIGURE 1. Forced expiratory volume in 1 second (liters) by quartile (Q) of waist:hip ratio and body mass index (BMI) (weight (kg)/height (m)2) in 9,674 men and 11,876 women aged 45–79 years without prevalent heart disease, stroke, or cancer, European Prospective Investigation into Cancer and Nutrition–Norfolk, United Kingdom, 1993–1997. Values were adjusted for age, height, cigarette smoking (never, former, or current), physical activity index (I, II, III, or IV), prevalent bronchitis/emphysema (yes vs. no), prevalent asthma (yes vs. no), and social class (I, II, IIIa, IIIb, IV, or V).
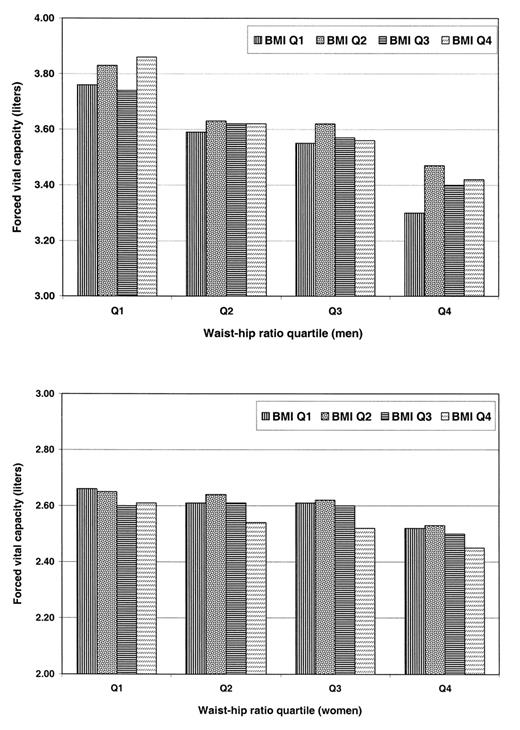
FIGURE 2. Forced vital capacity (liters) by quartile (Q) of waist:hip ratio and body mass index (BMI) (weight (kg)/height (m)2) in 9,674 men and 11,876 women aged 45–79 years without prevalent heart disease, stroke, or cancer, European Prospective Investigation into Cancer and Nutrition–Norfolk, United Kingdom, 1993–1997. Values were adjusted for age, height, cigarette smoking (never, former, or current), physical activity index (I, II, III, or IV), prevalent bronchitis/emphysema (yes vs. no), prevalent asthma (yes vs. no), and social class (I, II, IIIa, IIIb, IV, or V).
Characteristics of 9,674 men and 11,876 women aged 45–79 years without prevalent heart disease, stroke, or cancer, by quintile of waist:hip ratio, European Prospective Investigation into Cancer and Nutrition–Norfolk, United Kingdom, 1993–1997*
| Variable | Quintile of waist:hip ratio† | |||||||||||||
| Q‡1 | Q2 | Q3 | Q4 | Q5 | ||||||||||
| Mean or % | SD‡ or no. | Mean or % | SD or no. | Mean or % | SD or no. | Mean or % | SD or no. | Mean or % | SD or no. | |||||
| Men | ||||||||||||||
| No. of participants | 1,936 | 1,934 | 1,939 | 1,931 | 1,934 | |||||||||
| Mean waist:hip ratio | 0.848 | 0.030 | 0.900 | 0.010 | 0.930 | 0.008 | 0.959 | 0.010 | 1.012 | 0.036 | ||||
| Mean body mass index§ | 23.9 | 2.5 | 25.5 | 2.4 | 26.4 | 2.7 | 27.6 | 2.8 | 29.2 | 3.4 | ||||
| Mean waist circumference (cm) | 84.5 | 6.0 | 91.7 | 5.1 | 95.6 | 5.7 | 100.0 | 6.2 | 106.7 | 8.1 | ||||
| Mean height (m) | 1.74 | 0.1 | 1.74 | 0.1 | 1.74 | 0.1 | 1.74 | 0.1 | 1.74 | 0.1 | ||||
| Mean hip circumference (cm) | 99.6 | 5.8 | 101.9 | 5.5 | 102.8 | 6.0 | 104.2 | 6.3 | 105.4 | 6.9 | ||||
| Mean FEV1‡ (liters) | 3.17 | 0.72 | 3.01 | 0.70 | 2.92 | 0.71 | 2.86 | 0.72 | 2.64 | 0.73 | ||||
| Mean FVC‡ (liters) | 3.92 | 0.95 | 3.70 | 0.90 | 3.57 | 0.87 | 3.54 | 0.88 | 3.25 | 0.86 | ||||
| Cigarette smoking (% and no.)¶ | ||||||||||||||
| Never smoker | 41.9 | 811 | 36.6 | 708 | 33.6 | 651 | 29.4 | 568 | 25.9 | 500 | ||||
| Former smoker | 44.3 | 858 | 51.1 | 988 | 53.8 | 1,044 | 57.6 | 1,113 | 60.1 | 1,162 | ||||
| Current smoker | 13.0 | 252 | 11.5 | 222 | 12.0 | 232 | 12.5 | 241 | 13.2 | 255 | ||||
| Bronchitis/emphysema# (% and no.) | 6.6 | 127 | 8.3 | 160 | 9.3 | 180 | 9.6 | 185 | 10.6 | 204 | ||||
| Asthma# (% and no.) | 6.3 | 121 | 5.5 | 106 | 8.3 | 160 | 7.7 | 149 | 10.1 | 1.94 | ||||
| Social classes IV and V** (% and no.) | 39.1 | 756 | 42.0 | 813 | 42.6 | 825 | 45.2 | 873 | 46.7 | 903 | ||||
| Sedentary lifestyle†† (% and no.) | 20.7 | 401 | 22.9 | 443 | 28.0 | 542 | 30.5 | 589 | 38.1 | 736 | ||||
| Women | ||||||||||||||
| No. of participants | 2,384 | 2,377 | 2,371 | 2,370 | 2,374 | |||||||||
| Mean waist:hip ratio | 0.713 | 0.022 | 0.757 | 0.010 | 0.788 | 0.009 | 0.823 | 0.012 | 0.885 | 0.040 | ||||
| Mean body mass index | 24.0 | 3.4 | 25.0 | 3.4 | 26.2 | 3.9 | 27.3 | 4.2 | 29.0 | 4.6 | ||||
| Mean waist circumference (cm) | 71.9 | 5.9 | 76.9 | 6.2 | 81.5 | 7.1 | 86.2 | 7.8 | 94.3 | 9.9 | ||||
| Mean height (m) | 1.62 | 0.1 | 1.61 | 0.1 | 1.61 | 0.1 | 1.60 | 0.1 | 1.60 | 0.1 | ||||
| Mean hip circumference (cm) | 100.9 | 7.8 | 101.6 | 8.0 | 103.4 | 8.9 | 104.8 | 9.3 | 106.5 | 10.2 | ||||
| Mean FEV1 (liters) | 2.32 | 0.48 | 2.21 | 0.51 | 2.14 | 0.50 | 2.04 | 0.51 | 1.92 | 0.50 | ||||
| Mean FVC (liters) | 2.80 | 0.62 | 2.68 | 0.62 | 2.60 | 0.61 | 2.47 | 0.61 | 2.32 | 0.59 | ||||
| Cigarette smoking (% and no.)¶ | ||||||||||||||
| Never smoker | 61.3 | 1,461 | 58.5 | 1,390 | 54.8 | 1,299 | 54.6 | 1,295 | 51.1 | 1,212 | ||||
| Former smoker | 28.3 | 675 | 29.2 | 695 | 33.0 | 782 | 32.4 | 769 | 35.2 | 836 | ||||
| Current smoker | 9.6 | 228 | 11.4 | 270 | 11.3 | 269 | 11.7 | 277 | 12.5 | 296 | ||||
| Bronchitis/emphysema# (% and no.) | 8.6 | 205 | 8.8 | 208 | 9.1 | 216 | 10.0 | 236 | 10.9 | 258 | ||||
| Asthma# (% and no.) | 6.8 | 163 | 7.0 | 166 | 8.6 | 204 | 10.7 | 254 | 10.8 | 255 | ||||
| Social classes IV and V** (% and no.) | 35.8 | 853 | 39.5 | 938 | 40.3 | 956 | 43.3 | 1,027 | 45.5 | 1,081 | ||||
| Sedentary lifestyle†† (% and no.) | 21.0 | 501 | 23.9 | 568 | 27.6 | 654 | 31.9 | 757 | 36.9 | 875 | ||||
* Data are presented as mean values and standard deviations unless otherwise noted.
† Estimated ranges of values for waist:hip ratio quintiles were <0.882, 0.882–0.916, 0.916–0.944, 0.944–0.977, and >0.977 in men and <0.740, 0.740–0.773, 0.773–0.804, 0.804–0.844, and >0.844 in women.
‡ Q, quintile; SD, standard deviation; FEV1, forced expiratory volume in 1 second; FVC, forced vital capacity.
§ Weight (kg)/height (m)2.
¶ Percentages for cigarette smoking may not sum to 100% because of missing data.
# Self-reported doctor-diagnosed condition.
** “Partly skilled” (IV) and “unskilled” (V).
†† Physical activity index level I.
Change in respiratory function for every 0.05-unit increase in waist:hip ratio among 9,674 men and 11,876 women aged 45–79 years without prevalent heart disease, stroke, or cancer, European Prospective Investigation into Cancer and Nutrition–Norfolk, United Kingdom, 1993–1997
| Regression model | Forced expiratory volume in 1 second (ml) | Forced vital capacity (ml) | |||
| β | 95% CI* | β | 95% CI | ||
| Men (n = 9,674) | |||||
| Unadjusted | –148.1 | –160.1, –136.2 | –184.4 | –199.4, –169.5 | |
| Adjusted for age | –85.0 | –95.5, –74.6 | –121.4 | –135.3, –107.5 | |
| Adjusted for age and height | –87.2 | –97.0, –77.4 | –124.5 | –137.4, –111.6 | |
| Adjusted for age, height, and BMI*,† | –107.5 | –119.5, –95.6 | –136.5 | –152.2, –120.8 | |
| Adjusted for age, height, BMI, and physical activity index | –105.7 | –117.6, –93.8 | –134.3 | –150.0, –118.5 | |
| Adjusted for covariates‡ | –83.3 | –94.7, –71.8 | –113.2 | –128.7, –97.6 | |
| Nonobese persons only (BMI <30)‡ (n = 8,388) | –90.7 | –103.2, –78.1 | –125.1 | 142.3, 107.9 | |
| Non-current smokers, no respiratory symptoms§ (n = 7,261) | –76.8 | –89.9, –63.7 | –110.5 | –128.4, –92.7 | |
| Women (n = 11,876) | |||||
| Unadjusted | –111.0 | –118.1, –103.8 | –137.8 | –146.6, –129.0 | |
| Adjusted for age | –43.2 | –49.6, –36.8 | –69.2 | –77.6, –60.9 | |
| Adjusted for age and height | –37.8 | –43.8, –31.7 | –61.7 | –69.5, –54.0 | |
| Adjusted for age, height and BMI | –32.8 | –39.4, –26.3 | –49.6 | –58.0, –41.1 | |
| Adjusted for age, height, BMI, and physical activity index | –32.2 | –38.8, –25.7 | –48.8 | –57.2, –40.4 | |
| Adjusted for covariates‡ | –24.1 | –30.6, –17.6 | –40.9 | –49.3, –32.5 | |
| Nonobese persons only (BMI <30)‡ (n = 9,856) | –25.1 | –32.6, –17.7 | –41.8 | –51.5, –32.1 | |
| Non-current smokers, no respiratory symptoms§ (n = 8,886) | –19.1 | –26.3, –11.9 | –34.7 | –44.2, –25.2 | |
* CI, confidence interval; BMI, body mass index.
† Weight (kg)/height (m)2.
‡ Adjusted for age, body mass index, height, cigarette smoking (never, former, current), physical activity index (I, II, III, IV), prevalent bronchitis/emphysema (yes vs. no), prevalent asthma (yes vs. no), and social class (I, II, IIIa, IIIb, IV, V).
§ As in the original multivariate model, but categories for smoking were former and never smokers, and terms for prevalent bronchitis/emphysema and prevalent asthma were excluded.
Change in respiratory function for every one-quintile increase* in waist:hip ratio, body mass index, or waist circumference among 9,674 men and 11,876 women aged 45–79 years without prevalent heart disease, stroke, or cancer, European Prospective Investigation into Cancer and Nutrition–Norfolk, United Kingdom, 1993–1997
| Regression model† | Adjusted for age | Adjusted for age and height | |||
| β | 95% CI‡ | β | 95% CI | ||
| Forced expiratory volume in 1 second (ml) | |||||
| Men (n = 9,674) | |||||
| Model 1: Waist:hip ratio | –70.0 | –76.7, –59.2 | –70.3 | –78.5, –62.0 | |
| Model 2: Body mass index | –25.0 | –33.7, –16.3 | –20.2 | –28.4, –12.0 | |
| Model 3: Waist circumference | –23.0 | –31.8, –14.3 | –57.5 | –65.8, –49.1 | |
| Model 4: | |||||
| Waist:hip ratio | –76.9 | –87.4, –66.5 | –84.1 | –93.9, –74.3 | |
| Body mass index | 16.2 | 5.9, 26.5 | 24.9 | 15.5, 34.5 | |
| Model 5: | |||||
| Waist circumference | –8.7 | –22.9, 5.5 | –120.3 | –134.6, –106.1 | |
| Body mass index | –18.2 | –32.4, –4.0 | 75.5 | 61.6, 89.4 | |
| Women (n = 11,876) | |||||
| Model 1: Waist:hip ratio | –34.9 | –40.6, –29.2 | –29.7 | –35.1, –24.4 | |
| Model 2: Body mass index | –27.9 | –33.3, –22.4 | –17.9 | –23.1, –12.8 | |
| Model 3: Waist circumference | –23.1 | –28.7, –17.6 | –33.5 | –38.7, –28.3 | |
| Model 4: | |||||
| Waist:hip ratio | –27.7 | –33.9, –21.5 | –26.5 | –32.3, –20.7 | |
| Body mass index | –17.3 | –23.2, –11.3 | –7.8 | –13.4, –2.2 | |
| Model 5: | |||||
| Waist circumference | –2.3 | –11.3, 6.8 | –53.2 | –62.0, –44.5 | |
| Body mass index | –26.1 | –35.0, –11.2 | 24.3 | 15.7, 32.9 | |
| Forced vital capacity (ml) | |||||
| Men (n = 9,674) | |||||
| Model 1: Waist:hip ratio | –99.3 | –111.0, –87.8 | –102.6 | –113.4, –91.7 | |
| Model 2: Body mass index | –52.1 | –63.7, –40.4 | –45.2 | –56.0, –34.4 | |
| Model 3: Waist circumference | –32.1 | –43.8, –20.5 | –81.3 | –92.2, –70.3 | |
| Model 4: | |||||
| Waist:hip ratio | –100.1 | –114.1, –86.2 | –110.3 | –123.2, –97.4 | |
| Body mass index | 1.6 | –12.1, 15.3 | 14.0 | 1.3, 26.7 | |
| Model 5: | |||||
| Waist circumference | 23.7 | 4.8, 42.6 | –129.1 | –147.9, –110.2 | |
| Body mass index | –70.7 | –89.6, –51.9 | 57.4 | 39.0, 75.8 | |
| Women (n = 11,876) | |||||
| Model 1: Waist:hip ratio | –57.4 | –64.8, –50.0 | –50.3 | –57.2, –43.4 | |
| Model 2: Body mass index | –53.6 | –60.6, –46.5 | –39.9 | –46.5, –33.3 | |
| Model 3: Waist circumference | –39.6 | –46.8, –32.4 | –53.9 | –60.6, –47.2 | |
| Model 4: | |||||
| Waist:hip ratio | –41.8 | –49.8, –33.8 | –40.2 | –47.6, –32.7 | |
| Body mass index | –37.5 | –45.2, –29.8 | –24.6 | –31.7, –17.4 | |
| Model 5: | |||||
| Waist circumference | –8.5 | –31.8, 20.2 | –60.5 | –71.7, –49.2 | |
| Body mass index | –60.2 | –71.7, –48.6 | 8.0 | –3.1, 19.1 | |
* Approximate quintile changes—waist:hip ratio: 0.039 in men and 0.041 in women; body mass index (weight (kg)/height (m)2): 2.2 in men and 2.7 in women; waist circumference: 6.3 cm in men and 6.9 cm in women. All obesity indices were treated as categorical variables.
† Models 1–3 used waist:hip ratio, body mass index, and waist circumference as variables in separate models; models 4 and 5 used body mass index in the same model with waist:hip ratio (model 4) or waist circumference (model 5).
‡ CI, confidence interval.
References
Kannel WB, Hubert H, Lew EA. Vital capacity as a predictor of cardiovascular disease: The Framingham Study.
Ebi-Kryston KL. Respiratory symptoms and pulmonary function as predictors of 10-year mortality from respiratory disease, cardiovascular disease, and all causes in the Whitehall Study.
Krzyzanowski M, Wysocki M. The relation of thirteen-year mortality to ventilatory impairment and other respiratory symptoms: The Cracow Study.
Ebi-Kryston KL, Hawthorne VM, Rose G, et al. Breathlessness, chronic bronchitis and reduced pulmonary function as predictors of cardiovascular disease mortality among men in England, Scotland and the United States.
Persson C, Bengtsson C, Lapidus L, et al. Peak expiratory flow and risk of cardiovascular disease and death: a 12-year follow-up of participants in the population study of women in Gothenburg, Sweden.
Strachan DP. Ventilatory function, height, and mortality among lifelong non-smokers.
Schunemann HJ, Dorn J, Grant BJ, et al. Pulmonary function is a long-term predictor of mortality in the general population: 29-year follow-up of the Buffalo Health Study.
Hole DJ, Watt GC, Davey-Smith G, et al. Impaired lung function and mortality risk in men and women: findings from the Renfrew and Paisley prospective population study.
Tockman MS, Comstock GW. Respiratory risk factors and mortality: longitudinal studies in Washington County, Maryland.
Burchfiel CM, Enright PL, Sharp DS, et al. Factors associated with variations in pulmonary function among elderly Japanese-American men.
Enright PL, Kronmal RA, Higgins MW, et al. Prevalence and correlates of respiratory symptoms and disease in the elderly: Cardiovascular Health Study.
Lange P, Nyboe J, Appleyard M, et al. Spirometric findings and mortality in never-smokers.
Biring MS, Lewis MI, Liu JT, et al. Pulmonary physiologic changes of morbid obesity.
Carey IM, Cook DG, Strachan DP. The effects of adiposity and weight change on forced expiratory volume decline in a longitudinal study of adults.
Kannel WB, Cupples LA, Ramaswami R, et al. Regional obesity and risk of cardiovascular disease: The Framingham Study.
Thomas PS, Cowen ER, Hulands G, et al. Respiratory function in the morbidly obese before and after weight loss.
Chinn DJ, Cotes JE, Reed JW. Longitudinal effects of change in body mass on measurements of ventilatory capacity.
Raison J, Cassuto D, Orvoen-Frija E, et al. Disturbances in respiratory function in obese subjects. In: Ailhaud G, ed. Obesity in Europe ‘91: proceedings of the 3rd Congress on Obesity. London, United Kingdom: John Libbey and Company Ltd, 2001:227–30.
Chen Y, Horne SL, Dosman JA. Body weight and weight gain related to pulmonary function decline in adults: a six year follow up study.
Ray CS, Sue DY, Bray G, et al. Effects of obesity on respiratory function.
Day N, Oakes S, Luben R, et al. EPIC-Norfolk: study design and characteristics of the cohort: European Prospective Investigation of Cancer.
Lazarus R, Gore CJ, Booth M, et al. Effects of body composition and fat distribution on ventilatory function in adults.
Collins LC, Hoberty PD, Walker JF, et al. The effect of body fat distribution on pulmonary function tests.
Lohman T, Roche A, Martorell R. Anthropometric standardization reference manual. Champaign, IL: Human Kinetics Books, 1991.
Cox B, Huppert F, Whichelow M. The Health and Lifestyle Survey: seven years on. Aldershot, United Kingdom: Dartmouth Publishing Company, 1993.
Office of Population Censuses and Surveys and Employment Department Group. Standard occupational classification: structure and definition of major, minor and unit groups. London, United Kingdom: Her Majesty’s Stationery Office, 1990.
Wareham NJ, Jakes RW, Rennie KL, et al. Validity and repeatability of the EPIC-Norfolk Physical Activity Questionnaire.
Quanjer PH, Tammeling GJ, Cotes JE, et al. Lung volumes and forced ventilatory flows. Report Working Party Standardization of Lung Function Tests, European Community for Steel and Coal. Official Statement of the European Respiratory Society.
Barrett-Connor E, Khaw KT. Cigarette smoking and increased central adiposity.
Shimokata H, Muller DC, Andres R. Studies in the distribution of body fat. III. Effects of cigarette smoking.
Troisi RJ, Heinold JW, Vokonas PS, et al. Cigarette smoking, dietary intake, and physical activity: effects on body fat distribution—the Normative Aging Study.
Chen R, Tunstall-Pedoe H, Bolton-Smith C, et al. Association of dietary antioxidants and waist circumference with pulmonary function and airway obstruction.
Bjorntorp P. Abdominal fat distribution and disease: an overview of epidemiological data.
Zerah F, Harf A, Perlemuter L, et al. Effects of obesity on respiratory resistance.
Pankow W, Podszus T, Gutheil T, et al. Expiratory flow limitation and intrinsic positive end-expiratory pressure in obesity.
Rubinstein I, Zamel N, DuBarry L, et al. Airflow limitation in morbidly obese, nonsmoking men.
Henriksen JH, Christensen NJ, Kok-Jensen A, et al. Increased plasma noradrenaline concentration in patients with chronic obstructive lung disease: relation to haemodynamics and blood gases.
Reisin E, Frohlich ED. Obesity: cardiovascular and respiratory pathophysiological alterations.
Fentem PH, Mockett SJ. Physical activity and body composition: what do the national surveys reveal?
Tremblay A, Despres JP, Leblanc C, et al. Effect of intensity of physical activity on body fatness and fat distribution.
Eriksson BO, Engstrom I, Karlberg P, et al. Long-term effect of previous swimtraining in girls: a 10-year follow-up of the “girl swimmers.”
Gaultier C, Crapo R. Effects of nutrition, growth hormone disturbances, training, altitude and sleep on lung volumes.
Twisk JW, Staal BJ, Brinkman MN, et al. Tracking of lung function parameters and the longitudinal relationship with lifestyle.
Jakes RW, Day NE, Patel B, et al. Physical inactivity is associated with lower forced expiratory volume in 1 second: European Prospective Investigation into Cancer-Norfolk Prospective Population Study.
Leith DE, Bradley M. Ventilatory muscle strength and endurance training.

