


Abstract
older adults with total knee arthroplasty (TKA) frequently undergo rehabilitation to address limited knee flexion range-of-motion, quadriceps weakness and gait speed limitations. This study aimed to develop age- and sex-specific recovery curves of knee flexion range-of-motion, quadriceps strength and fast gait speed post-TKA.
a population-based sample of 2,987 patients undergoing primary TKA participated, of whom 2015 (68%) were 65 years of age or older. At 4, 8 and 12 weeks post surgery, knee flexion range-of-motion, quadriceps strength and fast gait speed were quantified. Quantile regression was used to determine the percentiles of the knee and gait measures.
the various knee and gait measures improved nonlinearly over time, with substantial improvements observed in the 1st 8–10 weeks post surgery. Age-specific, sex-specific recovery curves were developed to show the recovery patterns at multiple percentile levels. A web interface was created to facilitate easy computation of the percentile rank for a given outcome value.
we have provided reference percentile values for knee flexion range-of-motion, quadriceps strength and gait speed recovery post-TKA. Such information may assist rehabilitation professionals in interpreting outcomes and quantifying deviations from the expected recovery pattern.
Introduction
Total knee arthroplasty (TKA) is performed primarily on older adults with advanced stages of painful knee osteoarthritis. Following a TKA, patients frequently undergo rehabilitation to address physical impairments and functional limitations such as limited knee flexion range-of-motion, quadriceps weakness and gait speed limitations. To optimize functional recovery, rehabilitation professionals must be able to identify deviations from the expected course of recovery and to provide early intensive rehabilitation for patients at risk for poor long-term functional outcomes. To assist rehabilitation professionals in monitoring outcomes over time, recovery curves of knee range-of-motion, quadriceps strength and gait performance in TKA have been developed in few studies [1–5], including one of ours [2]. However, previous studies have two limitations. First, previous recovery curves generated using linear-mixed and generalized least-squares regression show only a single, average (conditional mean) recovery pattern and whilst useful, they do not fully answer the often-asked and often-challenging clinical question, ‘How am I doing compared to others?’ In contrast, recovery curves generated using quantile regression [6]—analogous to childhood growth curves—show recovery patterns at multiple percentiles (including the median) of the outcome measures, and thus quantify the percentile rank of a given patient score. Second, previous studies were small or had relatively few men (n ranged from 40 [1] to 262 [2]) which precluded the generation of credible age- and sex-based quantile recovery curves [7].
Thus, to complement previous work, our study aimed to describe the time course of knee flexion range-of-motion, quadriceps strength and fast gait speed post-TKA using quantile recovery curves in a population-based sample. Noteworthy, the present study included patients from our previous work [2], which described the average recovery pattern of the knee impairments and gait speed measures in 1,025 patients with TKA.
Methods
Between July 2013 and June 2016, we identified 2987 patients age ≥50 years who underwent a primary unilateral TKA and postoperative outpatient physiotherapy at Singapore General Hospital—the largest tertiary teaching hospital in Singapore which performed half (53%) of all knee arthroplasties in the nation [8]. The SingHealth Centralised Institutional Review Board approved the study.
Outcome measures
At approximately 4, 8 and 12 weeks postoperatively, knee flexion range-of-motion, quadriceps strength and fast gait speed were obtained as part of the (~3–4 months) rehabilitation process. A long-arm goniometer was used to measure active-assisted knee flexion range-of-motion with the patients in supine position. Quadriceps strength was assessed isoinertially[9] using a seated knee extension machine (Cybex VR3, Medway, USA). Given concerns about patellofemoral pain in TKA, the knee range-of-motion for the strength test was set from 90° to 40° of knee flexion. Quadriceps strength was determined using the one repetition maximum test, which is the maximum load the patient could lift once in good form [9]. Rest periods of 30 s were given between trials, and most patients reached their one repetition maximum load between the 3rd and 5th (the maximum number of trials allowed) trials. The one repetition maximum load of the involved quadriceps was recorded in pounds and normalized as a percentage of body weight (%lbs/BW). For the fast gait test, patients stood directly behind the start line and were clocked from the time the 1st foot crossed the start line until the lead foot crossed the 10-m finish line. Patients were instructed to ‘walk as quickly as you can, but safely’ and to finish at least 2 m past the finish line to eliminate the deceleration effects from stopping the walk. Each patient performed a familiarization trial (at a comfortable pace) before the actual trial. Good test–retest reliability for the knee range-of-motion [10], quadriceps strength [9] and gait speed measurements [11] has been demonstrated in previous studies.
Statistical analysis
To generate the recovery curves, we used multivariable quantile regression models [6] to compute the 25th, 50th and 75th percentile estimates of knee flexion, quadriceps strength and fast gait speed. As previous research has shown sex differences in the knee and gait outcomes [1, 2, 4, 5], we estimated the recovery curves in men and women separately. All models included age and time (weeks since TKA) as independent variables. To avoid assuming linearity, we used restricted cubic regression splines [12, 13] with three knots for the variable age in all models, four knots for time in the quadriceps strength model, and three knots for time in all other models. To balance between flexibility and model overfitting, we used the Akaike information criterion to determine the number of knots. To account for data clustering within patients, all model-based standard errors were estimated using cluster bootstrap sampling [6]. In sensitivity analyses, patients who did and did not attend assessment sessions were compared on their preoperative and inpatient postoperative characteristics, and inverse probability weighting [14] was used to account for missing data (see Supplementary data, Appendix, available at Age and Ageing online). Although there was some evidence that the data may not be missing completely at random, the differences in results from the main and sensitivity analyses did not seem extreme. Hence, for simplicity, the quantile regression models remained unchanged. We used the quantreg [15], rms [16] and ggplot2 [17] R packages (http://www.r-project.org) for all analyses and graphing.
Results
Table 1 shows the baseline characteristics of the total sample. All patients were assessed at least once during the three postoperative assessment timepoints, and 64% were assessed at least at two timepoints (see Supplementary data, Appendix, available at Age and Ageing online). Results from quantile regression models suggest that in both sexes, all knee and gait measures improved nonlinearly over time (P < 0.001 for nonlinearity in all outcomes). Specifically, a steep improvement rate was observed in the 1st 8–10 weeks post-TKA, beyond which the improvement over time was more gradual. Figure 1 shows the estimated 25th, 50th and 75th percentiles of all measures for men and women, respectively. For all outcomes, the scores for men were significantly higher than those for women (P < 0.001 in all comparisons).
Demographic and preoperative clinical characteristics of patients by sex
| Variables | Men (N = 768) | Women (N = 2,219) | Overall (N = 2,987) |
|---|---|---|---|
| Age (years) | 61.3 66.7 72.5 | 62.5 67.4 72.9 | 62.0 67.2 72.8 |
| 67.1 ± 7.6 | 67.5 ± 7.3 | 67.4 ± 7.4 | |
| Body weight (kg) | 65 73 82 | 57 64 71 | 59 66 74 |
| 75 ± 13 | 65 ± 12 | 67 ± 13 | |
| BMI (kg/m2) | 24.3 26.7 29.5 | 24.4 27.1 30.2 | 24.3 26.9 30.0 |
| 27.2 ± 4.1 | 27.6 ± 4.7 | 27.5 ± 4.5 | |
| Preop knee flexion (°) | 114 124 132 | 107 120 130 | 108 122 131 |
| 121 ± 15 | 117 ± 18 | 118 ± 18 | |
| Preop SF-36 bodily pain | 22 32 51 | 22 32 42 | 22 32 42 |
| 38 ± 20 | 34 ± 18 | 36 ± 19 | |
| Preop SF-36 physical function | 25 45 60 | 20 35 55 | 20 35 55 |
| 45 ± 24 | 37 ± 22 | 39 ± 23 | |
| Contralateral knee pain | 51% (389) | 59% (1,317) | 57% (1,706) |
| Preop walking aids | |||
| None | 1% (7) | 2% (37) | 1% (44) |
| Stick | 2% (14) | 2% (51) | 2% (65) |
| Quadstick | 81% (620) | 72% (1,598) | 74% (2,218) |
| Frame | 17% (127) | 24% (533) | 22% (660) |
| Hypertension | 68% (520) | 64% (1,418) | 65% (1,938) |
| Diabetes | 24% (186) | 20% (435) | 21% (621) |
| Heart disease | 17% (132) | 9% (204) | 11% (336) |
| Length of stay (days) | 3.0 4.0 5.0 | 3.0 4.0 5.0 | 3.0 4.0 5.0 |
| 4.4 ± 3.0 | 4.5 ± 2.4 | 4.4 ± 2.5 | |
| Walk on day one post-TKA | 79% (610) | 77% (1,714) | 78% (2,324) |
| Able to perform a SLR on the day of hospital discharge | 90% (693) | 87% (1,936) | 88% (2,629) |
Continuous variables are summarized as 25th 50th 75th percentiles and mean ± SD.
Categorical variables are summarized as percentages and frequencies (n).
SLR = straight leg raise. The bold values are the median value for continuous variables.
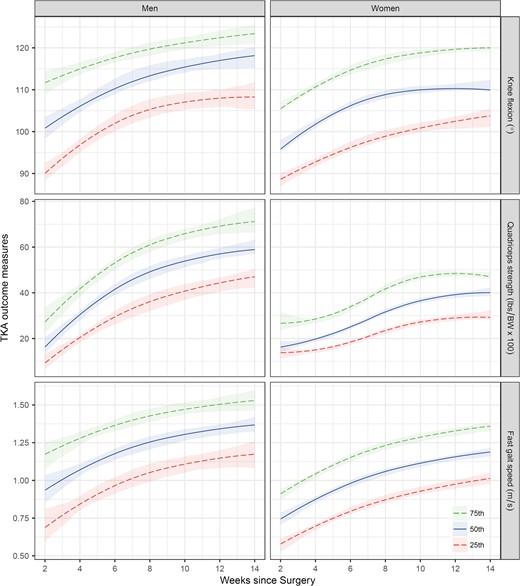
Recovery curves of knee flexion range-of-motion (top panel), body-weight adjusted quadriceps strength (middle panel), and fast gait speed (bottom panel) for men (left panel) and women (right panel). The 25th (bottom long-dashed line), 50th (middle solid line) and 75th (top long-dashed line) percentile values (with 95% confidence intervals) were predicted for age 65 years by the quantile regression models. BW = body weight.
To facilitate results interpretation, we have developed an interactive, web-based Shiny ‘app’ [18] (https://sgh-physio.shinyapps.io/atomic/). With the app, users can visualize the age- and sex-specific recovery curves, estimate the percentile rank for a given outcome value, and download the results.
Discussion
In a population-based sample of 2,987 patients with TKA, we have developed age- and sex-based recovery curves for knee flexion range-of-motion, quadriceps strength and gait speed to potentially assist rehabilitation professionals in monitoring deviations from the average (conditional median) recovery course. Similar to previous studies [1–5], these recovery curves indicate that the greatest improvement for the various outcomes occurred within the 1st 2–3 months post-TKA. For example, Stratford et al. [3] showed in 72 patients with TKA that knee flexion range-of-motion improved rapidly during the 1st 12 weeks post arthroplasty and plateaued at a mean of 114°. Our recovery curves (based on the median values) compared well with these observations.
Different from previous work, however, the quantile recovery curves from this study provide information beyond the average recovery pattern. When confronted with the question ‘How am I doing compared to others?’ the rehabilitation professional could use the recovery curves to quantify the patient’s progress in terms of percentile values. Because there are (i) multiple recovery curves derived from the various combinations of age and sex and (ii) multiple percentiles curves to be clearly displayed on a single recovery curve, we have developed an app which (i) constructs the age- and sex-specific recovery curves and (ii) computes the percentile rank for a given outcome value. By creating recovery curves on-the-fly and providing greater granularity, the app could potentially reduce the time burden associated with interpreting and analysing patient outcomes—a major barrier to routine outcome assessment in clinical practice [19].
Our study has limitations. First, our recovery curves described the time course of the various outcomes in the acute post-TKA phase and thus, did not reveal the full trajectory. This is particularly so for the fast-gait-speed recovery curves which did not stabilize asymptotically (Figure 1). Second, as also reported in similar previous studies [4, 5], our missing data rate increased over time, with patients with lower physical function more likely to have missing data. Nonetheless, our findings compare relatively well with those from previous studies and sensitivity analysis also did not appreciably alter the results. Third, the 95% confidence intervals of the recovery curves were wider (indicating less precision) for men and at the more extreme percentiles, because of the relatively smaller numbers. Hence, caution must be exercised when interpreting the results. Fourth, we studied an Asian sample so the extent to which our results may apply to non-Asians is unknown. Nonetheless, as this study shows the potential utility of quantile recovery curves and interactive web applications in TKA outcome assessment, we hope it will encourage similar work in other racial/ethnic groups. (The relevant R codes are available on request from the 1st author.)
Conclusion
In a population-based sample that included patients from our previous work [2], we have provided reference percentile values for knee flexion range-of-motion, quadriceps strength and gait speed recovery post-TKA. The recovery curves and web-based app developed from this study could potentially be used to aid clinical judgement and practice by (i) providing timely warnings of deviations from the average recovery course, (ii) fostering patient communication and engagement with rehabilitation and (iii) facilitating outcome assessment in the busy clinical setting.
A common question that confronts healthcare providers who manage patients with total knee arthroplasty is: ‘How am I doing compared to others?’
We have developed recovery curves to assist healthcare providers in monitoring deviations from the average recovery course.
We have also developed an app that would potentially reduce the time burden of results analysis and interpretation.
Supplementary data
Supplementary data mentioned in the text are available to subscribers in Age and Ageing online.
Acknowledgements
We thank William Yeo from the Orthopaedic Diagnostic Centre, Singapore General Hospital, for supporting the study. We also thank Felicia Seet, Nai-Hong Chan and the therapy assistants (Jo Ann Sebarrotin, Penny Teh, Hamidah Binti Hanib, Bamgbang Heryanto and Shela Devi D/o Perumal) for their kind assistance.
Contributions
All authors were involved in study conception and design. F.J.T.S., C.L.L.P., J.W.M.T. and H.C.C. obtained the data. Y.H.P., F.J.T.S. and H.C.C. extracted data. Y.H.P. analyzed the data and developed the app. All authors were involved in data interpretation. Y.H.P. wrote the 1st draft of the article. All authors revised the artile and gave final approval for submission.
Conflict of interest
The authors report no conflicts of interest.
Funding
This study was supported financially by the Singapore General Hospital Centre Grant (Bioengineering Core) from the National Medical Research Council, Singapore (ref: NMRC/CG/016/2013). The study funders were not involved in the study.
References
Singapore Ministry of Health: Knee Replacement Surgery. https://www.moh.gov.sg/content/moh_web/home/costs_and_financing/hospital-charges/Total-Hospital-Bills-By-condition-procedure/knee_replacementsurgery.html (21 september 2016, date last accessed).

Comments