


Abstract
Owing to the frequency and reproducibility of its outbursts, the black hole candidate GX 339–4 has become the standard against which the outbursts of other black hole candidate are matched up. Here we present the first systematic study of the evolution of the X-ray lags of the broad-band variability component (0.008–5 Hz) in GX 339−4 as a function of the position of the source in the hardness–intensity diagram. The hard photons always lag the soft ones, consistent with previous results. In the low-hard state the lags correlate with X-ray intensity, and as the source starts the transition to the intermediate/soft states, the lags first increase faster, and then appear to reach a maximum, although the exact evolution depends on the outburst and the energy band used to calculate the lags. The time of the maximum of the lags appears to coincide with a sudden drop of the optical/near-infrared flux, the fractional rms amplitude of the broad-band component in the power spectrum, and the appearance of a thermal component in the X-ray spectra, strongly suggesting that the lags can be very useful to understand the physical changes that GX 339–4 undergoes during an outburst. We find strong evidence for a connection between the evolution of the cut-off energy of the hard component in the energy spectrum and the phase lags, suggesting that the average magnitude of the lags is correlated with the properties of the corona/jet rather than those of the disc. Finally, we show that the lags in GX 339–4 evolve in a similar manner to those of the black hole candidate Cygnus X–1, suggesting similar phenomena could be observable in other black hole systems.
INTRODUCTION
The X-ray spectrum of black hole candidate (BHC) systems in low-mass X-ray binaries (LMXBs) can be decomposed into two main components (e.g. Tanaka 1989; van der Klis 1994): a hard component, usually fitted with a power law with photon index in the range 1.4–2.5 (e.g. Thorne & Price 1975; Sunyaev et al. 1991; Grebenev et al. 1993), and a soft, thermal, blackbody-like component with temperature kT ∼ 0.5–2 keV (e.g. Mitsuda et al. 1984; Miyamoto et al. 1993). The hard component is usually attributed to a corona of energetic electrons, and the state where it dominates is known as the low-hard state (LHS). The soft component is attributed to thermal emission from an optically thick but geometrically-thin accretion disc (Shakura & Sunyaev 1973); when the soft component dominates the emission, the source is in the so-called high-soft state (HSS).
Any description of the spectral evolution during an outburst based on spectral fittings is of course model dependent; therefore, many authors have opted for using X-ray colours (also known as hardness); these colours are defined as the ratio between count rates in different bands, and have proven to be very useful to understand the spectral evolution of outbursts in terms of the dominating component of the spectrum. For BHCs, the hardness–intensity diagram (HID) is generally used to characterize the spectral properties of a source. In what is now known as ‘canonical outburst’, the source evolves in a roughly square pattern in the HID (e.g. Homan et al. 2001; Belloni et al. 2005, among many others). First, the intensity of the source increases by a large factor while the hardness slightly decreases. The source is in the LHS and traces a roughly vertical line in the HID. At some point the source ‘turns the corner’: the intensity stops increasing and the source spectrum softens at more or less constant intensity towards the HSS. In between the LHS and HSS the source passes through the hard- and soft-intermediate states (see e.g. Homan & Belloni 2005), showing complex behaviour including sometimes large flares in intensity. After the source reaches the HSS, the intensity usually decreases at approximately constant hardness, with some excursions to harder or softer states; as the outburst progresses, the source returns to the LHS at approximately constant intensity. The hardening of the spectra continues until the hard colour returns to a value similar to those observed at the beginning of the outburst. At this point the hardening stops, the intensity drops and the source returns to quiescence.
While the detailed evolution of BHC outbursts can be more complex than what we have just described, change slightly from source to source, or in different outbursts of the same source (see e.g. Homan et al. 2001; Belloni et al. 2005; Homan & Belloni 2005; Remillard & McClintock 2006; van der Klis 2006, and references therein), the loop in the HID is usually recognizable. This ‘q-shaped’ loop is usually discussed in terms of hysteresis (e.g. Miyamoto et al. 1995), and has been known for a long time (e.g. Homan et al. 2001; Maccarone & Coppi 2003). We note however, that although we describe this hysteresis effect only in the case of BHs in LMXBs, similar loops can be seen in HIDs and/or colour–colour diagrams of other accreting objects (e.g. neutron stars and dwarf novae; see e.g. Maccarone & Coppi 2003; Körding et al. 2008), therefore pointing at a similar physical origin. The accretion physics behind the ‘q’ shape in the HID of black holes (BHs), and what produces the corners is not fully understood (but see e.g. proposed scenarios by Meyer-Hofmeister, Liu & Meyer 2005; Petrucci et al. 2008; Begelman & Armitage 2014; Kylafis & Belloni 2015, and references therein); however, it is probably related to significant changes in the geometrical/structural configuration of the system triggered by changes in mass accretion rate (|$\dot{M}$|). For example, there is clear evidence that the ejection of relativistic jets takes place during some of the transitions between the states described above (e.g. Vadawale et al. 2003; Corbel et al. 2004; Fender & Belloni 2004).
To fully describe the evolution of a BH outburst, it is essential to consider the X-ray (time) variability. The power spectra of the LHS and hard-intermediate state (e.g. Méndez & van der Klis 1997; Belloni et al. 2005) are dominated by a strong band-limited noise component that can reach fractional rms amplitudes of up to ∼50 per cent (see Oda et al. 1971; Belloni et al. 1997; Méndez & van der Klis 1997; van der Klis 2006, and references therein). Sometimes, low-frequency quasi-periodic oscillations (QPOs) are observed with frequencies in the range of ∼10−3–20 Hz. The characteristic frequencies (Belloni, Psaltis & van der Klis 2002) of these QPOs and noise components are found to correlate (e.g. Psaltis, Belloni & van der Klis 1999; Wijnands & van der Klis 1999; Belloni et al. 2002), generally increasing towards softer states. The soft-intermediate state shows no strong band-limited noise component (e.g. Oda et al. 1976; Homan et al. 2001; Homan & Belloni 2005), and transient QPOs appear with frequencies that are rather stable (e.g. Casella et al. 2004; Casella, Belloni & Stella 2005). In the HSS, only weak power-law noise is observed in the power spectrum and sometimes a QPO with frequency in the range 10–20 Hz (see e.g. the HSS of XTE J1550–564; Homan et al. 2001). Overall, the most common QPOs in BHCs have been classified based on their characteristics as Type-A, B and C, and are usually associated with different states (e.g. Casella et al. 2005).
One important aspect of the variability of any astrophysical signal is the possible phase lag between measurements in two different energy bands (e.g. Priedhorsky et al. 1979; Nowak et al. 1999). The phase lag is a Fourier-frequency-dependent measure of the phase delay between two concurrent and correlated signals, in this case light curves of the same source, in two different energy bands. The phase-lag spectrum of the broad-band noise component in the power density spectrum (PDS) of BH systems (Miyamoto et al. 1988; Nowak et al. 1999) were first interpreted as due to soft disc photons that are Compton up-scattered in a corona of hot electrons that surrounds the system (see e.g. Thorne & Price 1975; Hua, Kazanas & Titarchuk 1997; Kazanas, Hua & Titarchuk 1997, however, see e.g. Nowak et al. 1999; Maccarone, Coppi & Poutanen 2000; Poutanen 2001; Arévalo & Uttley 2006; Uttley et al. 2011 for problems with this interpretation). Phase lags from QPOs and the broad-band noise have been relatively well studied in the LHS of a few sources, but using only a handful of observations (e.g. van der Klis et al. 1987; Ford et al. 1999; Nowak et al. 1999; Wijnands, Homan & van der Klis 1999; Cui, Zhang & Chen 2000; Reig et al. 2000; Méndez et al. 2013). If the geometry of the system changes significantly during an outburst, one would naturally expect that the phase lags between soft and hard photons will change as a function of the position of the source in the HID. To our knowledge, only the lags of the persistent (and somewhat special) BH system Cygnus X-1 have been studied in detail, taking advantage of the full Rossi X-ray Timing Explorer (RXTE) archive. As expected, the lags change as a function of the position of the source in the HID (see e.g. Grinberg et al. 2014, and references therein).
In this paper, we present the first multi-outburst study of the time lags of the low-frequency variability for a transient BHC LMXB. For this exploratory work, we chose the BHC GX 339–4, as evidence for lag evolution has been reported for the 2002/2003 outburst (see fig. 5 in Belloni et al. 2005). GX 339–4 is probably one of the best studied BHC sources today (e.g. Méndez & van der Klis 1997; Homan et al. 2005; Coriat et al. 2009; Motta et al. 2011; Buxton et al. 2012; Rahoui et al. 2012; Corbel et al. 2013, and references therein), and its outbursts are considered as representative of the BH population (e.g. Belloni et al. 2005; van der Klis 2006).
OBSERVATIONS AND DATA ANALYSIS
We used all the 1414 pointed RXTE observations of GX 339–4 available in the HEASARC archive. In particular for this study, we used data taken with the Proportional Counter Array (PCA; Zhang et al. 1993; Jahoda et al. 2006) over a time span of ∼14 yr. To calculate X-ray colours and intensity, we used the 16-s time resolution Standard 2 mode data and the procedure described in Altamirano et al. (2008): for each of the five PCA (Proportional Counter Units, PCUs) detectors we calculated a hard colour defined as the count rate in the 16.0–20.0 keV band divided by the count rate in the 2.0–6.0 keV band. We defined the intensity as the count rate in the 2.0–20 keV band. Count rates in these exact energy ranges were obtained by interpolating between PCU channels. We corrected the data for dead-time, subtracted the background contribution in each band using the standard bright source background model for the PCA, version 2.1e,1 and removed instrumental drop-outs. In order to correct for instrumental gain changes (see Jahoda et al. 2006), we normalized all count rates by those of the Crab nebula, obtained in the same energy range, same gain epoch and using the Crab observations closest in time to those of each GX 339–4 observation. For each observation, we then calculated colours and intensity for each 16-s interval, and we averaged the colours and intensity over all PCUs. Finally, we averaged the 16-s colours per observation.
For the timing analysis we used data from the PCA Event, Good Xenon and Single Bit modes. We calculated Leahy-normalized PDS using all photons in the PCA bandpass for data segments of 128 s at the maximum time resolution available (except in the case of Good Xenon mode, where we binned the data to a resolution of 1/8192 s). No background or deadtime corrections were applied to the data prior to the calculation of the PDS. We subtracted a Poisson noise spectrum that includes the effect of deadtime based on the analytical function of Zhang et al. (1995), and then converted the resulting PDS to squared fractional rms (van der Klis 1995).
For each observation we also computed the complex Fourier transform separately for all photons in the absolute channel bands 0–13, 14–35 and 36–80; in the rest of this paper we refer to these bands as soft, H1 and H2, respectively. These bands correspond to approximately the energy ranges 2–5.7 keV, 5.7–15 keV and 15–34 keV, respectively, and were selected in order to maximize the number of observations where we could use the exact same channel bands. While we used always the same channel-ranges, the corresponding energy-ranges varied slightly in time due to the instrumental gain changes (Jahoda et al. 2006). We estimated that those variations affect the lags by less than ∼10 per cent. We calculated average cross-spectra using the soft band as the reference band, and following the description in Vaughan & Nowak (1997) and Nowak et al. (1999), we calculated the phase lags as a function of Fourier frequency for each of the cross-spectra. We use the nomenclature H1 and H2 as well to refer to the lags between photons in the H1 or H2 bands, respectively, relative to the photons in the soft band. Given our convention, positive lags means that hard X-ray photons lag the soft ones.
A visual inspection of our data indicates that the shape of the phase-lag spectra is complex and dependent on the observation. One could divide each lag spectrum into different components, as it is commonly done for the power spectra of these same observations (generally in the form of multi-Lorentzian model, see e.g. Nowak 2000; Belloni et al. 2002). However, the quality of the lag-spectra does not always allow us to differentiate between components; therefore, as a first approach, in this paper we study the evolution of the frequency-averaged 0.008–5 Hz phase lag.2 This type of analysis is analogous to those works where the relation between average fractional rms amplitude of the power spectra of BHs (and also NS) is studied as a function of the spectral state of a source (e.g. Belloni et al. 2005; Fender, Homan & Belloni 2009; Motta et al. 2011; Muñoz-Darias, Motta & Belloni 2011a; Stiele et al. 2011). A possible multicomponent description of the phase-lag spectrum will be discussed in a separate paper.
Deadtime-driven cross-talk between different energy channels induces a ± π phase lag in the Poisson-noise-dominated part of the PDS (van der Klis et al. 1987). To correct for this, we subtracted the cross-spectrum in a frequency range well above that of the broad-band noise (200–1000 Hz), in which the X-ray variability is dominated by Poisson noise. We inspected and confirmed that, as expected, the cross-spectrum in this frequency range has no significant imaginary part; hence, this procedure has no effect on the sign of the phase lags (see van der Klis et al. 1987, for more details). Unless stated explicitly, quoted errors use Δχ2 = 1.0.
Throughout the paper we give phase lags in units of rad/2π (cycles) and we do not report on time lags (defined as phase lag divided by the frequency ν), as the frequency range we use (0.008–5 Hz) spans nearly a factor ∼600 so the average time lag will strongly depend on the binning used (e.g. linear or logarithmic), and can be strongly biased by the lags at frequencies lower than 1 Hz. The average phase lag measurements we report here can be used to calculate time lags at a given frequency to a first-order approximation.
RESULTS
We were able to measure the phase lags in the three bands defined in Section 2 in 1362 out of the 1414 observations available in the archive. Approximately 1020 out of these 1362 observations sample four complete outbursts of GX 339–4 that showed the canonical full loop in the HID; the HIDs of the four outbursts studied here are plotted in Fig. 1. As described in Section 1 (and in previous works e.g. Belloni et al. 2005; Motta et al. 2011, and references therein) and shown in Fig. 1, the outbursts of GX 339–4 evolve in an anticlockwise ‘q-shaped’ form.
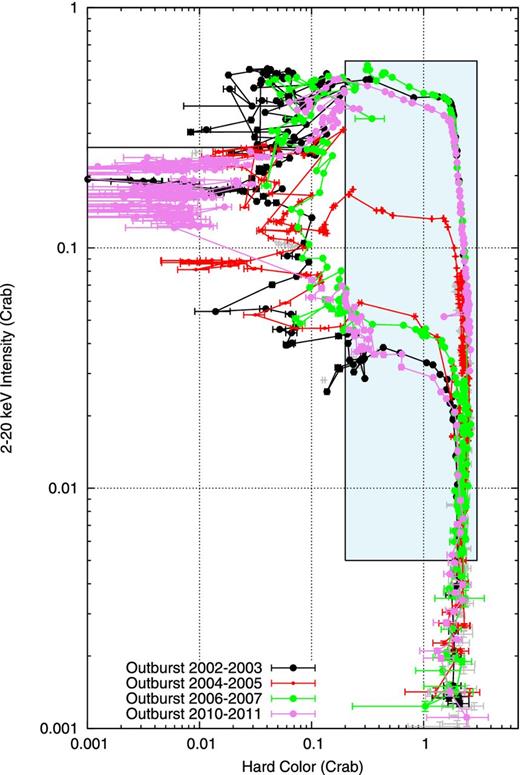
HID of the four best sampled outbursts of the BH GX 339–4. Hard colour is defined as the count rate in the 16.0–20.0 keV band divided by the count rate in the 2.0–6.0 keV band. Intensity is the count rate in the 2.0–20 keV band. Both the hard colour and the intensity are normalized by the Crab (see Section 2 for more details). The four different outbursts are plotted using different colours (see the legend). Note that for the 2004–2005 outburst (red points) the hard-to-soft transition happened at a much lower (factor of ∼ 5) intensity than for the other three outbursts. For the other three outbursts the transition occurred at approximately the same intensity. The rectangular shaded area shows the part of the outbursts that we used in the rest of the paper (see Fig. 2). The few grey points in this plot indicate observations in which the source was in the HSS, which we did not analyse in this paper (see Section 2).
In panel A of Fig. 2, we show a portion of the HID of these four outbursts. For each outburst the grey points show the full outburst, while we indicate the rising part of each outburst (hard colour >0.2) with the black, red, green and violet points for the 2002–2003, 2004–2005, 2006–2007 and 2010–2011 outbursts, respectively. The transitions between the hard and the soft state are well sampled with RXTE observations, except for the 2002–2003 outburst (black), in which the hard-to-soft transition was sampled by only five to six observations. In panels B and C of Fig. 2 , we plot the source intensity versus the 0.008–5 Hz phase lags for the H1 and H2 bands, respectively; in both cases, we use the soft band as reference. We will refer to these plots as the (phase-)lag–intensity diagrams, LID.
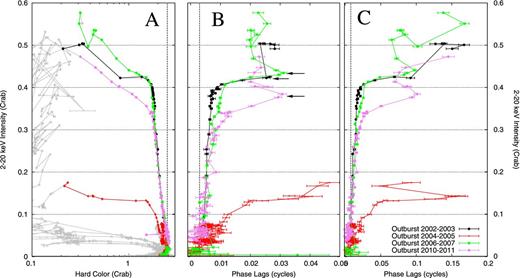
Panel A shows a portion (see the shaded area in Fig. 1) of the full HID of the four best sampled outbursts of the BH GX 339–4 with RXTE. Grey points indicate observations which were not studied in this paper (see Section 3). The black, red, green and violet points indicate the part of the four outburst (see text for details, and the legend for the identification of each outburst) for which we studied the lags. Hard colour is defined as the count rate in the 16.0–20.0 keV band divided by the count rate in the 2.0–6.0 keV band. Intensity is the count rate in the 2.0–20 keV band. Both the hard colour and the intensity are normalized by the Crab (see Section 2 and Fig. 1 for more details) The hard-to-soft transition during the 2004–2005 (red) outburst took place at an intensity that is a factor ∼5 lower than in the other three outbursts. Panels B and C show the phase-lag–intensity diagram (LID) for the H1 (≃5.7–15 keV) and H2 bands (≃16–35 keV), respectively. The lags correspond to the average phase lag divided by 2π in the 0.008–5 Hz frequency range using as reference the soft band (≃2–5.7 keV). Horizontal arrows in panel B mark the moment where the lags stop increasing with intensity (see Section 3 for more details). The vertical dashed-lines show that, as GX 339–4 becomes brighter in each outburst, the spectrum becomes softer (panel A) and the lags increase (panels B and C). The horizontal dotted-lines are shown to help the eye link the evolution of the lags as a function of the position of the source in the HID. In all panels, each point corresponds to the average value calculated from a full RXTE observation.
For the three brightest outbursts, panel B in Fig. 2 shows that the evolution of the H1 lags can be divided into three intervals: initially, the lags show a slow, but significant, increase with intensity until the source ‘turns the corner’ in the HID; at that point the lags start to increase at a much higher rate with intensity. Finally, the lags appear to reach a maximum at ∼0.03 cycles, decrease to 0.020–0.025 cycles, and remain approximately constant with intensity. After this point, we can no longer measure the lags in single observations, or the source starts undergoing fast state transitions. For the sake of clarity, this more complex behaviour will be presented in a follow-up paper. In Fig. 3 we show representative phase lag and power spectra and in Fig. 4 their location in the HID and LID diagrams.
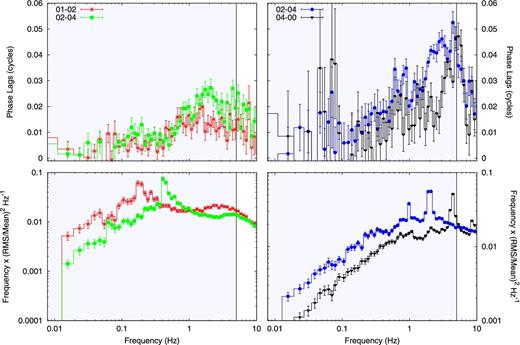
H1 phase lag (top; lags are in the ≃5.7–15 keV band respect to the ≃2–5.7 keV band; see Section 2 for more details) and power spectra (bottom; 2–60 keV) of four representative observations. The red, green, blue and black colours mark observations 92035-01-01-02, 92035-01-02-04, 92035-01-02-06 and 92428-01-04-00, respectively. The location of these observations in the HID and LID are indicated in Fig. 4.
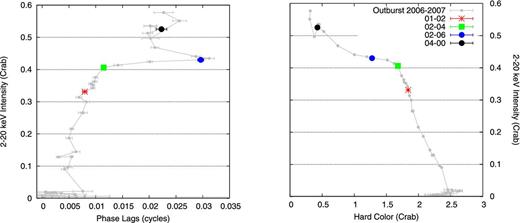
HID (right) and H1 phase–intensity diagram (left) for the 2006–2007 outburst. Hard colour is defined as the count rate in the 16.0–20.0 keV band divided by the count rate in the 2.0–6.0 keV band. Intensity is the count rate in the 2.0–20 keV band. Both the hard colour and the intensity are normalized by the Crab (see Section 2 for more details). The H1 phase lags (≃5.7–15 keV) are calculated relative to the (≃2–5.7 keV) reference band, and correspond to the average phase lag divided by 2π in the 0.008–5 Hz frequency range. The red, green, blue and black colours correspond to observations 92035-01-01-02, 92035-01-02-04, 92035-01-02-06 and 92428-01-04-00, respectively. Their phase spectrum and power spectrum are shown in Fig. 3.
For the 2002–2003 (black), 2006–2007 (green) and 2010–2011 (violet) outbursts, the H1 lags reach the maximum value on MJD 52400–52402 (ObsID: 70109-01-06-00/10-00), MJD 54140.2 (ObsID: 92035-01-03-00) and MJD 55298.7 (ObsID: 95409-01-14-03), respectively (marked with horizontal arrows in Fig. 2, panel B). These dates correspond to the moment when the type-C QPO reaches frequencies in the 2–3 Hz range, close to, but still below, our 5-Hz limit for the calculation of the lags. To investigate whether this could be the reason for the behaviour of the lags at this point in the outburst, we also calculated the average phase lag in the 0.008–10 Hz range (not shown); in this case, we found that the overall pattern in the LIDs is the same as those shown in panel B in Fig. 2, with a maximum of ∼0.03 cycles happening at the same position of the arrows in panel B. In none of the observations of the three brightest outbursts we detected a type-B QPO; these QPOs occur when the source softens further in the outburst (see e.g. table 3 in Motta et al. 2011).
In the case of the 2004–2005 outburst (red), the lags increase with intensity during the whole rising part of the outburst. The ‘turn-the-corner’ point occurs at an intensity of ∼0.12 Crab, and the softening in the HID is less sharp than in the other three outbursts. This might be connected to the fact that this is also the only full outburst which made the hard-to-soft transition at a significantly lower luminosity than the others. In this outburst, the lags in the H1 band are the longest (up to ∼0.045 cycles). The last two observations presented here (ObsID: 90110-02-01-03/02-00), the one with the longest lags, already contain type-B QPOs in the power spectrum.
The evolution of the H2 lags during the individual outbursts in panel C is similar to what we observe in panel B, with the main differences being that (i) the lags during the 2004–2005 outburst (red) show a maximum of ∼0.17 cycles (at MJD 53232.35, ObsID:90110-02-01-00/02), and a sudden drop after that; the two observations after the maximum in this panel correspond to those where we detect type-B QPOs (see above), and (ii) the lags measured in the other three outbursts show a fast increase at the very end of our sampling, reaching a maximum in the ∼0.14–0.17 cycles range.
In all outbursts, the point where the lags start increasing at a higher rate (see panels B and C in Fig. 2) coincides with the ‘turn-the-corner’ point in the HID (see panel A), where the source starts the rapid transition to the intermediate state (in all panels of Fig. 2 we plot horizontal dotted-lines to guide the eye), strongly suggesting that both phenomena are connected, and related to the same changes the system is undergoing during this softening. This ‘turn-the-corner’ point in the HID does not appear to be related to the appearance of the type-C QPO, as at least in the 2006–2007 and 2010–2011, clear type-C QPOs are already detected before this transition (e.g. Motta et al. 2011).
In Fig. 5, we plot the H1 lags (left y-axis) versus the fractional rms amplitude computed in the 0.008–5 Hz range, using the full 2–60 keV RXTE energy band (coloured points). To compare with the correlation between fractional rms amplitude and hard colour (e.g. Belloni et al. 2005), we also plot in this figure the relation between hard colour (right y-axis) versus fractional rms amplitude (grey points). For the three brightest outbursts, the point where the H1 lags reach their maxima (panel B of Fig. 2) corresponds to the point where the average rms amplitude is ∼20 per cent. Again, this is not the case for the 2004–2005 (red) outburst, where the H1 lags continue increasing up to the end of our sampling. From Fig. 5 it is also apparent that the hard-colour versus rms relation has a break when the rms amplitude is ∼20 per cent (see hand-drawn dashed lines in each panel), even for the 2004–2005 outburst. This break was already apparent, but not specifically discussed, in some of the figures in Belloni et al. (2005), Fender et al. (2009), Motta et al. (2011) and Stiele et al. (2011).
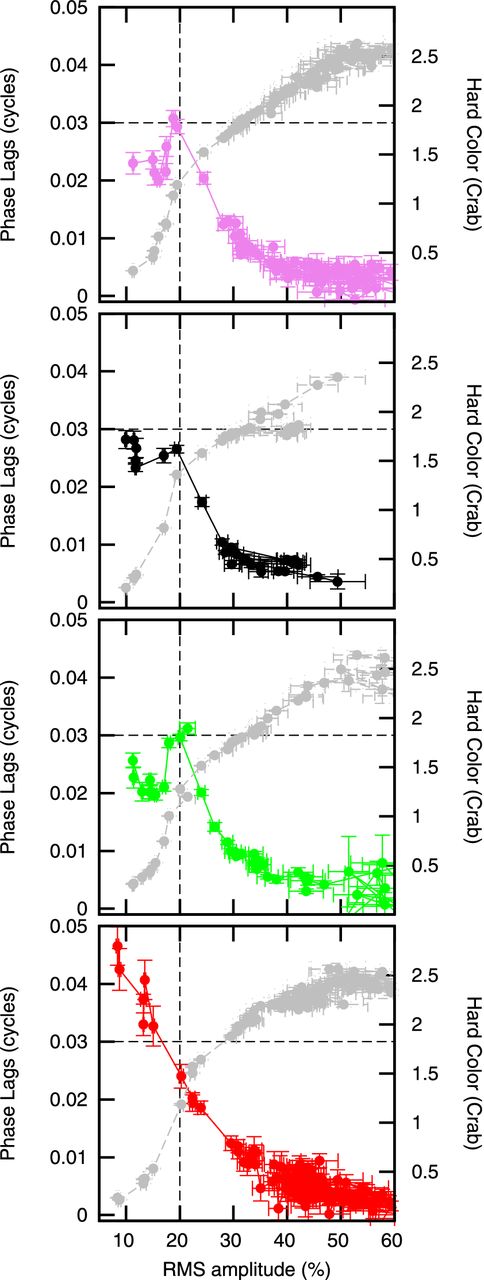
0.008–5 Hz frequency average phase lag divided by 2π of band H1 (≃5.7–15 keV) relative to the ≃2–5.7 keV soft band (coloured points; left y-axis) and hard colour (grey points; right y-axis) versus the average 0.008–5 Hz fractional rms amplitude (2–60 keV) for the four outbursts discussed in this paper (see Fig. 2 for the identification of the outbursts). Each point corresponds to the average values per observation, and for each measurement of a lag we plot the corresponding hard-colour point in grey. The hand-drawn dashed lines show the break in the hard-colour versus rms relation at rms ∼20 per cent. The vertical and horizontal dashed lines are plotted to help the eye.
We note that GX 339–4 has undergone additional outbursts (e.g. Motta et al. 2011); however, we do not report them here in detail as they were either outbursts where GX 339–4 always remained in the hard state, or the outburst was not well sampled by RXTE observations. Nevertheless, the lags during the hard state of those other outbursts are consistent with the ones shown in Fig. 2. In Fig. 2, when hard colour <0.2, the rms amplitude in the PDS decreases further (not shown in Fig. 5; see e.g. Motta et al. 2011) and, as mentioned above, the lags in single observations are not always well constrained. During the soft-to-hard transition at the end of these outbursts, the rms amplitude in the PDS increases once more (e.g. Belloni et al. 2005; Stiele et al. 2011), and we can again measure the lags in individual observations; in this phase of the outburst, the lags are consistent with those in the LHS during the rise of the outburst. We do not discuss those lags further in this paper.
DISCUSSION
We present the first systematic study of the evolution of the X-ray lags of the broad-band variability component (0.008–5 Hz) in the BHC GX 339−4 as a function of the position of the source in the HID. The hard photons always lag the soft ones, with the phase lags ranging from ∼0.005 to ∼0.17 cycles depending on the observation and the energy band used to measure the lags. In all four outbursts studied here, as the source brightens at the beginning of the outburst, the lags initially increase slowly as the source is in the LHS, and then they start to increase much faster with intensity as the source initiates the transition to the hard-intermediate state (HIMS). After reaching a local maximum, the lags decrease and remain more or less constant (Fig. 2 B), or decrease and then increase again (Fig. 2 C), before the source moves into the HSS. While there is no unusual feature in the HID at the time that the lags reach the maximum value, the maximum of the lags coincide with a significant break in the relation between the hard-colour and the rms amplitude of the broad-band component in the power spectrum of the source. For the 2002–2003 outburst, this point also coincides with the time at which Homan et al. (2005) observed a dramatic drop of the optical/near-infrared (NIR) flux which they interpreted as a sudden change in the properties of the compact jet in this source.
Phase lags and the optical/NIR behaviour of GX 339–4
Several works have studied the relation between the X-ray emission and that at other wavelengths in BH binaries (see e.g. Jain et al. 2001; Russell et al. 2011; Buxton et al. 2012, and references therein). In particular, Homan et al. (2005) studied the X-ray and optical/NIR evolution of the 2002–2003 outburst of GX 339–4 (black points in our Figs 2 and 5). They found that in the LHS (MJD 52330–52398), both the optical/NIR and X-ray fluxes increase and remain well correlated with each other. As GX 339–4 evolved into the intermediate state, starting on MJD 52400, the optical/NIR fluxes decreased rapidly until GX 339–4 reached the spectrally soft state (about 10 d later), where the optical/NIR fluxes remained low and approximately constant. Homan et al. (2005) noticed that during the intermediate state, and particularly on MJD 52402, the disc flux increased dramatically (from <1 per cent to about 30 per cent of the total flux; note however that the total flux in the RXTE band actually decreased slightly at this point) without substantially changing nor interrupting the evolution of the frequency of the type-C QPO or the power-law index in the X-ray spectra. Unfortunately, there is a 3-d gap, between MJD 52402 and 52405, in the RXTE coverage of the 2002–2003 outburst (black points in Figs 2 and 5). If the lags in this outburst evolved in the same way as in the 2006–2007 (green) outburst, where the H1 lags drop from a local maximum of ∼0.03 cycles to ∼0.02 cycles within one day, we would have probably observed a maximum in the H1 lags in panel B (and possibly also in the H2 lags, panel C) within a day or two of MJD 52402. If that was the case, this would indicate that in GX 339–4 there is a relation between the lags and the optical/NIR emission, whereas the latter is not related to the power-law index or frequency of the type-C QPO (Homan et al. 2005). The rms amplitude of the variability would also be related to the optical/NIR emission, as there is a clear break at 20 per cent rms amplitude in the hard colour versus rms relation, coincident with the point where we observe the maximum in the H1 lags (Fig. 5; see below).
The accelerated steepening of the power-law component in the X-ray spectrum around MJD 52400, together with GX 339–4 showing a dramatic decrease in optical/NIR fluxes, led Homan et al. (2005) to suggest that this is the moment where the characteristics of the compact jet (as usually observed in the hard state, e.g. Corbel et al. 2013) start to change. If the corona of hot Comptonizing electrons and the compact radio jet are related, or if the base of the jet is the place where Comptonization takes place (e.g. Giannios, Kylafis & Psaltis 2004; Giannios 2005; Markoff, Nowak & Wilms 2005), one would expect that the properties of the jet and the lags are correlated. Indeed, given that in BHCs in the LHS the radio and X-ray flux are correlated (also for GX 339–4, e.g. Corbel et al. 2013, and references therein), and that the lags correlate with X-ray intensity (panels B and C in Fig. 2), indicates that, at least in the LHS, the lags probably correlate with the radio flux of the compact jet. Several spectral and timing properties of accreting systems correlate with one another; here we have shown that the phase lags also correlate with those properties. To progress further, and to gain insight on what are the basic source properties that drive these correlations, one would need to test, for instance, whether the lags in GX 339–4 (and other sources) also correlate with the radio flux in the intermediate state, where the lags do not (always) correlate with the source intensity (see e.g. Fig. 2). Such a study could prove whether the lags as we estimated in this work are a good indicator of some of the radio jet characteristics, similar to the evidence provided by the correlations between radio luminosity and X-ray timing frequencies found in both neutron stars (NSs) and BHs (see e.g. Migliari, Fender & van der Klis 2005).
Lags and the fractional rms amplitude
In Fig. 5, we showed that there is a break in the hard-colour versus rms correlation that occurs consistently at rms ∼20 per cent in all four outbursts. This break can also be seen as a ‘notch’ in the absolute rms–intensity diagram (e.g. fig. 1 in Muñoz-Darias et al. 2011a, at absolute rms ∼220 counts s−1 and PCU2 count rate ∼1000 counts s−1, corresponding to a fractional rms amplitude of ∼20 per cent). Muñoz-Darias et al. (2011a) show that, at least in the 2006–2007 outburst, this notch in the absolute rms–intensity diagram coincides with the observations where X-ray spectral fits require a thermal blackbody component (Motta et al. 2011); Muñoz-Darias et al. (2011a) interpreted this as the appearance (in the 2–15 keV band) of an optically thick accretion disc with a very low variability level. For the 2002–2003 (black) outburst, the break in the hard-colour versus rms relation also coincides with the time when the disc flux showed a dramatic increase (from <1 per cent to about 30 per cent of the total flux), and the optical and NIR bands started to decrease (see discussion above, and Homan et al. 2005). As it can be seen in Fig. 5, except in the case of the weak 2004–2005 (red) outburst (see Section 3 and Fig. 5 for details), in the other three outbursts the break in the hard-colour versus rms relation coincides with the moment when the H1 lags reach their maximum, again suggesting a strong relation between lags, rms amplitude and spectral evolution.
As it is apparent from fig. 5 in Fender et al. (2009), at least two other BHC systems (XTE J1550–564 and XTE J1859+226) also show a break in the hard-colour versus rms relation that, coincidentally, happens at around 20 per cent rms as well. Although this coincidence has to be explored in more detail (as the frequency and energy bands used by Fender et al. 2009, differ from those used in this paper), it suggests the interesting possibility that we can identify the point where the spectral fits require a thermal component just by the use of the fractional rms amplitude or the lags, assuming that other sources show the same evolution of the lags during the outburst.
GX 339–4 versus Cygnus X–1
Grinberg et al. (2014) reported on the long term evolution of the energy-resolved X-ray variability of the persistent BHC LMXB Cygnus X–1 using data taken between 1999 and 2011. These authors find positive time lags that evolve as a function of the spectral state of the source: the average time lags (as calculated in narrow frequency ranges) increase considerably when the source moves from the hard to the intermediate state (with a maximum of ∼20 ms for the 0.1–30 Hz lags of the 9.4–15 keV photons relative to the 2.1–4.5 keV photons; bands 4 and 1, respectively in Grinberg et al. 2014), and then the lags suddenly drop to ≲ 5 ms when Cygnus X–1 enters the softest states. To compare our results with those of Grinberg et al. (2014), we calculated the average 0.008–5 Hz phase lag for Cyg X-1 using the same energy bands and the exact procedure used for GX 339–4. In Fig. 6, we show the phase lags of Cyg X-1 (grey points3) and GX 339–4 (colour points; colours are the same as in Fig. 2). This figure shows that Cyg X-1 and GX 339–4 span the same range in hard colour (although note that GX 339–4 soft-state data are not included in this plot). The overall shape drawn by Cyg X-1 and GX 339–4 is similar: as the source softens, the lags increase until a maximum is reached, and the lags decrease. In Cyg X-1, the turn-over happens at softer colours than in GX 339–4, and the decrease in lags continue to much lower values than in GX 339–4. The differences in absolute value of phase lag (and that of the hard colour at which the lags change sharply) could be related to differences in the system's characteristics (e.g. BH mass) or to the fact that Cyg X-1 does not reach the typical soft state seen in other BH systems (e.g. Grinberg et al. 2014, and references therein). In any case, the fact that Cyg X-1 shows the turn-over as it transits to a softer state while it does not show any QPOs (see Grinberg et al. 2014, for a discussion) supports our conclusion that the turn-over in phase lags observed in GX 339–4 is not directly related to the appearance or disappearance of QPOs (see Section 3). It remains to be seen whether the lags also drop in GX 339–4 when it reaches the soft state.
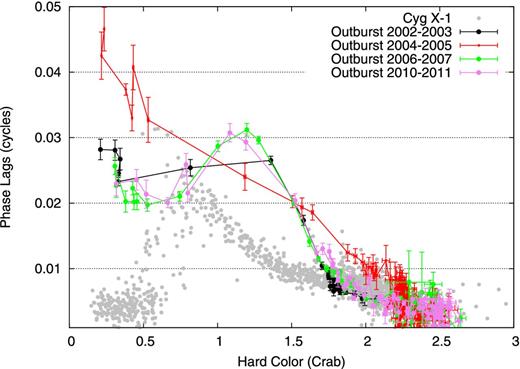
H1 phase lag (≃5.7–15 keV band respect to the ≃2–5.7 keV band) versus hard colour (normalized by the Crab) for Cyg X-1 (grey) and GX 339–4. Hard colour is defined as the count rate in the 16.0–20.0 keV band divided by the count rate in the 2.0–6.0 keV band.
On the origin of the lags
In GX 339–4, the photons in both hard bands, H1 and H2, lag the photons in the soft band. This is consistent with previous results of the lags in the LHS of this and other BHC (e.g. van der Klis et al. 1987; Nowak et al. 1999; Belloni et al. 2005; Hua et al. 1997; Kazanas et al. 1997; Cui et al. 2000; Muñoz-Darias et al. 2011b; Grinberg et al. 2014) and NS (Ford et al. 1999) LMXBs.
Hard lags have been originally explained as due to inverse Compton scattering of soft disc photons in a uniform cloud of hot electrons (the so-called corona) close to the compact object (e.g. Payne 1980; Miyamoto et al. 1988; Ford et al. 1999; Nowak et al. 1999). With each scattering the energy of a photon (E) increases approximately by ΔE/E = kTe/(mec2) (e.g. Miyamoto et al. 1988; Nowak et al. 1999), where kTe is the temperature of the electrons in the corona. This implies that the longer the path length of the photon has to travel before leaving the corona, the longer the time lag, and the higher the energy of the photon. In this scenario, the minimum time lag between hard and soft X-rays would be of the order of the light-crossing time of the Comptonizing region (e.g. Miyamoto & Kitamoto 1989; Kazanas et al. 1997; Nowak et al. 1999), while the maximum time lag must be less than the size of the emitting region divided by the slowest propagation speed (sound or thermal wave speed) in that region (e.g. Nowak et al. 1999). Very roughly, the average phase lags in GX 339–4 would imply a light-crossing time of ∼21 000 km, or ∼700 Schwarzschild radii (RS) for a 10 M⊙ BH (or much larger radii if one only takes the longest lags observed, see e.g. Kazanas et al. 1997; Hua et al. 1997).
The main obstacle to this scenario (e.g. Nowak et al. 1999; Lin et al. 2000; Maccarone et al. 2000; Poutanen 2001) is that in a constant-density corona the energy required to maintain a population of highly energetic electrons is only available very close to the BH, whereas the magnitude of the lags imply either very energetic electrons far away from the BH, or a corona with an optical depth much larger than deduced from spectral fits (Wardziński et al. 2002; Miyakawa et al. 2008). The problem becomes worse if, to explain the frequency dependence of the time lags in these systems, the density of the corona goes as r−1 (i.e. inversely proportional to the distance to the compact object, see e.g. Hua et al. 1997; Kazanas et al. 1997). In addition, Maccarone et al. (2000) showed that the energy dependence of the width of the autocorrelation function of the X-ray light curves produced by Compton scattering in an isotropic corona is inconsistent with the observations.
These difficulties lent support to the idea of Lyubarskii (1997) that the variability (and the lags) in the light curve of these systems could be due to small variations of the viscosity parameter in the accretion disc. These variations render fluctuations of the mass accretion rate that propagate through the disc, and eventually dissipate in the corona. Several authors explored the effect of this idea on the lag spectrum of accreting sources (e.g. Misra 2000; Kotov, Churazov & Gilfanov 2001; Arévalo & Uttley 2006; Uttley et al. 2011). Arévalo & Uttley (2006) carried out a detailed study of the dependence of the power density and lag spectrum (and coherence function; Vaughan & Nowak 1997) upon, among others, the emissivity profile of the disc, and the geometry and the viscosity parameter of the accretion flow. Using this model, Arévalo & Uttley (2006) were able to reproduce the observed lag spectra in an RXTE observation of Cyg X-1 and an XMM–Newton observation of the narrow line Seyfert 1 galaxy NGC 4051. However, while the same model can reproduce the 2–3 versus 0.5–0.9 keV lags observed with XMM–Newton in GX 339–4 in the LHS during the 2004 outburst, it fails to explain the 6–9 versus 2–3 keV in the same observation (Uttley et al. 2011).
Giannios et al. (2004), based on the work of Reig, Kylafis & Giannios (2003) and Kylafis et al. (2008), proposed that the hard lags could be due to Comptonization of soft disc photons in the jet that is present in the LHS of galactic BHCs. The proposed mechanism is the same as in the case of Compton scattering in a corona (see above), but in this case the anisotropy of the scattering process along the jet resolves the energy problem compared to the case of the lags produced in a (spherical) corona.4 Furthermore, in this model the width of the autocorrelation function decreases with energy, in agreement with observations (Maccarone et al. 2000). It is interesting that the radio emission from the jet is quenched when the source moves from the low-hard to the soft-intermediate state (e.g. Fender et al. 2009, and references therein), while coincidentally in GX 339–4 we find that the lags drop as the source moves into the hard-intermediate and the soft-intermediate state.
The sudden change we observed in GX 339–4 is similar to that seen in Cyg X-1, for which the magnitude of the lags drop abruptly as the source moves out of the hard state (see Fig. 6). In the model where the lags are produced by Comptonization in the jet, the increase of the lags as the intensity of the source increases in the LHS of GX 339–4 (see Fig. 2) would be due to an increase of the height and/or the radius of the base of the jet (see fig. 5 in Giannios et al. 2004). On the other hand, the drop of the lags could indicate that the optical depth of the Comptonizing region in the jet drops, consistent with the interpretation that the spectrum of the radio jet changes from optically thick to optically thin synchrotron emission at this point in an outburst (see e.g. Fender et al. 2009; Corbel et al. 2013).
Interestingly, the maximum of the lags in GX 339–4 coincides, within ±1 d, with the time at which there is a sudden increase of the cut-off energy Ecut of the cut-off power law that Motta et al. (2009) fitted to the energy spectrum of GX 339–4 during the 2006–2007 outburst (see their fig. 6). Furthermore, from fig. 6 in Motta et al. (2009), it is also apparent that the Ecut of the hard spectral component in GX 339–4 remained more or less constant for the first ∼20 d of the 2006–2007 outburst, after which, Ecut started to decrease. From our Fig. 4, it appears that the behaviour of the phase lags also changes around that time; at the beginning of the outburst, the phase lags appear to be constant, and when the intensity reaches ∼0.2 Crab the lags start to increase.
To further investigate this, in Fig. 7 we plot the temporal evolution of Ecut (data from Motta et al. 2009) and the phase lags for the first 45 d of the 2006–2007 outburst. This figure shows that both Ecut and the phase lag remain more or less constant until approximately MJD 50952, date when Ecut starts to decrease while the phase lags start to increase. Under the assumption that both quantities are correlated, we fitted a broken power law to both curves simultaneously, with the condition that the break was the same for both fits; we further assumed that the power-law index before the break was zero, i.e. both Ecut and the phase lags are constant before the break. The continuous line in both panels of Fig. 7 represents the best-fitting model (χ2/dof = 4.1 for 30 dof) with a break at MJD − 50946 = 20.1 ± 1 d. The fit improves (χ2/dof = 2.6 for 28 dof) if we let the power-law indices before the break free to vary during the fits; in this case the break happens at MJD − 50946 = 17.4 ± 0.7 d. None of the fits is statistically acceptable and there is a priori no reason to assume that a broken power law is the correct model to describe the data. Even if our proposed model was correct, the lack of data at the break precludes us from concluding whether the break occurs simultaneously in both curves. While this needs to be investigated in more detail (e.g. with data from other outbursts), Fig. 7 strongly suggests that, already at this early phase of the outburst, both Ecut and the phase lags are correlated. This result, together with the fact that the maximum lag we measured in GX 339–4 coincides (within ±1 d) with the time at which there is another (sudden) increase of Ecut, suggests that the average magnitude of the lags are related to the properties of corona/jet (e.g. Giannios et al. 2004), rather than to the disc (e.g. Lyubarskii 1997; Uttley et al. 2011).
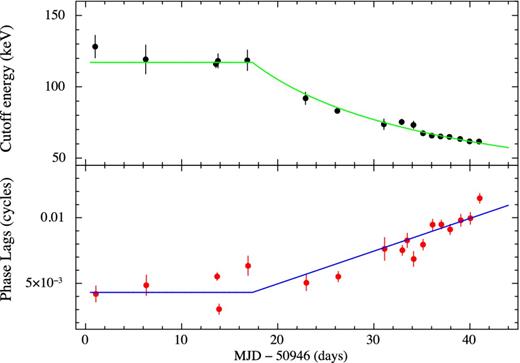
Cut-off energy Ecut of the energy spectra (top) as reported by Motta, Belloni & Homan (2009) and H1 phase lags (bottom; lags are in the ≃5.7–15 keV band respect to the ≃2–5.7 keV band; see Section 2 for more details) during the first 45 d of the 2006–2007 outburst of GX 339–4. With continuous lines we show a broken power-law fit done to both curves simultaneously, with the condition that break is the same for both fits and that the power-law index before the break is zero. For this model, the break is at MJD − 50946 = 20.1 ± 1 d (see Section 4.4 for more details).
Intriguingly, there is no apparent discontinuity in the time evolution of Ecut at the point at which the lags start to increase very rapidly, e.g. the green point during the 2006–2007 outburst in the left-hand panel of Fig. 4. This point, however, coincides with the turn-the-corner point in the HID (right-hand panel of Fig. 4; see Fig. 2 for the other outbursts), which defines the transition from the hard to the intermediate state. To investigate this in more detail, in Fig. 8 we plot the ratio between the 0.008–5 Hz averaged lags in GX 339–4 measured in the H2 and H1 bands as a function of the intensity of the source. At intensities lower than about 0.35 Crab (for the weak 2004–2005 outburst this value is ∼0.12 Crab), the ratio of the lags remains approximately constant at a value of ∼2, and as the intensity rises further the ratio increases abruptly up to values of 6–7. The ratio in Fig. 8 deviates from a constant value at the same time that the source reaches the ‘turn-the-corner’ point in the HID (Fig. 2), implying that the transition to the intermediate state has an effect on the characteristic of the component in the accretion flow that produces the lags, e.g. the geometry of the jet in the model of Reig et al. (2003) and Giannios et al. (2004), or the accretion disc in the model of Lyubarskii (1997) and Arévalo & Uttley (2006). Motta et al. (2009) found that, at least in the 2006–2007 outbursts of GX 339–4, the accretion disc does not contribute significantly to the emission in the RXTE/PCA band in this phase of the outburst (Motta et al. 2009 used the same data that we used in our paper for the study of the lags). Together with our findings, this implies that, even if the lags are due to the propagation of fluctuations in a relatively cool disc that peaks outside the RXTE/PCA band, Comptonization would still be required to explain lags.
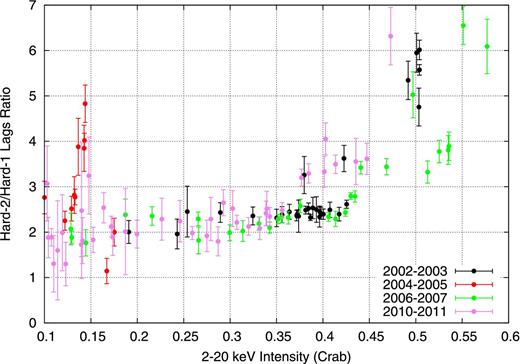
The ratio between the lags in the H2 (≃16–35 keV) and H1 (≃5.7–15 keV) bands as a function of intensity (in units of the Crab nebula). Lags correspond to the average phase lag divided by 2π in the 0.008–5 Hz frequency range using as reference the soft band (≃2–5.7 keV). We only show the ratios for intensities higher than 0.1 Crab, as below that the lags in single observations are not well constrained (however, the average ratio between lags is still ∼2).
SUMMARY
We studied the evolution of the X-ray lags of the transient BHC LMXB GX 339–4 as a function of the position of the source in the HID. In the LHS, the lags correlate with X-ray intensity, and as the source starts its transition to the intermediate/soft states, the lags first increase faster, and then appear to reach a maximum, although the exact evolution depends on the outburst and the energy band used to calculate the lags. Changes in the lags appear to coincide with changes in optical/NIR flux, fractional rms amplitude and probably the appearance of a thermal component in the X-ray spectra, strongly suggesting that lags can be very useful to understand the physical changes that GX 339–4 undergoes during an outburst. We find evidence for a connection between the evolution of the cut-off energy Ecut (of the energy spectra) and the phase lags, suggesting that the average magnitude of the lags are related to the properties of corona/jet, rather than to the disc.
The behaviour of the lags in GX 339–4 is similar to that of the BH Cygnus X–1 (Grinberg et al. 2014), suggesting that similar phenomena could be observable in other BH systems. Understanding how lags evolve in other BH outbursts, and whether the correlation with intensity, maximum value at ∼20 per cent fractional rms amplitude, etc., is common to all BHC outbursts, or whether that depends on the characteristics of the system (e.g. neutron star versus BH, BHC mass, spin, inclination of the orbit with respect to the observer, radio flux, etc.) is a necessary input for current and future models that describe both X-ray variability and multiwavelength observations.
We thanks N. Kylafis, T. Belloni, P. Uttley, I. McHardy and D. Emmanoulopoulos for insightful discussions. We also thank the referee for very useful suggestions. DA acknowledges support from the Royal Society. This research has made use of data and/or software provided by the High Energy Astrophysics Science Archive Research Center (HEASARC), which is a service of the Astrophysics Science Division at NASA/GSFC and the High Energy Astrophysics Division of the Smithsonian Astrophysical Observatory. This research has made use of NASA's Astrophysics Data System.
PCA Digest at http://heasarc.gsfc.nasa.gov/ for details of the model.
We calculated the frequency-averaged 0.008–5 Hz phase lag, by first averaging the raw cross-correlation vectors, then averaging over frequency, and finally calculating the lag as |$PL = \arctan {(\Im /\Re )} / 2\pi$|, where ℑ and ℜ are the imaginary and real part of the resulting frequency-averaged vector, respectively.
Uttley et al. (2011) argued that, contrary to what they observed in GX 339–4, this model predicts that the 2–3 keV versus 0.5–0.9 keV lags should be smaller than the 6–9 keV versus 2–3 keV lags due to dilution by the direct seed photons from the disc at soft energies. However, Kara et al. (2013) recently showed that contamination by either Poisson noise or an incoherent component does not affect the lags of a coherent signal. The findings of Uttley et al. (2011) would still be consistent with the jet model of the lags if, for instance, the fluctuations in the disc were Poissonian, while the observed variability was due to the response (Green) function of the Comptonizing component (the jet in this case).
