


Abstract
We present a multifrequency radio continuum study of seven giant low surface brightness (GLSB) galaxies using the Giant Metrewave Radio Telescope (GMRT). GLSB galaxies are optically faint, dark-matter-dominated systems that are poorly evolved and have large H i gas discs. Our sample consists of GLSB galaxies that show signatures of nuclear activity in their optical spectra. We detect radio emission from the nuclei of all the seven galaxies. Five galaxies have nuclear spectral indices that range from 0.12 to −0.44 and appear to be core dominated; the two galaxies have a steeper spectrum. Two of the galaxies, UGC 2936 and UGC 4422, show significant radio emission from their discs. In our 610 MHz observations of UGC 6614, we detect radio lobes associated with the radio-loud active galactic nucleus (AGN). The lobes have a spectral index of −1.06 ± 0.12. The star formation rates estimated from the radio emission, for the entire sample range from 0.15 to 3.6 M⊙ yr−1. We compare the radio images with the near-ultraviolet (NUV) images from GALEX and near-infrared (NIR) images from 2MASS. The galaxies present a diversity of relative NUV, NIR and radio emission, supporting an episodic star formation scenario for these galaxies. Four galaxies are classified members of groups and one is classified as isolated. Our multiwavlength study of this sample suggests that the environment plays an important role in the evolution of these galaxies.
1 INTRODUCTION
Low surface brightness (LSB) galaxies are late-type spirals that have properties quite distinct from regular spirals on the Hubble sequence. They are characterized by a central disc surface brightness fainter than 23 mag arcsec−2 in the B band (Impey & Bothun 1997; Geller et al. 2012). They have diffuse stellar discs (de Blok, van der Hulst & Bothun 1995), large H i discs and massive dark matter haloes (McGaugh & de Blok 1998; van den Hoek et al. 2000). The low star formation rates (SFRs; O'Neil, Oey & Bothun 2007) and low metallicities (McGaugh 1994) of these galaxies suggest that they are less evolved compared to high surface brightness galaxies (HSBGs). Chemical evolution models indicate that star formation has proceeded in a stochastic manner in LSB galaxies and hence their evolution is slow (Bell et al. 2000; van den Hoek et al. 2000).
Studies show that LSB galaxies span a wide range of morphologies, from the more populous dwarf LSB galaxies (Pustilnik et al. 2011) to the relatively larger giant spirals-like Malin 1 (McGaugh, Schombert & Bothun 1995; Beijersbergen, de Blok & van der Hulst 1999; Galaz et al. 2002). The larger LSB galaxies or the so-called giants are relatively rare (Sprayberry et al. 1995; Bothun et al. 1990) and often isolated compared to HSBGs (Galaz et al. 2011). In fact, they are often found close to the edge of voids (Rosenbaum et al. 2009). Although the discs of giant low surface brightness (GLSB) galaxies are usually poor in star formation (Auld et al. 2006); weak but distinct spiral arms are often present (McGaugh et al. 1995). The barred galaxy fraction is low compared to HSBGs (Mayer & Wadsley 2004) and a significant fraction is bulgeless. The lack of disc evolution may be due to the massive dark matter haloes that dominate the discs of these galaxies as haloes play an important role in slowing down the formation of disc instabilities (Mihos, McGaugh & de Blok 1997). However, there are exceptions; some GLSB galaxies show vigorous signs of disc star formation and emit copious UV and Hα emission (Boissier et al. 2008).
GLSB galaxies have low surface brightness discs and some have been found to host active galactic nuclei (AGNs; Sprayberry et al. 1995; Schombert 1998). Schombert (1998) studied a sample of GLSB galaxies using optical spectroscopy and concluded that at least 30 per cent of the sample showed AGN activity, especially those that have prominent bulges. AGN in GLSB galaxies have also been detected in X-ray (Das et al. 2009; Naik et al. 2010) with similar luminosities as of AGN in bright spirals (1040–1042 erg s−1). In their optical study of stellar populations in bulges of low surface brightness galaxies, Morelli et al. (2012) find them to be similar to HSBGs which they say implies that the disc–bulge evolution is decoupled.
LSB galaxies have not been extensively investigated in the radio continuum. Recently, Mei, Yuan & Dong (2009) have conducted a survey of AGNs in 196 LSB galaxies sample by Impey et al. (1996) using the spectroscopic data of SDSS DR5 and the corresponding FIRST data. They find that about 10–20 per cent GLSB galaxies host an AGN as compared to the 50 per cent found for HSBGs (Kennicutt, Keel & Blaha 1989; Ho, Filippenko & Sargent 1997). Boissier et al. (2008) have examined the UV colours from GALEX and the star formation efficiency (SFE) of these galaxies. They find that the UV light extends out farther than the optical light and SFE are lower for some LSB galaxies. They also find that the UV emission of a few LSB galaxies in the sample resembles that observed in the XUV-disc galaxies (Gil de Paz et al. 2005; Thilker et al. 2007). Besides, they also find that the FUV–NUV colour for LSB galaxies is redder than expected for star-forming galaxies which they interpret as being due to bursts of star formation. In this paper, we present a detailed multiwavelength (either 1280 or 1420 MHz (L band), 610 MHz, 325 and 240 MHz) radio study of a sample of seven GLSB galaxies with the Giant Metrewave Radio Telescope (GMRT). We study the radio morphology of the sources, the star-forming component and the spectrum of the central active source in these galaxies. We refer to AGNs as a flat-spectrum sources if α ≥ −0.5. Synchrotron self-absorption results in such flat spectrum. We also present a comparative study of the radio, UV (NUV) and NIR (J-band) emissions from these galaxies.
2 THE SAMPLE
In this paper, we present the radio continuum study of a sample of seven GLSB galaxies with an aim to study the AGN. The sample is selected from several studies in the literature (Sprayberry et al. 1995; Schombert 1998; Ramya, Prabhu & Das 2011) based on the following criteria: (1) large spirals, (2) prominent bulge, (3) presence of an optically identified AGN and (4) vsys ≤ 15 000 km s−1. The sample consists of UGC 1378, UGC 1922, UGC 2936, UGC 4422, Malin 2, UGC 6614 and UM 163. The basic properties of the galaxies are listed in Table 1. The galaxy morphologies range from Sa to Sd types. Four galaxies in our sample are classified as members of groups. Supernova explosions have been recorded in three galaxies: UGC 1922 (SN 1989s; Mueller, Gunn & Oke 1989), UGC 2936 (SN 1991bd; Mueller et al. 1991) and UGC 4422 (SN 1999aa; Armstrong & Schwartz 1999) in the recent past. The optical identifications of AGNs are generally done using the spectral features of [N ii], [S ii], [O iii], Hα, Hβ and several other emission lines.
Properties of the sample galaxies.
| Galaxies | Typea | |$\alpha _{(2000)}^{a}$| | |$\delta _{(2000)}^{a}$| | Optical sizea | Inclinationb | Vhel a | 1 arcseca | Environment | Recent |
|---|---|---|---|---|---|---|---|---|---|
| (h:m:s) | (° : ′: ′′) | (arcmin × arcmin) | (degree) | (km s−1) | =(kpc) | supernova | |||
| UGC 1378 | (R)SB(rs)a | 01:56:19.2 | +73:16:58 | 3.4 × 2.3 | 68.4 | 2935 | 0.20 | – | – |
| UGC 1922 | S | 02:27:45.9 | +28:12:32 | 2.1 × 1.6 | 33.9 | 10 894 | 0.70 | LDCE 0163(37)d | 1989s(Type Ia) |
| UGC 2936 | SB(s)d | 04:02:48.2 | +01:57:58 | 2.5 × 0.7 | 80.6 | 3813 | 0.24 | – | 1991bd(Type II) |
| UGC 4422 | SAB(rs)c | 08:27:42.0 | +21:28:45 | 1.6 × 1.3 | 48.8 | 4330 | 0.30 | LGG 159c | 1999aa(Type Ia) |
| LDCE 571(22)d | |||||||||
| Malin 2 | Sd/p | 10:39:52.5 | +20:50:49 | 1.5 × 0.9 | 35.6 | 13 830 | 0.94 | Isolated | – |
| UGC 6614 | (R)SA(r)a | 11:39:14.9 | +17:08:37 | 1.7 × 1.4 | 29.8 | 6352 | 0.45 | LDCE 829(3)d | – |
| UM 163 | SB(r)b pec | 23:30:32.3 | −02:27:45 | 1.9 × 1.3 | 65.0 | 10 022 | 0.68 | LDCE 1583(3)d | – |
Although LSB galaxies do not contain abundant quantities of molecular gas, CO observations have revealed the presence of molecular gas in UGC 1922 (O'Neil & Schinnerer 2003) and in UGC 6614, Malin 2 (Das et al. 2006; Das, Boone & Viallefond 2010). Four galaxies in our sample namely UGC 1378, UGC 1922, UGC 2936 and UGC 6614 have been observed in X-rays (Das et al. 2009). While a compact nuclear source has been detected in X-rays from UGC 2936 (Das et al. 2009) and UGC 6614 (Naik et al. 2010), diffuse X-ray emission is detected in UGC 1378, UGC 1922 and UGC 2936 (Das et al. 2009). Millimetre-wave radio continuum has been detected from the core in UGC 6614 at 111 GHz (Das et al. 2006). All the sample galaxies have been observed in the NIR (2MASS, J band) and in the UV (GALEX, NUV) and detected in the radio continuum at 1.4 GHz (NVSS, 1.4 GHz). We have used 2MASS1J-band images (wavelength = 1.25 μm) which has a magnitude limit of 15.0 for extended sources and a magnitude limit of 15.8 for point sources in our analysis. The NIR bands trace old stellar populations (Skrutskie et al. 2006) so these images are used to understand the same. We have used the near-UV (NUV; 1770–2730 Å) images downloaded from the GALEX website2 as tracer of young massive stellar regions (Martin et al. 2005). Table 2 gives the details of the GALEX data we have used. UGC 1378 which is observed as part of the All-sky Imaging Survey (AIS) of GALEX, has a short exposure time of 100 s while rest of the galaxies have longer exposure times ranging from ∼1500 to 7500 s. The cores of all the galaxies and the star-forming discs of UGC 1378, UGC 2936 and UGC 4422 are detected in the NIR.
Details of GALEX images used in the paper.
| Galaxy | Surveya | NUVexposuretimeb | Depthb |
|---|---|---|---|
| (ks) | (MAB) | ||
| UGC 1378 | AIS | 0.1 | 20.5 |
| UGC 1922 | NGS | 1.5 | 23 |
| UGC 2936 | GIP | 3.3 | – |
| UGC 4422 | MIS | 1.5 | 23 |
| MALIN-2 | GIP | 7.6 | – |
| UGC 6614 | NGS | 1.5 | 23 |
| UM 163 | GIP | 3.3 | – |
| Galaxy | Surveya | NUVexposuretimeb | Depthb |
|---|---|---|---|
| (ks) | (MAB) | ||
| UGC 1378 | AIS | 0.1 | 20.5 |
| UGC 1922 | NGS | 1.5 | 23 |
| UGC 2936 | GIP | 3.3 | – |
| UGC 4422 | MIS | 1.5 | 23 |
| MALIN-2 | GIP | 7.6 | – |
| UGC 6614 | NGS | 1.5 | 23 |
| UM 163 | GIP | 3.3 | – |
Notes.aAll-sky Imaging Survey (AIS), Nearby Galaxy Survey (NGS) Medium Imaging Survey (MIS), Guest Investigator Program (GIP).
bTaken from Martin et al. (2005).
3 OBSERVATIONS AND DATA ANALYSIS
The observations were done using the GMRT (Swarup et al. 1991). The GMRT is an interferometric array of 30 antennas, each antenna being 45 m in diameter. Observations were carried out from 2005 December to 2012 October at 240 MHz, 325 MHz, 610 MHz and L band. Flux calibration was done using scans on one of the standard calibrators 3C 147, 3C 286 and 3C 48, which were observed at the start and end of the observing runs. Phase calibration was done using Very Large Array calibrator sources observed before and after each scan on the target source. Details of the observations are given in Table 3. The raw data were converted to FITS and imported to aips3. The data were reduced using standard tasks in aips. The calibrator data were edited and gain solutions obtained. The flux density calibrators were used for band-pass calibration. The band-pass calibrated data were averaged over a smaller number of channels to avoid bandwidth smearing effects. Wide-field imaging techniques were applied to the data. We generated 49 facets at 240 MHz, 25 facets at 325, 25 facets at 610 MHz and 9 facets at the L band across the primary beam (Cornwell & Perley 1992). Data sets were phase self-calibrated up to three iterations by using strong point sources within the primary beam field. A final round of phase and amplitude self-calibration was then done. Naturally (Robust = 5) and uniformly (Robust = 0) weighted (Briggs 1995) images at different resolutions were made at all the frequencies and then corrected for primary beam attenuation. In order to study the compact nuclear emission, we also made images after excluding the data corresponding to large angular scales in the image, i.e. short baselines.
Details of GMRT observations.
| Galaxies | Obs. date | Band | Calibrators | BWc | tsource | |$N_{\rm Ant.}^{d}$| | ||||||
|---|---|---|---|---|---|---|---|---|---|---|---|---|
| (dd-mm-yy) | (MHz) | Phase | Sphase(Jy)a | Flux | Sflux (Jy)b | (MHz) | (h) | |||||
| UGC 1378 | 26-10-12 | 325 | 0114+483 | 5.9 | 3C 48 | 45.0 | 32 | 3.5 | 28 | |||
| 30-07-06 | 610 | 0217+738 | 2.1 | 3C 48, 3C 147 | 29.4, 38.2 | 16 | 6.0 | 27 | ||||
| 30-12-11 | 1420 | 0217+738 | 1.8 | 3C 48 | 16.8 | 16 | 5.5 | 29 | ||||
| UGC 1922 | 27-10-12 | 325 | 3C 48 | 44.5 | 3C 48 | 44.5 | 32 | 3.5 | 28 | |||
| 31-12-05 | 610 | 3C 48 | 29.3 | 3C 48 | 29.3 | 16 | 6.0 | 28 | ||||
| 31-12-11 | 1420 | 3C 48 | 16.4 | 3C 48 | 16.4 | 16 | 6.0 | 29 | ||||
| UGC 2936 | 14-05-07 | 610 | 0323+055 | 5.3 | 3C 147 | 38.2 | 16 | 3.0 | 28 | |||
| 19-05-07 | 1280 | 0323+055 | 3.4 | 3C 147 | 23.6 | 16 | 3.0 | 28 | ||||
| UGC 4422 | 26-06-11 | 325 | 0909+428 | 17.6 | 3C 147, 3C 286 | 54.0,26.4 | 32 | 2.0 | 28 | |||
| 14-05-07 | 610 | 0735+331 | 5.3 | 3C 147 | 38.2 | 16 | 2.5 | 27 | ||||
| 29-12-11 | 1420 | 0842+185 | 1.1 | 3C 286, 3C 147 | 22.2, 14.8 | 16 | 5.5 | 29 | ||||
| Malin 2 | 09-01-06 | 240 | 3C 241 | 10.1 | 3C 147, 3C 286 | 48.6, 25.8 | 16 | 5.5 | 28 | |||
| 09-01-06 | 610 | 3C 241 | 4.3 | 3C 147, 3C 286 | 36.4, 20.6 | 16 | 5.5 | 28 | ||||
| 11-06-11 | 1280 | 3C 241 | 2.0 | 3C 147 | 23.7 | 32 | 1.0 | 27 | ||||
| UGC 6614 | 31-12-05 | 240 | 1123+055 | 6.4 | 3C 48, 3C 286 | 47.3, 25.8 | 16 | 6.5 | 27 | |||
| 31-12-05 | 610 | 1123+055 | 3.4 | 3C 48, 3C 286 | 29.3, 20.7 | 16 | 6.5 | 27 | ||||
| 12-07-11 | 1280 | 1120+143 | 2.7 | 3C 147 | 23.5 | 32 | 1.45 | 29 | ||||
| UM 163 | 26-06-11 | 325 | 2225−049 | 13.9 | 3C 48, 3C 147 | 42.8, 46.7 | 32 | 2.5 | 29 | |||
| 01-07-06 | 610 | 2225−049 | 10.6 | 3C 48 | 29.4 | 16 | 4.0 | 28 | ||||
| 28-07-06 | 1420 | 2225−049 | 8.4 | 3C 48, 3C 286 | 16.2,15.0 | 04 | 5.0 | 27 | ||||
Notes.aFlux densities (Sphase) of phase calibrators from GETJY, task in aips.
bFlux densities (Sflux) of flux calibrators from SETJY, task in aips.
cObserving bandwidth.
dAverage number of antennas working during the observations.
4 RESULTS
We detect radio emission from the nuclear region of all the seven galaxies at one or more radio bands. Two of the galaxies, UGC 2936 and UGC 4422, show diffuse emission which appears to be associated with the disc. The results for the images made with Robust = 5 and Robust = 0 (Briggs 1995) are summarized in Table 4.
Results of GMRT observations.
| Galaxy | Band | Low resolution (Robust = 5)a | High resolution (Robust = 0)a | Structure | ||||||||
|---|---|---|---|---|---|---|---|---|---|---|---|---|
| Flux densityb | Beam size | PA | σ | Flux densityb | Beam size | PA | σ | |||||
| (MHz) | (mJy) | (arcsec × arcsec) | (degree) | (mJy beam−1) | (mJy) | (arcsec × arcsec) | (degree) | (mJy beam−1) | ||||
| UGC 1378 | 325 | 2.2 ± 0.3 | 32 × 18 | 60.4 | 0.43 | 1.7 ± 0.2 | 13 × 11 | −33.3 | 0.18 | Compact core | ||
| 610 | 1.7 ± 0.2 | 11 × 7 | 8.0 | 0.08 | 0.9 ± 0.1 | 7 × 5 | 21.8 | 0.07 | Compact core | |||
| 1420 | 0.92 ± 0.04 | 5 × 4 | 7.1 | 0.04 | 0.54 ± 0.02 | 3 × 2 | 16.2 | 0.03 | Compact core | |||
| UGC 1922 | 325 | 72.8 ± 10.9 | 31 × 16 | 57.2 | 1.44 | 68.1 ± 10.2 | 12 × 9 | 79.6 | 0.80 | Compact core | ||
| 610 | 64.5 ± 9.6 | 15 × 12 | −82.8 | 0.20 | 56.0 ± 8.4 | 7 × 5 | 82.1 | 0.11 | Compact core+extended | |||
| 1420 | 35.1 ± 1.7 | 4 × 3 | 51.9 | 0.13 | 33.4 ± 1.6 | 3 × 2 | 54.5 | 0.06 | Compact core | |||
| UGC 2936 | 610 | 48.0 ± 7.2 | 20 × 14 | −42.3 | 0.28 | 46.4 ± 6.9 | 15 × 5 | 89.4 | 0.34 | Compact core+extended | ||
| 1280 | 29.3 ± 1.4 | 6 × 4 | −21.8 | 0.08 | –c | 3 × 2 | 41.4 | 0.08 | Compact core+extended | |||
| UGC 4422 | 325 | 49.9 ± 7.4 | 26 × 18 | −11.6 | 0.52 | 42.8 ± 6.4 | 10 × 9 | 44.5 | 0.30 | Compact core+extended | ||
| 610 | 10.1 ± 1.5 | 18 × 4 | −26.7 | 0.10 | 7.5 ± 1.1 | 6 × 4 | −35.4 | 0.12 | Compact core | |||
| 1420 | 4.0 ± 0.2 | 5 × 2 | 59.3 | 0.03 | 3.6 ± 0.1 | 3 × 2 | 61.0 | 0.02 | Compact core | |||
| Malin 2 | 240 | 5.2 ± 0.7 | 45 × 30 | −23.3 | 0.76 | 5.2 ± 0.7 | 37 × 14 | −31.9 | 0.94 | Compact core | ||
| 610 | 5.0 ± 0.7 | 20 × 19 | 33.5 | 0.18 | 5.0 ± 0.7 | 7 × 5 | 82.6 | 0.29 | Compact core | |||
| 1280 | 3.6 ± 0.1 | 9 × 6 | −89.1 | 0.09 | 3.6 ± 0.1 | 3 × 2 | −76.8 | 0.07 | Compact core | |||
| UGC 6614 | 240 | <6.8d | 40 × 36 | −4.6 | 1.71 | <4.6d | 16 × 14 | −64.7 | 1.15 | Not detected | ||
| 610 | 10.8 ± 1.6 | 20 × 16 | −50.2 | 0.16 | 10.2 ± 1.5 | 8 × 6 | −85.9 | 0.15 | Compact core+extended | |||
| 1280 | 4.4 ± 0.2 | 7 × 4 | 10.5 | 0.04 | 4.4 ± 0.2 | 3 × 2 | 74.2 | 0.05 | Compact core | |||
| UM 163 | 325 | 27.9 ± 4.1 | 17 × 11 | 61.8 | 0.27 | 26.1 ± 3.9 | 12 × 9 | 64.7 | 0.25 | Compact core | ||
| 610 | 14.8 ± 2.2 | 16 × 10 | −8.36 | 0.23 | 13.5 ± 2.0 | 7 × 5 | 59.4 | 0.19 | Compact core+extended | |||
| 1420 | 8.8 ± 0.4 | 12 × 5 | −28.9 | 0.14 | 7.1 ± 0.3 | 5 × 3 | 36.0 | 0.17 | Compact core | |||
Notes.aSee Briggs (1995).
bA systematic flux density error of 15 per cent of total flux at 240, 325 and 610 MHz and 5 per cent at the L band, is assumed.
cGalaxy emission is fragmented so the flux density is not measured.
dUGC 6614 is not detected at 240 MHz and 4σ limit is tabulated.
We present the images in Figs 1 –8 using the following format. In the first panel, the 610-MHz radio continuum contours are overlaid on the grey-scale GALEX NUV images of the galaxies. In the other zoomed-in panels, the contours of radio emission are overlaid on the NIR 2MASS images. In Table 5, we list the spectral indices for the nuclear emission and the integrated emission. The nuclear emission is estimated from images made after excluding shorter baselines which trace extended emission. In this table, we have listed (i) Column 3: nuclear flux densities at GMRT bands after convolving the images to the lowest resolution. (ii) Column 5: the estimated total flux densities at GMRT bands after convolving the images to the lowest resolution (iii) Column 7: NVSS flux densities and (iv) Column 8: the differences between the NVSS flux and the nuclear emission estimated from GMRT high-resolution images at the L band. In the following subsections, we discuss the results on the individual galaxies. The spectra are shown in Figs 9(a)–(f).
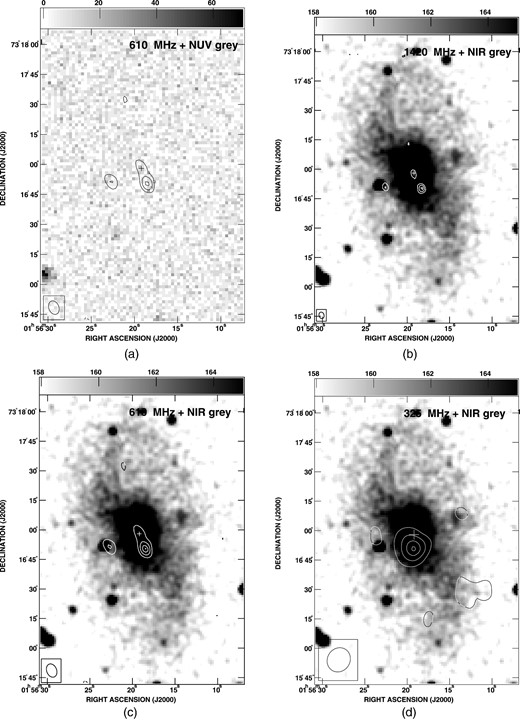
Images of UGC 1378: the cross marks the position of the optical centre. (a) The contours showing the 610 MHz emission are plotted at 60 × (−8,−4,4,8,12,14) μJy beam−1. The angular resolution is 7 arcsec × 5 arcsec, PA = 21| $_{.}^{\circ}$|82. The NUV grey-scale is counts s−1. (b) The contour levels of the 1420 MHz emission are 28× (−8,−4,4,8,13) μJy beam−1 for a beamsize of 3 arcsec × 2 arcsec, PA = 16| $_{.}^{\circ}$|26. The NIR grey-scale are data-number. (c) Contour levels are similar to (a). (d) The contours showing the 325 MHz emission are plotted at 0.2 × (−6,−4,4,6,8,9.3) mJy beam−1. The beamsize is 13 arcsec × 11 arcsec, PA = −33| $_{.}^{\circ}$|39.
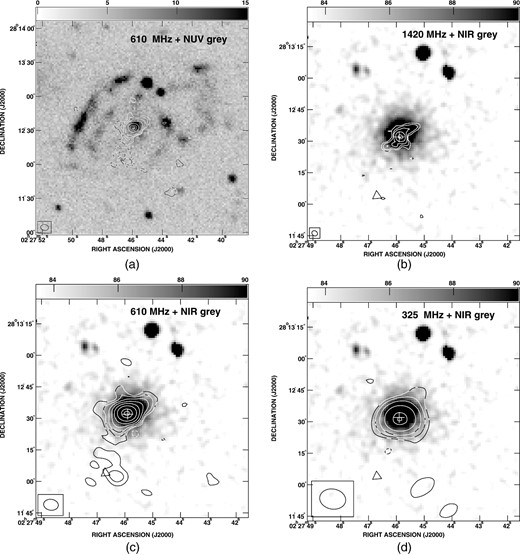
Images of UGC 1922: the cross marks the position of optical centre and the triangle at the south-east marks the position of the supernova, SN 1989S. (a) The contours showing the 610 MHz emission are plotted at 0.1 × (−8,−4,4,8,16,32,64,128,256,330) mJy beam−1. The angular resolution is 7 arcsec × 5 arcsec, PA = 82| $_{.}^{\circ}$|11. The NUV grey-scale is counts s−1. (b) The contour levels of the 1420 MHz emission are 60 × (−8,−4,4,8,16,64,256,350) μJy beam−1 for a beamsize of 3 arcsec × 2 arcsec, PA = 54| $_{.}^{\circ}$|55. The NIR grey-scale are data-number. (c) Contour levels are similar to (a). (d) The contours showing the 325 MHz emission are plotted at 0.8 × (−8,−4,4,8,16,32,64,75) mJy beam−1. The beamsize is 12 arcsec × 9 arcsec, PA = 79| $_{.}^{\circ}$|68.
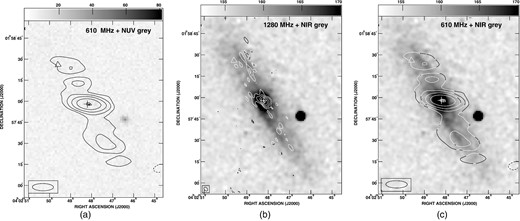
Images of UGC 2936: the cross marks the optical centre of the galaxy and the triangle in the north-east marks the position of the supernova, SN 1991bd. (a) The contours showing the 610 MHz emission are plotted at 0.3 × (−8,−4,4,8,16,32,64,66) mJy beam−1. The angular resolution is 15 arcsec × 5 arcsec, PA = 89| $_{.}^{\circ}$|48. The NUV grey-scale is counts s−1. (b) The contour levels of the 1280 MHz emission are 76 × (−8,−4,4,8,16,32,64,75) μJy beam−1 for a beamsize of 3 arcsec × 2 arcsec, PA = 41| $_{.}^{\circ}$|44. The NIR grey-scale are data-number. (c) Contour levels are similar to (a).
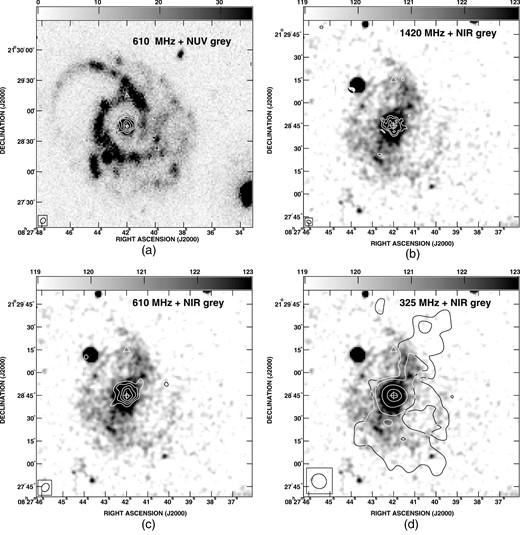
Images of UGC 4422: the cross marks the optical centre of the galaxy and triangle at the north marks the position of the supernova, SN 1999aa. (a) The contours showing the 610 MHz emission are plotted at 0.1 × (−6,−4,4,6,8,10,12) mJy beam−1. The angular resolution is 6 arcsec × 4 arcsec, PA = −35| $_{.}^{\circ}$|49. The NUV grey-scale is counts s−1. (b) The contour levels of the 1420 MHz emission are 28 × (−6,−4,4,6,8,10,13) μJy beam−1 for beamsize 3 arcsec × 2 arcsec, PA = 61| $_{.}^{\circ}$|05. The NIR grey-scale are data-number. (c) Contour levels are similar to (a). (d) The contours showing the 325 MHz emission are plotted at 0.4 × (−4,−3,3,4,8,10,12,14) mJy beam−1. The beamsize is 10 arcsec × 9 arcsec, PA = 44| $_{.}^{\circ}$|53.
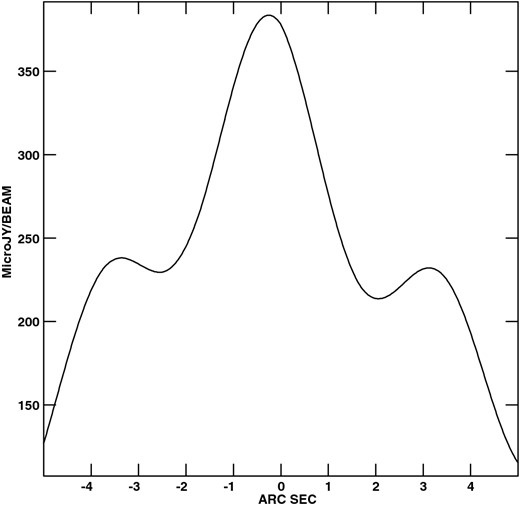
A slice along the right ascension passing through the centre of the galaxy in the 1420 MHz image of UGC 4422 which shows the presence of a central peak and a circumnuclear ring.
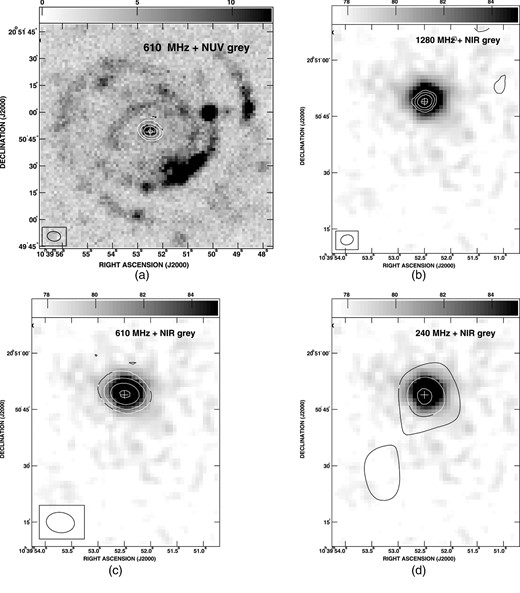
Images of Malin 2: the cross marks the optical centre of the galaxy. (a) The contours showing the 610 MHz emission are plotted at 0.2 × (−8,−4,4,8,16,28) mJy beam−1. The angular resolution is 7 arcsec × 5 arcsec, PA = 82| $_{.}^{\circ}$|69. The NUV grey-scale is counts s−1. (b) The contour levels of the 1280 MHz emission are 89 × (−8,−4,4,8,16,32) μJy beam−1 for beamsize 3 arcsec × 2 arcsec, PA = −76| $_{.}^{\circ}$|85. The NIR grey-scale are data-number. (c) Contour levels are similar to (a). (d) The contours showing the 240 MHz emission are plotted at 0.8 × (−6,−4,4,6,7.5) mJy beam−1. The beamsize is 37 arcsec × 14 arcsec, PA = −31| $_{.}^{\circ}$|92.
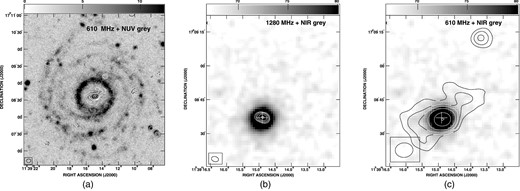
Images of UGC 6614: the cross marks the optical centre of the galaxy. (a) The contours showing the 610 MHz emission are plotted at 0.1 × (−6,−4,4,6,8,12,24,39) mJy beam−1. The angular resolution is 8 arcsec × 6 arcsec, PA = −85| $_{.}^{\circ}$|92. The NUV grey-scale is counts s−1. (b) The contour levels of the 1280 MHz emission are 60 × (−8,−4,4,8,16,32,64,73) μJy beam−1 for beamsize 3 arcsec × 2 arcsec, PA = 74| $_{.}^{\circ}$|26. The NIR grey-scale are data-number. (c) Contour levels are similar to (a).
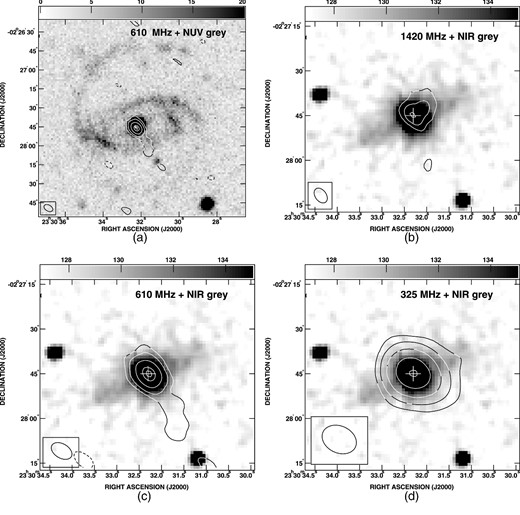
Images of UM 163: the cross marks the position of the optical centre. (a) The contours showing the 610 MHz emission are plotted at 0.2 × (−8,−4,4,8,16,25,28) mJy beam−1. The angular resolution is 7 arcsec × 5 arcsec, PA = 59| $_{.}^{\circ}$|41. The NUV grey-scale is counts s−1. (b) The contour levels of the 1420 MHz emission are 0.2 × (−8,−4,4,8,14) mJy beam−1 for beamsize 5 arcsec × 3 arcsec, PA = 36| $_{.}^{\circ}$|06. The NIR grey-scale are data-number. (c) Contour levels are similar to (a). (d) The contours showing the 325 MHz emission are plotted at 0.4 × (−8,−4,4,8,16,32,50) mJy beam−1. The beamsize is 12 arcsec × 9 arcsec, PA = 64| $_{.}^{\circ}$|70.
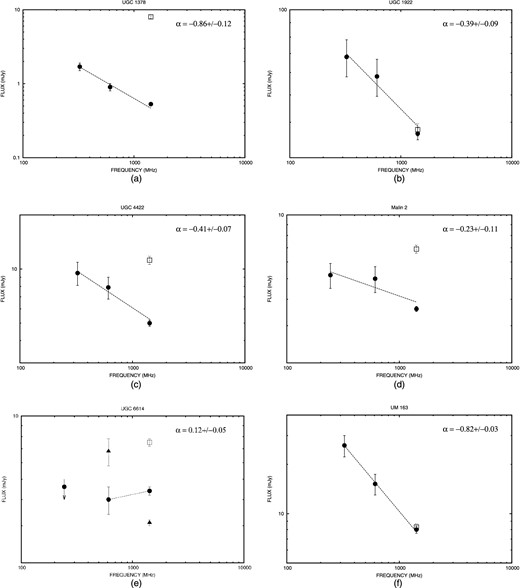
The spectral index α obtained from the fitted spectrum of the nuclear flux densities. Filled circles in the plots show the nuclear fluxes. Open squares show the NVSS flux densities. Filled triangle in the plot of UGC 6614 shows the jets/lobe flux density.
The spectrum of the emission from the sample galaxies between 240 and 1420 MHz along with nuclear flux densities due to AGN and disc emission.
| Galaxy | Frequency | Nuclear flux | α (S ∝ να) | Integrated | α | NVSS fluxb | (NVSS – Nuclear |
|---|---|---|---|---|---|---|---|
| density | (Nucleus) | flux densitya | (Integrated) | density | flux density)c | ||
| (MHz) | (mJy) | (mJy) | (mJy) | (mJy) | |||
| UGC 1378 | 325 | 1.7 ± 0.2 | 2.2 ± 0.3 | ||||
| 610 | 0.9 ± 0.1 | −0.9 ± 0.1 | 1.9 ± 0.2 | −0.29 ± 0.03 | |||
| 1420 | 0.54 ± 0.02 | 1.40 ± 0.07 | 8.0 ± 0.4 | 7.4 ± 0.4 | |||
| UGC 1922 | 325 | 68.1 ± 10.2 | 72.8 ± 10.9 | ||||
| 610 | 58.1 ± 8.7 | −0.39 ± 0.09 | 65.9 ± 9.8 | −0.40 ± 0.15 | |||
| 1420 | 36.5 ± 1.8 | 37.8 ± 1.8 | 37.7 ± 1.9 | 1.2 ± 0.1 | |||
| UGC 2936 | 610 | 7.7 ± 1.1 | |$\alpha ^{610}_{1280}$| ∼ −0.44 ± 0.09 | 48.0 ± 7.2 | |$\alpha ^{610}_{1280}$| ∼ −0.38 ± 0.12 | ||
| 1280 | 5.6 ± 0.2 | 36.4 ± 5.4 | 39.9 ± 2.0 | 34.3 ± 1.8 | |||
| UGC 4422 | 325 | 9.5 ± 1.4 | 49.9 ± 7.4d | |$\alpha ^{325}_{610} \sim$| −2.37 ± 0.16 | |||
| 610 | 7.9 ± 1.1 | −0.41 ± 0.07 | 11.4 ± 1.7 | |$\alpha ^{610}_{1420} \sim$| −1.05 ± 0.24 | |||
| 1420 | 5.0 ± 0.2 | 4.6 ± 0.2 | 11.2 ± 0.6 | 6.2 ± 0.4 | |||
| Malin 2 | 240 | 5.2 ± 0.7 | 5.2 ± 0.7 | ||||
| 610 | 5.0 ± 0.7 | −0.23 ± 0.11 | 5.0 ± 0.7 | Same as nuclear emission | |||
| 1280 | 3.6 ± 0.1 | 3.6 ± 0.1 | 6.9 ± 0.3 | 3.3 ± 0.2 | |||
| UGC 6614 | 240 | < 4.6 | < 6.8 | ||||
| 610 | 4.0 ± 0.6 | |$\alpha ^{610}_{1280}\sim$| +0.12 ± 0.05 | 10.8 ± 1.6 | |$\alpha ^{610}_{1280}\sim$| −1.13 ± 0.17e | |||
| 1280 | 4.4 ± 0.2 | 4.4 ± 0.2 | 7.5 ± 0.3 | 3.1 ± 0.1 | |||
| UM 163 | 325 | 26.1 ± 3.9 | 27.9 ± 4.1 | ||||
| 610 | 15.2 ± 2.2 | −0.82 ± 0.03 | 15.6 ± 2.3 | −0.77 ± 0.11 | |||
| 1420 | 8.0 ± 0.4 | 9.8 ± 0.4 | 8.3 ± 0.4 | 0.3 ± 0.0 |
Notes.aRobust = five images convolved to lowest resolution to estimate integrated flux density.
bNVSS flux density estimated from the NVSS images.
cLikely to be due to the star-forming disc and used in Table 6.
dThe 325 MHz detects diffuse emission from the star-forming disc which is not detected at the other frequencies, results in a steep spectrum of α = −2.37 ± 0.16.
eJet/lobe emission included.
4.1 Results on individual galaxies
UGC 1378: Schombert (1998) identified the optical AGN in this galaxy. Diffuse X-ray emission is detected from the central parts of this galaxy (Das et al. 2009). The picture of environment is not clear for this galaxy.
This galaxy is bright in the NIR band with emission arising from the entire disc (Figs 1b–d) but no NUV emission is detected which is likely due to the short exposure time (Table 2). The compact radio emission from the galaxy, which is detected at 325 MHz, gets resolved into two peaks with ∼8 arcsec offset at 1420 and 610 MHz. In fact, the radio peak emission at all the three frequency bands is detected to the south of the optical centre of the galaxy whereas fainter emission is detected from the optical AGN at 1420 and 610 MHz. We convolved the images of the galaxy at 610 and 1420 MHz to the lower resolution of the 325 MHz map to estimate the spectrum of the emission.
We detect a compact source to the east of the centre of the galaxy at the right ascension 01h56m22|${^{\rm s}_{.}}$|6 and declination +73°16′51|${^{\prime\prime}_{.}}$|5 at 610 and 1420 MHz (Figs 1b and c). This is close to a compact NIR source which is likely part of the galaxy. This source is not detected in our 325 MHz map nor is it visible in the NVSS map. The estimated fluxes for the eastern source at 610 and 1420 MHz are 0.52 ± 0.07 mJy and 0.25 ± 0.01 mJy which gives a spectral index of α ∼ −0.9 ± 0.1. No radio emission from the star-forming disc is detected.
UGC 1922: AGN activity has been observed in the optical spectrum of the galaxy by Schombert (1998). The galaxy hosted a Type Ia supernova, 1989S (Mueller et al. 1989). The galaxy has been detected in CO emission and the molecular gas (∼1.1 × 10⁹ M⊙) appears to be concentrated within the inner 30 arcsec of the disc (O'Neil & Schinnerer 2003). Diffuse X-ray emission has also been detected from the central parts of this galaxy (Das et al. 2009). This galaxy is classified as a member of the 37-member group LDCE 0163 (Crook et al. 2008).
Radio emission is detected from the central parts of the galaxy (Fig. 2a). Bright NUV emission is detected along the spiral arm situated in the north-east of the centre of the galaxy and from other compact regions. The central parts of the galaxy are bright in radio emission and NIR (Figs 2b–d). The 610 MHz image shows emission from the central part with an extension towards the south, close to the reported SN 1989S. The 1420 MHz image resolves the emission in the central part of this low-inclination galaxy into a mini-spiral in the centre with a bright peak. Interestingly two massive star-forming complexes located north-west of the centre of the galaxy are detected in the NUV and NIR. No radio continuum emission is detected in any of the observed radio bands.
UGC 2936: this galaxy is almost edge-on in morphology. The AGN in this GLSB galaxy was identified by Sprayberry et al. (1995). The AGN is detected in X-ray with a luminosity of 1.8 × 1042 erg s−1 (Das et al. 2009). A Type II supernova, SN 1991bd has been recorded in this galaxy (Mueller et al. 1991). Unlike most GLSB galaxies with bulges, it has a boxy/peanut-shaped bulge rather than a classical bulge. This suggests that the galaxy may be undergoing secular evolution of its bar into a boxy bulge (Raha et al. 1991).
The galaxy is observed at 1280 and 610 MHz with the GMRT. Faint NUV emission is detectable from the centre of the galaxy (Fig. 3a). The entire disc of the galaxy is detected in NIR and radio bands in addition to the intense emission from the active nucleus (Figs 3b and c). Good correlation is seen between the extent of the NIR and radio discs due to star formation.
UGC 4422: the AGN in this barred galaxy was identified by Schombert (1998). No X-ray emission has been detected from the centre of this galaxy with an upper limit of 1039 erg s−1 (Das et al. 2009). This galaxy hosted a Type Ia supernova SN 1999aa (Armstrong & Schwartz 1999). It is a member of the group LGG 159 (Garcia 1993) and LDCE 571 with 22 members (Crook et al. 2008).
The 610 MHz emission is confined to the central parts of the galaxy while bright NUV emission is observed along the spiral arms and to the west of the centre are also seen (Fig. 4a). The emission at 1420 MHz and 610 MHz is concentrated in the central parts of the galaxy while the 325 MHz emission extends along the spiral arms (Figs 4b–d). The 610 MHz image shows emission at the onset of the spiral arms in the north-west and south-east directions. Interestingly, the NIR emission from this galaxy is extended. The diffuse extended emission seen at 325 MHz along the spiral arms is not detected at 610 or 1420 MHz. The diffuse emission at 325 MHz in the southern arm has a brightness of 1.1 mJy beam−1 (see Fig. 4d). Using the 4σ limit of our low-resolution map at 610 MHz of 0.48 mJy beam−1; we estimate that the spectral index is <−1.3 for the diffuse emission. We made maps after excluding the shorter baselines to remove extended emission but did not detect an unresolved source in any of the wavebands.
The optical image of this galaxy shows a circumnuclear ring-like feature at the centre which is also discernible in our 1420 MHz image. To confirm its presence in our 1420 MHz image, we took a one-dimensional cut along right ascension (see Fig. 5). This shows the presence of three peaks; the outer ones likely define a ring surrounding the central peak which is likely the optical AGN. We measure the size of the ring ∼ 6 arcsec which at the distance of UGC 4422 corresponds to a diameter of 1.8 kpc. Comerón et al. (2010) detect a star-forming circumnuclear ring in their Hubble Space Telescope optical image of the galaxy. They estimate the semimajor axis of the ring to be 5.4 arcsec which corresponds to 1.6 kpc. A Type Ia supernova, SN 1999aa was reported in the northern part of the galaxy but we do not detect any radio emission from that region.
Malin 2: the nucleus of the galaxy shows AGN activity at optical wavelengths (e.g. Ramya et al. 2011). It has been detected in CO emission and the molecular gas (∼ 2.6 × 10⁹ M⊙) is found to extend towards the west in the galaxy disc (Das et al. 2006, 2010). It is not detected in the continuum at millimetre wavelengths (Das et al. 2006). This galaxy is classified as an isolated galaxy.
The central AGN is detected at 610 MHz with no radio emission associated with the intense star-forming disc that is detected in the NUV (Fig. 6a). Intense NUV emission indicates a recent burst of star formation that has been triggered in the galaxy. The south-western spiral arm shows a particularly vigorous burst of star formation. Unresolved emission from the centre of the galaxy is detected at all the three observed frequencies, i.e. 1280 MHz, 610 MHz and 240 MHz (Figs 6b–d). The NUV emission is intense and defines the spiral arms of the galaxy whereas the NIR emission is featureless with only an intense core being detected. A single power-law fit to the three radio points resulted in a spectral index of −0.23 ± 0.11 (Fig. 9d). However, the spectrum does not follow a simple power law as the spectral index between 610 and 1280 MHz is −0.44 ± 0.09 whereas between 240 and 610 MHz is −0.05 ± 0.01.
UGC 6614: this is a relatively well-studied GLSB galaxy with the AGN detected in mm-wave continuum (Das et al. 2006), optical (Schombert 1998; Ramya et al. 2011), X-ray (Naik et al. 2010) and NIR (Rahman et al. 2007) wavelengths. It has a low inclination and a large, prominent bulge surrounded by a faint ring-like structure (Rahman et al. 2007). This ring is clearly seen in the Spitzer NIR image (Hinz et al. 2007; Rahman et al. 2007) and simulations suggest that it is the result of galaxy collision in the past (Mapelli et al. 2008). The radio spectrum of the core between 100 and 1.4 GHz is found to be flat (Das et al. 2006). It has been detected in CO emission. The emission is detected offset from the galaxy centre and the molecular gas mass is ∼2.8 × 10⁸ M⊙ (Das et al. 2006). This galaxy is a member of the group LDCE 829 (Crook et al. 2007, 2008) which has three members.
Like Malin 2, NUV emission is detected over the entire disc with star formation seen in the ring and along the spiral arms of the galaxy (Fig. 7a). Radio emission at 610 MHz is mostly confined to the central region – from the AGN and extended along what appears to be jets/lobes along the north-west and south-east direction. No NUV emission is coincident with these features. Radio emission is detected from several compact regions near the central ring and along the spiral arms at 610 MHz. The emission is coincident with the NUV peaks indicating that its origin is star formation. Figs 7(b) and (c) show the zoomed-in contour images of the radio continuum emission from the galaxy at 1280 and 610 MHz superposed on the 2MASS NIR image in grey-scale. The AGN core is detected at 1280 MHz and NIR J band but no emission is detected from the radio jets/lobes. We detect a compact radio source to the north-west of the central core near right ascension 11h39m13|${^{\rm s}_{.}}$|75 and declination 17°9′13′′ at 610 MHz coincident with NUV emission. The estimated peak brightness of this source at 610 MHz is 0.9 ± 0.2 mJy beam−1. Using the 4σ limit at 1280 MHz of 0.24 mJy implies a spectral index steeper than −1.7 for this source. This appears to be steep for a star-forming region in the galaxy and might be a background radio source which shows a chance coincidence. With the current data, we are unable to comment on this region any further.
We estimate the peak flux density of the core to be 4.0 ± 0.6 mJy at 610 MHz and the spectral index of the AGN core between 610 and 1280 MHz, α ∼ +0.12 ± 0.05 (Table 5). We recall that the spectrum of the central AGN between 111 and 1.4 GHz was found to be flat by Das et al. (2006). The AGN is not detected in our 240 MHz map to a 4σ limit of 4.6 mJy and this is consistent with the estimated α. We also estimated the spectral index of the lobe emission as follows. We subtracted the core flux density at 1280 MHz of 4.4 mJy from the NVSS flux density of 7.5 mJy and assumed the remaining flux density as arising in the jets/lobes. In combination with the emission at 610 MHz obtained after subtracting the core emission from the total emission at 610 MHz we obtain the spectral index, α ∼ −1.06 ± 0.12 between 610 and 1280 MHz for the jets/lobes.
UM 163: this galaxy, also known as 2327−0244, was first studied by Sprayberry et al. (1995) and was found to host an AGN. The galaxy has a strong bar, a prominent bulge and two trailing spiral arms. Its morphology is similar to early-type spirals but its disc is low surface brightness in nature.
This galaxy is detected at all the observed frequencies. NUV emission is detected from the centre of the galaxy: from a ring close to the centre and along the spiral arms (Fig. 8a). The 610-MHz radio emission is confined mainly to the core of the galaxy with a 4σ extension seen towards the south. The radio emission is resolved at all the wavebands. The bar is prominent in the NIR image (Figs 8b–d). At 1420 MHz, the emission is extended towards the north-west. Our low-resolution image at 325 MHz shows the emission arising along the bar and also extended perpendicular to the bar. The emission is likely to be due to the AGN core and jets. The 610 MHz and the 1420 MHz maps are convolved to the resolution of the 325 MHz image to estimate the spectrum of emission. We estimate α ∼ −0.82 ± 0.03 which might indicate the dominance of lobe emission in the nuclear region. No emission at any radio frequencies is associated with the spiral arms.
5 DISCUSSION
Our objective of the present investigation is to study the low-radio-frequency spectrum of the central AGN, star-forming disc and the influence of the environment on our sample of GLSB galaxies using our high-resolution, high-sensitivity continuum images at 240, 325, 610 MHz and L band.
5.1 AGN in GLSB galaxies
We detect radio continuum emission from the centre of all seven galaxies in our sample. Our high-resolution data allow us to determine the core spectrum. We distinguish the spectrum as steep if α < −0.5 or flat if α ≥ −0.5; S ∝ να. In AGNs, compact flat-spectrum nuclear radio cores are widely accepted as the signature of synchrotron self-absorption. The radio spectra of the nuclear sources of the galaxies, UGC 1922, UGC 2936, UGC 4422, Malin 2 and UGC 6614 exhibit spectral indices ranging from α = +0.12 to −0.44. We interpret these flatter spectra as arising from the radio core. In case of UGC 1378 and UM 163, the spectrum is steeper. We note that in UGC 1378, the peak radio emission is displaced to the south of the optical centre indicating an origin distinct from the AGN. Only faint radio emission is detected from the optical centre which is likely to be due to the radio core. However, we are not able to estimate the spectral index of this source separately. In case of UM 163, it is likely that the radio emission includes contribution from the jets/lobes thus leading to its steep spectrum. We note that the flux density measured by NVSS is similar to our high-resolution L-band image (see Fig. 9f).
Recent studies show that only about 15–20 per cent of normal LSB galaxies host an AGN (Burkholder, Impey & Sprayberry 2001; Mei et al. 2009) and most appear to be associated with large bulges (Schombert 1998). The nuclear black hole masses of GLSB galaxies are relatively low and lie in the range 105–106 M⊙ (Ramya et al. 2011). GLSB galaxies lie below the MBH–σ relation followed by other galaxies (Ramya et al. 2011). Thus, though these galaxies are very massive, their AGN are less evolved than brighter galaxies on the M–σ correlation. This is possibly because the dark matter haloes in these galaxies inhibit the formation of disc instabilities that trigger star formation and lead to gas infall into their nuclear regions (Mayer & Wadsley 2004). The slower gas infall rate probably results in a lower AGN fuelling rate, which leads to lower nuclear black hole masses.
Thus, on the basis of an analysis of low-frequency radio data of a sample of seven GLSB galaxies with optically identified AGN, we find that five out of them have radio emission associated with AGN core having spectral indices ≥−0.44, thereby exhibiting signature of synchrotron self-absorption. Two galaxies of our sample, UGC 6614 and UM 163, appear to have additional emission from jets/lobes. However, higher resolution images are required to disentangle the contributions from the core of the AGN and the jets/lobes in these two cases.
5.2 AGN jets in GLSB galaxies
Radio jets are often considered to be tracers of AGN activity in the more massive radio galaxies even if the core is not detected. However, radio jets in spiral galaxies are relatively rare probably because their AGN are relatively weaker than those found in the more massive radio galaxies. Gallimore et al. (2006) studied a sample of 43 Seyfert galaxies and found that 19 (44 per cent) showed extended radio jets. In our sample of seven GLSBs, we clearly detect a jet in UGC 6614 and a jet-like feature is detected in UM 163. Thus, we detect jet-like features in two out of seven galaxies, i.e. about 28 per cent. However, the sample size needs to be increased to make a valid comparison. The Seyfert nucleus of the spiral NGC 4258 is one of rare examples of extended jets in spiral galaxies (Krause, Fendt & Neininger 2007) as is NGC 1275 (Perseus A). The jet length scales in UGC 6614 and UM 163 are 6.8 and 13 kpc, respectively, and both jets end well within the inner optical disc, which is similar to what is seen in other spirals (Laine & Beck 2008). The spectrum of emission from the jets in UGC 6614 has a spectral index of −1.06 ± 0.12. Thus, the radio properties of AGN in GLSB galaxies appear to be similar to that observed in brighter spiral galaxies.
5.3 Comparison with other wavebands
All the seven galaxies in our sample have GALEX UV and 2MASS NIR images. Surprisingly, five of the galaxies, UGC 1922, UGC 4422, Malin 2, UGC 6614 and UM 163 show bright NUV emission over their entire disc which could be due to a recent burst of massive star formation in the galaxy. All the galaxies show radio emission associated with the nuclear region, additionally UGC 2936 and UGC 4422 show radio emission associated with the star-forming disc. The NVSS flux densities at 1.4 GHz are higher than what we record in our high-resolution L-band images for many of the galaxies (see Table 5). We infer that the excess radio emission in most cases is from the disc of the galaxies. In particular, we find that more than half of the emission recorded by NVSS at 1.4 GHz is associated with a diffuse, disc component for UGC 4422, UGC 1378 and UGC 2936 (Table 5). On the other hand, 80 per cent of the total emission at 1.4 GHz from UGC 1922 and UM 163 and 50 per cent emission from Malin 2 and UGC 6614 arise in the active nucleus. All these galaxies show bright extended NUV discs indicating a recent burst (∼100 Myr) of star formation. This starburst is yet to result in sufficient number of supernova remnants required for the non-thermal radio emission to be detectable. The synchrotron lifetime is expected to be 100 Myr at 1.5 GHz if strength of magnetic field (B) is 5 μG (Condon 1992). Moreover, in case of UGC 4422, NUV, NIR and radio emission are all detected from the disc indicating continuous star formation in the galaxy. It would be interesting to derive estimates of the stellar ages in these galaxies.
We detect diffuse radio emission from the disc of UGC 2936. Faint NUV is detected from the centre of the galaxy. The presence of NIR emission and absence of NUV from the disc of the galaxy suggests an older burst of star formation, probably more than few Gyr ago. The star formation episode has since been quenched and the galaxy is not prominent in the NUV. No extended radio emission is detected from the discs of UGC 1922, Malin 2, UGC 6614 and UM 163.
The combination of our radio results with the NIR and NUV results seem to give support to the episodic star formation in our sample GLSB galaxies. It is not clear what leads to a starburst episode or what leads to it being quenched but the range of features displayed by our sample of GLSB galaxies suggests that these galaxies are intriguing and might likely be an evolutionary step for many ‘normal’ galaxies. GLSB evolve at a much slower rate because of the effect of the dominant dark matter haloes.
5.4 Star formation rate in GLSB galaxies
LSB galaxies generally have a lower SFR (∼0.2 M⊙ yr−1; McGaugh 1994) and lower metallicity than HSBGs. High-resolution imaging of star-forming regions in LSB galaxies show that their discs contain Hii regions that are very similar to those found in brighter galaxies (Schombert, McGaugh & Maciel 2013). Their discs are gas rich but the surface density is below the critical threshold for triggering star formation (van der Hulst et al. 1993; Pickering et al. 1997; Das et al. 2010). We estimated the SFR in the sample of our galaxies using the relation as given in Condon (1992) for M ≥ 5 M⊙ and the results are reported in Table 6. For this, we subtracted the flux density of the nuclear source as obtained from our high-resolution images at the L band from the flux density of the galaxy, estimated from the lower resolution NVSS image. We find that for UGC 1922 and UGC 2936, the flux densities estimated from our low-resolution GMRT maps are similar to the NVSS values. In UM 163, our low-resolution GMRT map gives a larger flux density than the NVSS map and for the remaining galaxies, the NVSS flux densities are larger. We assume that the excess NVSS emission is due to disc star formation, and non-thermal in nature. Using above flux densities and assuming the non-thermal spectral index α = −0.8, we estimated average SFRs listed in Table 6. The radio emission can be used as a direct probe of the very recent star-forming activity in normal and starburst galaxies. Nearly all of the radio emission at lower frequencies from such galaxies is synchrotron radiation from relativistic electrons and free–free emission from H ii regions. Massive stars (M ≥ 5 M⊙) produce the supernovae whose remnants (SNRs) accelerate the relativistic electrons and are used as a tracer of star formation. It may be noted from Table 6 that the SFRs of the sample galaxies range from 0.15 to 3.6 M⊙ yr−1 with five galaxies showing SFRs less than 1 M⊙ yr−1. For comparison, the SFRs that we obtained from literature which were estimated using either the UV or total infrared emission are also listed there. These range from 0.8 to 4.3 M⊙ yr−1. This suggests that the SFRs of these galaxies show a wide range similar to the HSBGs and are likely for different epochs.
Star formation rate and FIR-radio correlation (q) for galaxies.
| Galaxies | SFRNUVa | SFRTIR | L1.4 GHzd | SFR1.4 GHzd | SNRe | log FIR | q |
|---|---|---|---|---|---|---|---|
| (M⊙ yr−1) | (M⊙ yr−1) | 1021 (W Hz−1) | (M⊙ yr−1) | (yr−1) | 10−14(W m−2) | ||
| UGC 1378 | – | – | 1.2 | 0.28 | 0.01 | 6.19 | 2.3 |
| UGC 1922 | – | – | 3.1 | 0.75 | 0.03 | – | – |
| UGC 2936 | 0.84 | – | 10.0 | 2.45 | 0.12 | 28.42 | 2.2 |
| UGC 4422 | – | 2.80b | 2.9 | 0.70 | 0.03 | 6.68 | 2.2 |
| Malin 2 | 4.30 | – | 15.0 | 3.60 | 0.15 | – | – |
| UGC 6614 | – | 0.88c | 3.0 | 0.74 | 0.03 | – | – |
| UM 163 | 3.30 | – | 0.6 | 0.15 | 0.006 | 4.00 | 2.1 |
Notes.aSFRNUV taken from Boissier et al. (2008).
bSFRTIR estimated from the total IR luminosity (LTIR) using the relation between LTIR and SFRTIR (Bell 2003).
cSFRTIR taken from Rahman et al. (2007).
dL1.4 GHz and SFR1.4 GHz estimated from the difference between NVSS flux density and GMRT nuclear flux density listed in Table 5.
eSupernova rate and SFR1.4 GHz estimated using the relation given in Condon (1992).
Boissier et al. (2008) have examined the UV properties of a sample of 13 GLSB galaxies which include 3 galaxies from our sample; UGC 2936, Malin 2 and UM 163. Using GALEX data, they find that the UV discs of 9 out of their sample of 13 galaxies are extended and the FUV–NUV colours of these galaxies are redder than normal galaxies which they interpret as being due to episodic bursts of star formation. Four galaxies in our sample show bright NUV disc.
We estimated supernova rates which range from 0.006 to 0.15 yr−1 (see Table 6). For comparison, the supernova rate in M82 is 0.1 yr−1 (Condon 1992). Two of the galaxies in our sample, namely UGC 1922 and UGC 4422, have hosted a Type Ia supernova – SN1989s and SN1999aa, respectively. Since the progenitor system of these type of supernovae are believed to consist of a binary with a white dwarf member, it can indicate star formation which was triggered more than a few Gyr ago in these galaxies with the low-mass stars evolving into Type Ia supernovae. We note that NUV, NIR and radio continuum emission from the stellar disc are detected in the case of UGC 4422 which could indicate continuous star formation. In case of UGC 1922, most of the resolved radio continuum arises close to the centre of the galaxy. NUV is detected from arcs resembling spiral arms around the centre of the galaxy whereas diffuse NIR is detected from the centre of the galaxy and from a couple of massive star-forming regions to the north-east of the centre of the galaxy. On the other hand, UGC 2936 has hosted a core-collapse Type II supernova (SN 1991bd). We note that while the star-forming disc of UGC 2936 is detected in the radio and NIR bands, only faint NUV emission is detected from the centre of this galaxy (see Fig. 3a). This could indicate an older star-forming episode, say a few Gyr ago which would be responsible for the NIR emission and a more recent star-forming episode which would be responsible for the radio emission and the detected Type II supernova. Lack of NUV emission could indicate that the later star formation episode might have since been quenched. We note that it might be possible to verify these results by a detailed study of the age of the stellar populations in these galaxies which is beyond the scope of this paper. Group membership is confirmed for UGC 1922 and UGC 4422 whereas we could not find any information for UGC 2936 in literature. While this is a qualitative picture, a more quantitative picture of the multiband emission might be able to result in a more complete picture of the time-scales that the different diagnostics tracers.
Another measure of the AGN versus starburst nature of the radio emission is the FIR–radio correlation parameter q. The normal galaxies have a value of q = 2.35 (Condon 1992; Yun, Reddy & Condon 2001). We also estimated FIR–radio (1.4 GHz) correlation parameter q for our sample of galaxies. The FIR data for four of the sample galaxies, available from IRAS Faint Source Catalog (NED) are listed in column 7 of Table 6. We find the galaxies UGC 1378, UGC 2936, UGC 4422 and UM 163 in our sample follow the FIR–radio correlations although UM 163 has low q value (see Table 6).
5.5 The environment of GLSB galaxies and star formation
We examined the environment of the sample galaxies. Four of the sample galaxies are reported in literature to have group membership: UGC 6614 (LDCE 829), UGC 4422 (LGG 159, LDCE 571), UM 163 (LDCE 1583), UGC 1922 (LDCE 163). LDCE (Low Density Contrast Extended) groups have been catalogued by Crook et al. (2007, 2008) from 2MASS with the number of members ranging from 3 to 37.
A study of small-scale environment of GLSB galaxies (Bothun et al. 1993) has revealed that there is a deficit of galaxies located within 0.5 Mpc and within a velocity of 500 km s−1. The distance to the nearest neighbour for GLSB galaxies is about 1.7 times farther than for HSBGs (Bothun et al. 1993). Contrary to this, Sprayberry et al. (1995) inferred from their study that the small-scale environment of GLSB galaxies was similar to that of HSBGs. Thus, it is not clear if the unevolved LSB discs are due to the lack of nearby companions which would tidally trigger star formation.
UGC 4422, which is catalogued as a member of LGG 159 (Garcia 1993) is the only galaxy in our sample whose disc is bright in radio, NIR and NUV and hence is likely to be subjected to enhanced and possibly continuous tidal interactions which play an important role in the evolution of the galaxy. All the four galaxies which are in groups show an extended UV disc in the GALEX data indicating a recent burst of star formation. The tidal interaction in the group environs is likely responsible for this. Interestingly, UGC 1378 and UGC 2936, which are known not to have any group membership, the integrated radio emission appears to include large contribution from a star-forming disc. In UGC 2936, the observed faint NUV emission is interpreted as indicating an older episode of star formation. The only isolated GLSB galaxy which shows bright NUV emission is Malin 2 and the source of the trigger of star formation in this galaxy is likely internal. We note that, the discussion here supports the episodic star formation in GLSB galaxies with bursts of star formation followed by a quiescent phase as suggested by Boissier et al. (2008) from their GALEX UV study of 13 LSB galaxies.
6 CONCLUSIONS
We have mapped the radio continuum emission at the L band, 610, 325 and 240 MHz of a sample of seven GLSB galaxies using the GMRT. All the galaxies host an optically identified AGN. Below we give the summary of our results and list our main conclusions.
We detect compact radio emission from the centres of all the sample GLSB galaxies. The spectra of five galaxies (UGC 1922, UGC 2936, UGC 4422, Malin 2 and UGC 6614) have spectral indices ranging from 0.12 to −0.44 and that of the galaxies UGC 1378 and UM 163 exhibit a steeper spectrum. Two of the galaxies UGC 6614 and UM 163 show extended emission associated with their nuclei but show no correlation with star formation traced by other diagnostics. We interpret the extended emission as being due to the radio jets or lobes of the active nucleus. In UGC 6614, the radio jet extends out to a radius of 6.8 kpc and in UM 163, it extends out to 13 kpc. In both cases, the jet lies within the optical discs. Radio jets are relatively rare in spirals.
Diffuse radio continuum emission associated with star formation in the disc is detected from the galaxies UGC 2936 and UGC 4422 at one of our observed frequencies. We used our high-resolution maps at the L band and the NVSS maps at 45 arcsec resolution to separate the nuclear emission and disc emission. The radio emission outside the nucleus was presumed as being due to star formation and SFRs were found to range from 0.15 to 3.6 M⊙ yr−1.
All the galaxies in our sample have been observed in the UV by GALEX and in the NIR by 2MASS thus allowing us to make a multiwavelength study of this sample. All our sample galaxies have bulges that are prominent in NIR. Extended UV discs are detected in five galaxies namely UGC 1922, UGC 4422, Malin 2, UGC 6614 and UM 163. NIR disc/bar emission is detected from UGC 2936, UGC 4422 and UGC 1378. UGC 4422 is the only sample galaxy which shows extended UV discs and NIR dick/bar emission. We suggest that a recent burst of star formation has occurred in the five galaxies with extended UV discs out of which we find four reside in group environments. We find that most of the radio emission in UGC 1922 and UM 163 arises in the active nucleus. Since these two galaxies show bright NUV emission, this suggests a fresh star-forming episode. The massive stars are yet to evolve into supernovae and give rise to non-thermal emission. On the other hand, hardly any NUV emission is detected from UGC 2936 but the galaxy shows that more than 80 per cent of its L-band radio emission arises from its star-forming disc. This argues for a star formation episode which is more than 10–100 Myr old and has since been quenched. It would be interesting to estimate stellar ages in these galaxies to confirm this scenario.
The study of these seven galaxies suggests that the environment in which the galaxies are evolving is an important trigger for star formation. It would be interesting to extend this study and examine the environment of a large sample of GLSB galaxies which is now possible with several catalogue of groups of galaxies and of isolated galaxies. Finally, we speculate that the low surface brightness phase of evolution might be an important evolutionary step for most of the disc galaxies, especially for galaxies evolving in poor environment.
We feel highly obliged to the referee for constructive comments which has improved the original manuscript. We thank the staff of the GMRT who made the observations possible. The GMRT is operated by the National Centre for Radio Astrophysics (NCRA), Pune of the Tata Institute of Fundamental Research. AM would like to thank the NCRA-TIFR, Pune and Indian Institute of Astrophysics, Bangalore for hospitality. This research has made use of NASA/IPAC Infrared Science Archive, the NASA/IPAC Extragalactic Data base (NED), GALEX and 2MASS which is a NASA mission are operated by Jet Propulsion Laboratory, California Institute of Technology under contract with the National Aeronautics and Space Administration. We also like to acknowledge the site http://skyview.gsfc.nasa.gov/.
See http://galex.stsci.edu/GR6/?page=tilelist&survey=allsurveys.
aips (Astronomical Image Processing System) is distributed by the National Radio Astronomy Observatory (NRAO), which is a facility of the National Science Foundation operated under cooperative agreement by Associated Universities, Inc.
