


Abstract
We used Arecibo Observatory and the Green Bank Telescope to observe OH in 12 early-type galaxies with known reservoirs of dense gas. We present three new detections of OH in absorption in the 1667 MHz line. One objective of our survey was to find evidence of molecular outflows, but our sensitivity and the strength of the OH absorption were insufficient to detect outflows. The detected sources have infrared luminosities and dust temperatures among the lowest of any galaxy detected in OH absorption. The ratio LHCN/LCO, a measure of the dense gas fraction in galaxies, is a powerful selector of OH megamasers for galaxies with high infrared luminosity. In early-type galaxies, which have much lower infrared luminosities, LHCN/LCO is also a promising tool for discovering OH, but in absorption rather than in maser emission. In addition to dense molecular gas, a radio continuum source and a favourable line of sight to the observer are likely key factors in detecting OH absorbers.
1 INTRODUCTION
The first detections of OH outside the Milky Way were in the starburst galaxies NGC 253 and Messier 82 (Weliachew 1971). Both galaxies were originally seen only in absorption, but later observations revealed maser emission as well (Gardner & Whiteoak 1975; Nguyen-Q-Rieu et al. 1976). In the ultra-luminous infrared galaxy (ULIRG) Arp 220, Baan, Wood & Haschick (1982) discovered OH masing with a luminosity millions of times larger than any masers in the Milky Way. Arp 220 and similarly powerful OH maser galaxies are now called OH megamasers (OHMs). Subsequent surveys of OH targeted galaxies based on perceived similarity to the starburst galaxies in which OH was first detected. Criteria for inclusion in early surveys of OH include neutral hydrogen absorption, strong radio continuum, or prominent foreground molecular discs (e.g. Baan et al. 1985; Schmelz et al. 1986).
As more OHMs and absorbers were discovered, Baan (1989) showed that both populations had optically thick molecular clouds along the line of sight to a nuclear radio continuum source. The far-infrared (FIR) colours of the populations were distinct: masers occurred in galaxies with warm FIR colours, while galaxies with cooler FIR colours absorbed OH. Baan (1989) also found that OHM luminosity increased superlinearly with FIR luminosity, prompting surveys for OH targeting LIRGs (Darling & Giovanelli 2000, 2001, 2002). Darling (2007) found that in addition to high LFIR, OHMs have large dense gas fractions, as measured by LHCN/LCO, and suggested a threshold LHCN/LCO > 0.07 above which OHM emission is triggered.
The recent discovery of reservoirs of molecular gas in early-type galaxies (ETGs), including tracers of dense gas such as HCN, offers an opportunity to study OH in galaxies with properties of LFIR, LCO, and LHCN unlike any that have previously been observed. ETGs are one of two basic types of galaxies, with the other being late-type galaxies. Late-type galaxies have spiral structure and prominent discs, and are generally blue and star-forming. ETGs have ellipsoidal structure, and tend to be red and apparently passively evolving with limited star formation (e.g. Visvanathan & Sandage 1977; Bower, Lucey & Ellis 1992). While ETGs as a population appeared to be passive, many studies found signs of remnant cold gas reservoirs, and dust, in a subset of ETGs (Knapp, Turner & Cunniffe 1985; Knapp et al. 1989; Sage & Wrobel 1989; Welch & Sage 2003). Results from the ATLAS3D survey, a volume-limited survey of nearby ETGs (Cappellari et al. 2011), indicate that ETGs as a population can contain large reservoirs of gas, including H i, CO, HCN, and HCO+ (Young et al. 2011; Crocker et al. 2012; Serra et al. 2012). The complete CO survey finds that at least ∼20 per cent of ETGs have M(H2) >107 M⊙, with molecular gas reservoirs as large as ∼109 M⊙ in some ETGs (Young et al. 2011).
Though a small number of ETGs have been observed in OH, there has been no systematic search for OH in ETGs. Observations of OH in ETGs provide an opportunity to better understand the excitation of OH and test whether galaxies with high dense gas fractions can produce (weak) maser emission despite low-FIR luminosities. Studying OH in ETGs also has potential utility in understanding how star formation is quenched. Outflows of molecular gas are a promising means of removing star-forming material from galaxies and producing quenched systems, and there are indications that OH is a promising tracer of outflows in ETGs. Previous work has used OH as an outflow tracer, in both the ground state 18 cm OH lines (Baan, Haschick & Henkel 1989) and FIR OH lines (Sturm et al. 2011). While galaxies with OH outflow detections are primarily LIRGs, there are two ETGs that show evidence for outflows in CO (NGC 1266, Alatalo et al. 2011; and NGC 1377, Aalto et al. 2012), a detection of OH in absorption in NGC 1266 at 18 cm with τ ∼ 0.1 by Baan, Haschick & Henkel (1992) shows hints of broad wings in OH.
We aim to study the OH content and excitation in a population of galaxies in which there has been no systematic search for OH, while also using OH to search for evidence of outflows. We motivate our selection of sources in Section 2, and then describe the observations in Section 3. We present our results in Section 4, including three new detections of OH in absorption. In Section 5, we discuss how our detections and non-detections inform previous attempts to understand the presence and excitation of OH in galaxies. Finally, we briefly summarize our main results in Section 6.
2 SOURCE SELECTION
We selected sources from the ATLAS3D project, which is a multiwavelength survey of ETGs, defined to be types S0 and earlier (Cappellari et al. 2011). The work of Darling (2007) suggests that the LFIR and LHCN/LCO phase space is an important one to consider in understanding OH excitation in galaxies, so we focused on the subset of galaxies with detections in both CO(1–0) and HCN. LHCN/LCO is used as a dense gas tracer because HCN is excited at higher gas densities than CO(1–0). Gao & Solomon (2004) found that typical star-forming galaxies fall in a small range of dense gas fractions, with LHCN/LCO = 0.02–0.05, while (U)LIRGs have higher dense gas fractions, with LHCN/LCO > 0.06. The ETGs that Crocker et al. (2012) studied mostly had LHCN/LCO ratios in line with typical star-forming galaxies, but a few in the sample had ratios more typical of (U)LIRGs. Crocker et al. (2012) suggested that high LHCN/LCO in ETGs may reflect optical depth effects, but Alatalo et al. (2014c) find that LHCN/LCO likely still traces dense gas fraction in ETGs.
The large LFIR values of galaxies with OHMs distinguish them from the ETGs observed as part of the ATLAS3D survey. With low LFIR and cool dust temperatures, ETGs are unlikely to be able to radiatively pump the OH molecule (Lockett & Elitzur 2008). Nonetheless, the most dense gas-rich galaxies in the ATLAS3D survey are in a poorly explored area of the LFIR and LHCN/LCO phase space, providing a test for understanding OH excitation. The ATLAS3D galaxy with the highest dense gas fraction, NGC 1266, also shows evidence for an outflow, further motivating observing OH in galaxies with large LHCN/LCO. Thus, we selected 12 galaxies from the ATLAS3D survey with detections of CO(1–0) (Young et al. 2011) and HCN(1–0) (Crocker et al. 2012).1 We also chose galaxies with large enough radio continuum fluxes to detect absorption τ ∼ 0.1 with velocity resolution 10 km s−1 in an ∼2 h observation. All 12 sources are listed in Table 1, along with the gas properties measured in the ATLAS3D survey.
Properties of observed galaxies.
| Name | α | δ | vsys | ICO | IHCN | LHCN/LCO | F1.4 | LFIR | S25 μm | S100 μm |
|---|---|---|---|---|---|---|---|---|---|---|
| (J2000) | (J2000) | (km s−1) | (K km s−1) | (K km s−1) | (mJy) | (109 L⊙) | (Jy) | (Jy) | ||
| NGC 1266 | 03 16 00.8 | −02 25 38.4 | 2160 | 34.8 | 2.8 | 0.13 | 115.6 | 18 | 1.16 | 16.9 |
| NGC 3665 | 11 24 43.6 | +38 45 46.1 | 2040 | 12.0 | 0.49 | 0.07 | 112.2 | 5.3 | 0.16 | 7.5 |
| NGC 5866 | 15 06 29.6 | +55 45 47.9 | 760 | 21.6 | 0.84 | 0.06 | 21.8 | 2.7 | 0.21 | 16.9 |
| NGC 2764 | 09 08 17.4 | +21 26 36 | 2707 | 16.2 | 0.28 | 0.03 | 28.1 | 10 | 0.48 | 7.2 |
| NGC 3032 | 09 52 08.1 | +29 14 10 | 1549 | 8.3 | 0.27 | 0.05 | 7.2 | 1.8 | 0.19 | 4.7 |
| IC 676 | 11 12 39.8 | +09 03 21 | 1429 | 11.6 | 0.27 | 0.04 | 9.7 | 3.1 | 0.81 | 4.9 |
| NGC 3607 | 11 16 54.6 | +18 03 06 | 935 | 10.4 | 0.73 | 0.11 | 7.2 | 1.0a | – | – |
| NGC 4459 | 12 29 00.0 | +13 58 42 | 1169 | 10 | 0.59 | 0.10 | 1.8b | 1.0 | 0.30 | 4.8 |
| NGC 4526 | 12 34 03.0 | +07 41 57 | 697 | 22 | 1.75 | 0.13 | 12.0 | 3.4 | 0.43 | 17.1 |
| NGC 4710 | 12 49 38.8 | +15 09 56 | 1133 | 32 | 1.41 | 0.07 | 18.7 | 3.2 | 0.46 | 14.8 |
| UGC 09519 | 14 46 21.1 | +34 22 14 | 1665 | 12.6 | 0.29c | < 0.03 | 0.4d | 0.6 | <0.10 | 0.94 |
| NGC 7465 | 23 02 01.0 | +15 57 53 | 1974 | 11.9 | 0.13 | 0.015 | 19.1 | 7.6 | 0.49 | 8.2 |
Notes. At the top, the three galaxies observed with the GBT. NGC 1266 is the only ATLAS3D galaxy previously observed in OH. Below, the nine ETGs observed with Arecibo. 11 of the galaxies were detected in HCN, while UGC 09519 has an upper limit in HCN, and was detected in HCO+. CO fluxes are from Young et al. (2011) and HCN fluxes are from Crocker et al. (2012). Except where noted, infrared fluxes are from IRAS, and LFIR is calculated according to Sanders & Mirabel (1996). Integrated 1.4 GHz flux densities come from NVSS (Condon et al. 1998), except where noted; all radio structure is unresolved for the resolution of NVSS.
aEstimated from AKARI fluxes, as it was not observed by IRAS.
bFrom Becker, White & Helfand (1995), this source was included in our survey due to mistakenly transcribing its radio flux density.
cMeasured fluxes are for HCO+ rather than HCN.
dThis source was included in the survey because we used the 2.2 GHz flux, 4.2 mJy, from Dressel & Condon (1978). More recent observations by Nyland et al. (in preparation) find the lower flux density given here.
3 OBSERVATIONS AND DATA REDUCTION
We used the L-band wide receiver at Arecibo Observatory2 to observe nine ETGs at declinations −1°20′<δ < +38°02′. For three sources outside of this declination range, we used the Green Bank Telescope (GBT),3 and selected the L-band receiver and the GBT Spectrometer in spectral line mode. For both telescopes, we observed in full-Stokes mode. Though we did not expect to detect polarized emission, full-Stokes data are often useful for radio frequency interference (RFI) identification.
The ground state of OH has four lines at wavelengths ∼18 cm as a result of Λ-doubling and hyperfine splitting. There are two ‘main’ lines at 1665 and 1667 MHz, and two ‘satellite’ lines at 1612 and 1720 MHz. For OH in thermal equilibrium, the expected ratio of line strengths for the 1612:1665:1667:1720 MHz lines is 1:5:9:1. Main lines are typically the target of 18 cm OH observations because of their strength, but the spectrometers for both Arecibo and the GBT can be configured to capture four subbands within the L band. We set the subbands to observe the H i line, both OH main lines, the 1612 MHz OH line, and the 1720 MHz OH line. For Arecibo, each subband was 12.5 MHz wide with 2048 channels, which provides a velocity resolution of ∼1 km s−1; the GBT subbands were 12.5 MHz wide with 4096 channels, corresponding to a ∼0.5 km s−1 velocity resolution.
The sources are all unresolved for the 3 arcmin beam of Arecibo and the 8 arcmin beam of the GBT. We observed each source for ∼2 h, split equally on and off source. We position switched at intervals of 4 min for Arecibo and 2 min for the GBT, using off-source positions that were 0h04m in right ascension behind the source positions. For both, we took integration times of 1 s, to allow editing of short-time-duration RFI. We visually inspected all data in frequency/time space, flagging integrations with significant noise or structure, or with strong polarized emission. We then calibrated the data using the rhstk software package (Heiles et al., in preparation). We adopted gains of 10 K Jy−1 for Arecibo4 and 2 K Jy−1 for the GBT5 to convert system temperatures to flux densities.
As a measure of the sensitivity of our observations, Table 2 shows the ratio of the rms noise in channels with widths Δv ∼10 km s−1 to the radio continuum for each of the observed sources. We chose ∼10 km s−1 because up to that resolution, noise is roughly Gaussian (binning channels reduces the noise as |$\sqrt{\Delta v}$|), whereas there can be minor bandpass structure for larger widths. We can detect absorption with smaller average optical depth over the line than the ratio of rms to continuum flux, as absorption features have widths ∼200 km s−1.
Optical depth sensitivity.
| rms/continuum | |||
|---|---|---|---|
| NGC 3665 | 0.09 | ||
| NGC 5866 | 0.045 | ||
| IC 676 | 0.037 | ||
| NGC 2764 | 0.017 | ||
| NGC 3032 | 0.037 | ||
| NGC 3607 | 0.044 | ||
| NGC 4459 | 0.06 | ||
| NGC 4526 | 0.025 | ||
| NGC 4710 | 0.020 | ||
| NGC 7465 | 0.016 | ||
| UGC 09519 | 0.17 |
| rms/continuum | |||
|---|---|---|---|
| NGC 3665 | 0.09 | ||
| NGC 5866 | 0.045 | ||
| IC 676 | 0.037 | ||
| NGC 2764 | 0.017 | ||
| NGC 3032 | 0.037 | ||
| NGC 3607 | 0.044 | ||
| NGC 4459 | 0.06 | ||
| NGC 4526 | 0.025 | ||
| NGC 4710 | 0.020 | ||
| NGC 7465 | 0.016 | ||
| UGC 09519 | 0.17 |
Notes. The values for the ratio of the rms noise to the continuum flux correspond to channels with widths ∼10 km s−1. We can detect smaller optical depths than the values in the table; this metric simply compares the relative sensitivity to absorption sources with differing continuum fluxes, integration times, and telescopes. The top two sources were observed with the GBT; the remainder were observed with Arecibo. NGC 1266 is omitted from the table, due to severe non-astrophysical structure in the spectrum.
4 RESULTS
We detected OH absorption for the first time in NGC 4526, NGC 4710, and NGC 5866, and re-detected absorption in NGC 1266. The properties of the detections are presented in Table 3. All detections are in the main lines; we did not detect satellite lines in any source. For each absorption line of newly detected sources, we use bootstrap resampling to estimate the error in the measured optical depth. The ‘measurements’ from which we generate bootstrap samples are individual on/off scans (sampled every 4 min for Arecibo and every 2 min for the GBT; see McBride & Heiles 2013 for more detail). For each Arecibo source, we had ∼20 ‘measurements’ (∼40 for the GBT), which we then resampled 1000 times. While one of our motivations was to search for outflows in OH, we did not have the sensitivity to detect any evidence of outflows. In the following subsections, we discuss each detection individually and present spectra of the new detections.
OH properties of detected galaxies.
| vsys | vabs | |$\bar{\tau }_{1667}$| | |$\bar{\tau }_{1665}$| | N(OH)/Tex | |
|---|---|---|---|---|---|
| (km s−1) | (km s−1) | (1015 cm−2 K−1) | |||
| NGC 1266 | 2160 | 2000–2400 | 0.07 | 0.04 | 7.2 |
| NGC 4526 | 697 | 597–797 | 0.026 ± 0.008 | 0.003 ± 0.009 | 1.3 ± 0.4 |
| NGC 4710 | 1133 | 1053–1213 | 0.033 ± 0.006 | 0.004 ± 0.007 | 1.3 ± 0.2 |
| NGC 5866 | 760 | 720–840 | 0.08 ± 0.01 | 0.04 ± 0.01 | 2.3 ± 0.3 |
Notes. The velocity range of absorption, vabs, is determined by eye, and the ranges in this table corresponded to the region between dash–dotted lines in Figs 1–3. |$\bar{\tau }$| is the average optical depth within the given velocity range. We do not use bootstrap resampling to calculate error estimates for NGC 1266 for two reasons: there were only a few usable scans, and we can only distinguish absorption from non-astrophysical structure in the spectrum by comparison with the results of Baan et al. (1992). The values of τ we measure for NGC 1266 are consistent with Baan et al. (1992).
4.1 NGC 1266
NGC 1266 is a nearby FIR-bright ETG that appeared to be a passive S0 galaxy, until Alatalo et al. (2011) showed that NGC 1266 contained a mass-loaded molecular outflow and a dense molecular gas core. It also shows signs of star formation suppression as a result of AGN activity (Alatalo et al. 2014a,b).
Baan et al. (1992) detected OH absorption with asymmetric structure extending to the red for both OH main lines in NGC 1266. Some sources similar to NGC 1266 in FIR colour and luminosity, and with smaller dense gas fractions, have narrow maser emission in their absorption profiles. We re-observed NGC 1266 hoping to improve upon the signal-to-noise ratio (SNR) of the original detection and potentially see evidence for masers or OH in outflow. Due to instrumentation issues, our data were of much poorer quality than the original spectrum. We use the literature data for subsequent discussion.
4.2 NGC 4526
NGC 4526 is a member of the Virgo cluster. It was originally imaged by Young, Bureau & Cappellari (2008), who found CO(1–0) emission that appeared to be in a disc configuration, although the unsharp-masked Hubble Space Telescope image showed dust that appeared to be a ring. Higher resolution CO(2–1) observations supported evidence for the ring, and also found resolved giant molecular clouds near the centre of the galaxy (Davis et al. 2013).
We marginally detect absorption in the 1667 MHz OH line in NGC 4526. The spectra of both main lines are shown in Fig. 1. For the 1667 MHz line, we measured an average optical depth |$\bar{\tau }_{1667}= 0.026 \pm 0.008$| between the region marked by black dash–dotted lines. We do not detect the 1665 MHz line. Though this detection is not visually convincing, two pieces of evidence suggest weak absorption. We randomly selected other velocity ranges in the spectrum of NGC 4526 over which to calculate an optical depth of absorption and estimate errors; we did not find other features with non-zero τ. We also convolved the spectrum with tophat filters with widths 100, 125, 150, … , 400 km s−1. We calculated a τ at each lag using the continuum flux across the whole spectrum and the flux within the tophat. This procedure produced a peak in τ at a velocity within a few km s−1 of the velocity of NGC 4526 for all tophat widths <250 km s−1. For these tophat widths, the τ at the velocity of the galaxy was a factor of ∼3 larger than τ at any other local maximum in the convolved spectrum.
We also detected H i, likely from a high velocity cloud in the Milky Way, in the spectrum of NGC 4526. We discuss this detection in Appendix A.
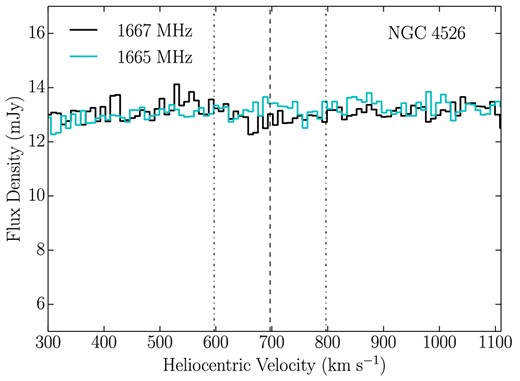
Profile of NGC 4526. Here, and in Figs 2 and 3, the 1667 MHz (solid black) and 1665 MHz (solid cyan) lines are shown. A dashed black line shows the heliocentric velocity of the galaxy. The bounds of 1667 MHz absorption, identified by eye, are marked with thin black dash–dotted lines. For NGC 4526, the spectra are binned into channels with widths of 8.9 km s−1.
4.3 NGC 4710
NGC 4710 is an edge-on galaxy at the outskirts of the Virgo cluster, and has a prominent molecular gas bar (Alatalo et al. 2013). The spectra for the OH main lines are shown in Fig. 2. Within the dash–dotted lines, we find an average optical depth |$\bar{\tau }_{1667}= 0.033 \pm 0.006$| for the 1667 MHz line. The 1667 MHz line has roughly symmetric structure, with equal absorption (within error) above and below the system velocity. The average optical depth for the 1665 MHz line is consistent with a non-detection. However, there is tentative evidence that the 1665 MHz line absorbs more strongly at velocities redshifted relative to the velocity of the galaxy. For v = 1133–1213 km s−1, |$\bar{\tau }_{1665}= 0.015 \pm 0.007$| and |$\bar{\tau }_{1667}= 0.030 \pm 0.009$|, giving a 1667/1665 ratio 2 ± 1. For v = 1053–1133 km s−1, |$\bar{\tau }_{1665}= -0.01 \pm 0.01$| and |$\bar{\tau }_{1667}= 0.035 \pm 0.009$|.
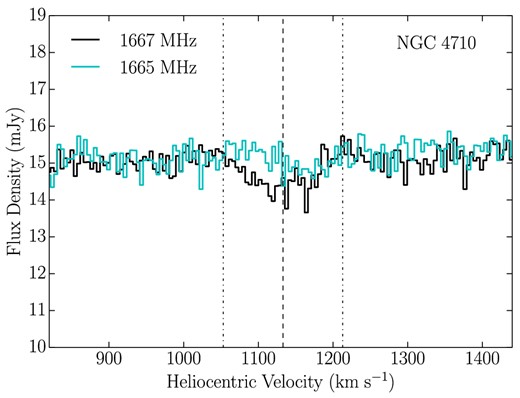
Profile of NGC 4710. Labels are the same as in Fig. 1. The OH spectra are binned into channels with widths of 4.5 km s−1.
For OH in local thermodynamic equilibrium (LTE), the 1667/1665 ratio ranges from 1 to 1.8 depending upon optical depth. Diffuse OH that is not in LTE can produce a 1667/1665 absorption ratio that exceeds 1.8. There are some examples of 1667/1665 ratios moderately larger than 1.8 in other galaxies (Baan et al. 1985; Schmelz et al. 1986), and larger departures from LTE have been observed in diffuse clouds in the Milky Way (Dickey, Crovisier & Kazes 1981). With large uncertainties, we cannot definitively identify OH in different phases, but the observed spectrum is consistent with absorption from v = 1133 to 1213 km s−1, from a denser OH phase in LTE, and an OH phase at v = 1053–1133 km s−1 that is not in LTE.
4.4 NGC 5866
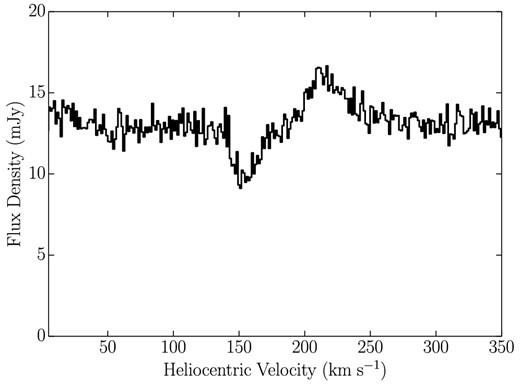
NGC 5866 is a nearby edge-on S0 field galaxy that has a strong bar in molecular gas (Alatalo et al. 2013). Fig. 3 shows the OH main lines for NGC 5866. Of the three new detections, NGC 5866 is the highest SNR, and the only source for which the structure in both the 1665 and 1667 MHz lines is visibly similar. The average optical depths in the region between the dash–dotted lines in Fig. 3 are |$\bar{\tau }_{1667}= 0.08 \pm 0.01$| and |$\bar{\tau }_{1665}= 0.04 \pm 0.01$|. The 1667/1665 ratio is 2.0 ± 0.5 consistent with absorption by optically thin OH, though the uncertainty is too large to rule out absorption by optically thick OH. The optical depth appears to be double peaked, and asymmetric, with stronger absorption from the component redshifted with respect to the velocity of the galaxy. This is consistent with the presence of two velocity structures in the gas along the line of sight and the observed bar morphology. The bar drives gas to inflow to the nucleus, producing the redshifted component, while absorption in the blueshifted component occurs in the disc (Alatalo et al. 2013).
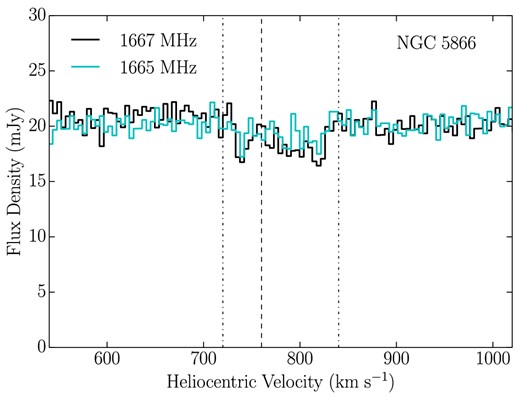
Profile of NGC 5866. Labels are the same as in Fig. 1. The OH spectra are binned into channels with widths of 4.5 km s−1.
5 DISCUSSION
We detected OH in absorption for the first time in three galaxies: NGC 4526, NGC 4710, and NGC 5866. The sources with new detections generally have good sensitivity to absorption, but sensitivity alone does not account for the detections; multiple sources with comparable absorption sensitivity (i.e. IC 676, NGC 2764, NGC 3032, NGC 7465) are non-detections. The overall detection rate, 3/11, compares favourably with past surveys of OH (Baan et al. 1992; Darling & Giovanelli 2002), though our sensitivity was also better. The ETGs that we observed have values of LFIR, LCO, and LHCN that are unlike any previously observed sample, and suggests that it is feasible to discover OH in a wider range of galaxies than the previous work indicated. In particular, the only previously detected OH absorber with smaller LIR than the three new OH absorption detections is NGC 5363.
5.1 The role of FIR luminosity and dense gas fraction in detecting OH
In examining the excitation of OH in galaxies, Baan (1989) looked at the dust temperatures and IR luminosities of OH absorbers and masers. In Fig. 4 here, we update fig. 2 from Baan (1989). All of our sources fall below and to the left of the dashed line that Baan (1989) drew separating masers and absorbers. Along with low LIR relative to previously detected OH absorbers, our galaxies also have very cool dust temperatures.6 Thus, our detection of absorption, rather than maser emission, agrees with the conclusions of Baan (1989).
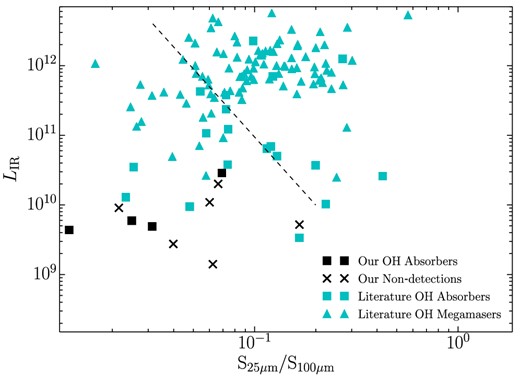
Update of fig. 2 from Baan (1989), with our new observations added, as well as additional observations from the literature since his work. The ratio of the 25 μm flux to the 100 μm flux, log (S25 μm/S100 μm), is an indication of the dust temperature, with larger values for warmer dust. The dashed line marks the separation between OHMs and absorbers that Baan (1989) identified. Non-detections of OH from the literature are not shown, as they greatly outnumber detections of absorption or maser emission, and make the figure more difficult to read.
Darling (2007) argued that high dense gas fraction drives OHM activity more than large LFIR, as half of galaxies with LHCN/LCO > 0.07 hosted OHMs. Our sample included four ETGs above that threshold, and in three of these we detected absorption. Along with two other previously known OH absorbers, there are now five sources with LHCN/LCO > 0.07 that absorb OH. These are shown in Fig. 5 (an updated version of fig. 2 from Darling 2007). As even ETGs with large LHCN/LCO have much smaller gas reservoirs than LIRGs, the physical conditions of our OH detections are different from typical LIRGs. The ETGs in our sample mostly fall below the LFIR–LHCN relation in Gao & Solomon (2004). We can apply the model relating LFIR and LCO from Krumholz & Thompson (2007) to estimate mean H2 densities in ETGs and OHM hosts. This procedure suggests that the ETGs with large LHCN/LCO have mean H2 densities somewhat lower than most OHM hosts with similar values of LHCN/LCO, and in a smaller volume of gas. Nevertheless, the mean H2 densities in the ETGs are still comparable to the least dense of the OHM hosting LIRGs. This indicates that detecting exclusively absorption in ETGs with high LHCN/LCO is a result of how much less FIR luminous ETGs are than the galaxies that Darling (2007) considered. Dense gas can only trigger OHMs in systems with the high dust temperatures and FIR fluxes required to radiatively pump OH (Lockett & Elitzur 2008).
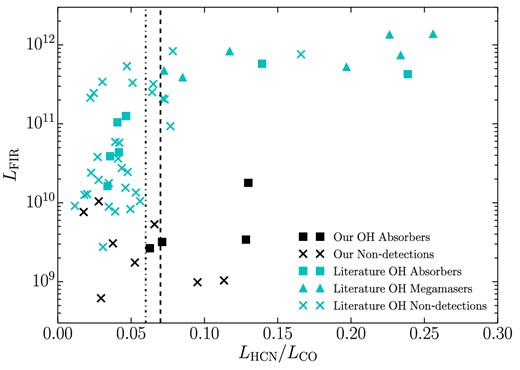
Update of fig. 2 from Darling (2007), with our new observations added. The target galaxies fall in an unexplored part of this phase space, at lower LFIR, but with moderate to large LHCN/LCO. The black dashed line at LHCN/LCO = 0.07 shows the threshold that Darling (2007) identified for producing OHMs. The dash-dotted line at LHCN/LCO = 0.06 shows the separation between normal star-forming galaxies and LIRGs that Gao & Solomon (2004) identified.
The four detections of OH absorption in this survey occurred among the seven largest LHCN/LCO ratios, and with LHCN/LCO near or above the threshold identified by Darling (2007). Compared to the rest of our sample, the detected galaxies had average LFIR and relatively cool dust temperatures. These results suggest that LHCN/LCO is a useful diagnostic for identifying systems with OH, either in absorption or emission, regardless of LFIR, but dust temperature and LFIR are important in determining whether OH will be seen in absorption or maser emission.
5.2 Comparison of observed galaxy properties
NGC 1266 is much more akin to ‘typical’ OH absorbers, with strong radio continuum (Nyland et al. 2013), an AGN-driven molecular outflow, and the largest LFIR in our sample. For these reasons, NGC 1266 is the least surprising OH detection. The following discussion therefore focuses on the remaining ETGs in the sample.
Though absorption sensitivity improves with larger radio continuum fluxes, the varying sensitivity of our observations is not a significant determinant of whether a galaxy was detected or not. Table 2 shows that detections and most non-detections have comparable ratios of rms error to continuum flux. A favourable alignment between gas and radio continuum is more important than having a large radio continuum flux. While many of our sources have radio jets, all but NGC 3665 are core-dominated (Nyland et al., in preparation). Thus, centrally concentrated gas morphologies, and edge-on inclinations, are important for producing OH absorption.
Alatalo et al. (2013) used CARMA to image molecular gas and discuss gas morphology for all the sources in our survey. Two of the three detected galaxies (NGC 4710 and NGC 5866) have bar+ring morphologies. Though NGC 4526 has a disc morphology, Davis et al. (2013) showed that it has a nuclear ring. Among eight non-detections, only one, NGC 2764, is a bar+ring galaxy, and it also has a low LHCN/LCO. All other non-detected galaxies were either disc morphologies or mildly disrupted (minor merger-like). Bar systems are capable of funnelling gas into the centre of galaxies, which could explain the presence of sufficient gas near the radio continuum emitting source to produce OH absorption. Using inclination angles reported in Davis et al. (2011) (for NGC 5866, instead see Alatalo et al. 2013), we find that all three OH detections have i > 80°. The non-detections had inclination angles ranging between i = 35° and 70°, much more face-on than the detected objects. Thus, all OH detections have molecular gas coincident with the radio continuum emission along the line of sight.
Altogether, OH absorption requires three interrelated elements: dense molecular gas along the line of sight to a radio continuum source. Favourable lines of sight can be produced by edge-on inclinations (e.g. NGC 5866) or gas immediately surrounding the radio continuum source (e.g. NGC 1266). These conditions are satisfied in a wider range of galaxies than have been previously targeted in observations of OH.
5.3 OH abundances
The abundance of OH relative to H2 has not been well characterized in many astrophysical environments, and represents a significant uncertainty in converting measurements of OH to estimates of mass outflow rates in galaxies (e.g. Sturm et al. 2011). Though the physical conditions in outflows likely differ from the conditions experienced by OH we detected, it is useful to expand the range of conditions for which estimates of OH abundances exist. We provide estimates of OH/H2 ratios for galaxies with detected OH in Table 4.
OH/H2 for detected galaxies.
| N(OH) | N(H2) | N(OH) / N(H2) | |
|---|---|---|---|
| (1016 cm−2) | (1022 cm−2) | (10−7) | |
| NGC 1266 | 14 | 390 | 0.4 |
| NGC 4526 | 2.6 | 3.5 | 7 |
| NGC 4710 | 2.6 | 8.6 | 3 |
| NGC 5866 | 4.6 | 9.0 | 5 |
| N(OH) | N(H2) | N(OH) / N(H2) | |
|---|---|---|---|
| (1016 cm−2) | (1022 cm−2) | (10−7) | |
| NGC 1266 | 14 | 390 | 0.4 |
| NGC 4526 | 2.6 | 3.5 | 7 |
| NGC 4710 | 2.6 | 8.6 | 3 |
| NGC 5866 | 4.6 | 9.0 | 5 |
H2 columns were derived from the CO(1–0) measurements of Alatalo et al. (2013) along the line of sight to the radio continuum source from Nyland et al. (in preparation). The brightness temperature in the integrated intensity map was taken in the pixel corresponding to the radio point source, and converted into N(H2) using the XCO = 2 × 1020 cm2 (K km s−1)−1 conversion factor (Bolatto, Wolfire & Leroy 2013). We take only the central pixel corresponding to the radio point source because the OH absorption occurs against the nuclear radio continuum. To calculate an OH column density, we assume an excitation temperature Tex = 20 K for all galaxies, based on previous work that has assumed values Tex ∼ 10–40 K (e.g. Baan et al. 1985; Omar et al. 2002). We estimate 50 per cent uncertainty in the H2 column densities, which is dominated by systematic uncertainty in XCO and in absolute flux calibration. For the OH column densities, we estimate a factor of 2 uncertainty, dominated by the assumed Tex. Altogether, we take a factor of 3 uncertainty in the ratio of OH/H2.
Our estimates of N(OH)/N(H2) range from 0.4 to 7 × 10⁻⁷, with the OH abundance in NGC 1266 well below the abundance in the other detected galaxies. We attribute the discrepancy to either an unusual OH abundance or a significantly different excitation temperature than we assumed, as we consider an unusual value of XCO in NGC 1266 unlikely (Alatalo et al. 2011). If the excitation temperature of OH is higher in NGC 1266 than in the other galaxies, then we will have underestimated the OH abundance. Given evidence for shocks in NGC 1266 (Pellegrini et al. 2013), a higher excitation temperature than the 20 K we assumed is likely, though shocks can also enhance OH abundance (Wardle 1999).
Unfortunately, more detailed interpretation of these values is difficult. In addition to uncertainty in our abundance measurements, models of molecular abundances can produce similar predictions for OH abundances in different conditions. For instance, it is possible to produce N(OH)/N(H2) ∼10−7 in models characteristic of dense clouds (|$n_{\rm H_2} \sim 10^4$|–106 cm−3) in the Milky Way (e.g. Bergin, Langer & Goldsmith 1995; Sternberg & Dalgarno 1995), or in models of more diffuse clouds (e.g. van Dishoeck & Black 1986), with |$n_{\rm H_2} \sim 10^3$|. Our measured abundances are thus consistent with gas in either diffuse or dense phases.
6 CONCLUSIONS
We observed OH in ETGs with significant reservoirs of molecular gas, as measured by HCN and CO. This selection of galaxies produced three new detections of OH in absorption, out of a total of 11 sources that were observed in OH for the first time. One goal of this study was discovering outflowing gas, but the SNR of the detected sources was inadequate to see evidence of outflows, such as broad absorption wings. Our results do suggest an approach to future discovery of OH in ETGs in galaxies unlike those typically targeted for observations of OH. Including NGC 1266, which had previously been detected, our four absorption detections occurred among the seven galaxies with the highest ratios of LHCN/LCO. All of the sources in the sample, including the detections, are among the least FIR luminous sources with observations of OH. Both large LFIR and large LHCN/LCO appear necessary to produce large-scale masing in galaxies. A combination of dense gas, a radio continuum source, and a favourable line of sight (either through galaxy inclination or proximity of gas to the continuum source) improves the likelihood of detecting OH absorption.
We are grateful to the referee for thoughtful comments that improved the content and clarity of the paper. We thank Andrew Siemion for assistance observing remotely with the GBT, and Carl Heiles and Leo Blitz for useful discussions. JM received support from a National Science Foundation Graduate Research Fellowship. KA is supported by funding through Herschel, a European Space Agency Cornerstone Mission with significant participation by NASA, through an award issued by JPL/Caltech. This research used NASA Astrophysics Data System Bibliographic Services, the SIMBAD data base, operated at CDS, Strasbourg, France, and the NASA/IPAC Extragalactic Database (NED), which is operated by the Jet Propulsion Laboratory, California Institute of Technology, under contract with NASA.
One galaxy, UGC 09519, was detected in HCO+, but not in HCN.
The Arecibo Observatory is operated by SRI International under a cooperative agreement with the National Science Foundation (AST-1100968), and in alliance with Ana G. Méndez-Universidad Metropolitana, and the Universities Space Research Association.
The GBT is operated by the National Radio Astronomy Observatory, which is a facility of the National Science Foundation operated under cooperative agreement by Associated Universities, Inc.
See listing for Rcvr1_2 at http://www.gb.nrao.edu/∼fghigo/gbtdoc/sens.html
REFERENCES
APPENDIX A: DETECTION OF H i FROM A HIGH VELOCITY CLOUD IN THE NGC 4526 SPECTRUM
We detect H i in the spectrum for NGC 4526, though not H i associated with the galaxy itself. To our knowledge, the best upper limit on the H i mass in NGC 4526 is from Lucero & Young (2013). They used the Very Large Array to place an upper limit of 1.9 × 10⁷ M⊙ on the H i mass in NGC 4526. We follow the same procedure they used for estimating the H i mass upper limit, and find MH I < 9 × 10⁶ M⊙.
Though we did not detect H i associated with NGC 4526, we do see an apparent absorption/emission feature centred at a velocity of ∼200 km s−1, shown in Fig. A1. In observations towards SN 1994D, for which NGC 4526 is the apparent host galaxy, King et al. (1995) observed Na and Ca in absorption from high-velocity clouds (HVCs) over a velocity range v = 204–254 km s−1. Wakker (2001) observed SN 1994D at 21 cm as part of a survey of HVCs, but did not have sufficient sensitivity to detect the cloud in H i.
The velocity range over which we observed emission corresponds reasonably well with the velocity where Na and Ca occurred, and thus we interpret our apparent absorption/emission as a result of the HVC appearing in both our on and off spectra, and velocity structure in the cloud. From our detection, we estimate a column density N(H i) ∼2 × 1018 cm−2, though the column density may be higher if weak emission in the off spectrum occurs at the velocity of emission in the on spectra.
The H i spectrum for NGC 4526 includes the apparent absorption/emission profile seen here. We interpret the apparent absorption as emission in the position-switched off spectrum, which is then subtracted in generating the calibrated spectrum.
