


Abstract
We present follow-up radio observations of ESO 243-49 HLX-1 from 2012 using the Australia Telescope Compact Array (ATCA) and the Karl G. Jansky Very Large Array (VLA). We report the detection of radio emission at the location of HLX-1 during its hard X-ray state using the ATCA. Assuming that the ‘Fundamental Plane’ of accreting black holes is applicable, we provide an independent estimate of the black hole mass of |$M_{\rm {BH}}\le 2.8^{+7.5}_{-2.1} \times 10^{6}$| M⊙ at 90 per cent confidence. However, we argue that the detected radio emission is likely to be Doppler-boosted and our mass estimate is an upper limit. We discuss other possible origins of the radio emission such as being due to a radio nebula, star formation, or later interaction of the flares with the large-scale environment. None of these were found adequate. The VLA observations were carried out during the X-ray outburst. However, no new radio flare was detected, possibly due to a sparse time sampling. The deepest, combined VLA data suggest a variable radio source and we briefly discuss the properties of the previously detected flares and compare them with microquasars and active galactic nuclei.
1 INTRODUCTION
Identifying intermediate-mass black holes (IMBHs; MBH = 102–105 M⊙) or their hosts is not straightforward (Miller & Colbert 2004). The observational examples that are closest to this IMBH mass range are often termed as massive black holes (MBHs) and often considered to be in a range of 105–107 M⊙.1 Among these MBHs, NGC 4395 has the lowest mass black hole (BH) of MBH = (3.6 ± 1.1) × 105 M⊙ (Peterson et al. 2005), that is obtained from reverberation mapping. There are several other examples of MBHs with mass estimates either based on their accretion properties (e.g. Reines et al. 2011; Kamizasa, Terashima & Awaki 2012; Nyland et al. 2012; Secrest et al. 2012; Reines et al. 2014) or are virial mass estimates (e.g. Barth et al. 2004; Greene & Ho 2004; Seth et al. 2010; Reines, Greene & Geha 2013; Schramm et al. 2013, and references therein). The majority of these MBHs are found (or looked for) in dwarf and bulgeless galaxies. Due to the peculiar hosts and the relatively low BH masses, the non-accretion-based methods may start to fail below ∼105 M⊙ (e.g. Reines et al. 2013). On the other hand, a few of the MBHs were studied in the radio band (e.g. Wrobel & Ho 2006; Wrobel et al. 2008; Reines et al. 2011, 2014; Nyland et al. 2012; Secrest et al. 2013; Paragi et al. 2014) and in all cases the radio emission is likely due to BH activity.
Observable IMBHs have been proposed (e.g. Kaaret et al. 2001; Miller, Fabian & Miller 2004) in the context of ultraluminous X-ray sources (ULXs; LX > 3 × 1039 erg s−1) as well as in globular clusters (GCs; e.g. Miller & Hamilton 2002; Maccarone 2004, and references therein). ULXs are non-nuclear X-ray sources with a luminosity exceeding the Eddington-limit of a 20-M⊙ BH, residing in external galaxies. However, most of the ULX population might be explained by mechanical beaming (e.g. King 2009), super-Eddington accretion (e.g. Begelman 2002; Poutanen et al. 2007), and massive stellar-mass BHs (e.g. Zampieri & Roberts 2009; Belczynski et al. 2010). Relativistically beamed X-rays has also been proposed (Körding, Falcke & Markoff 2002), that is difficult to reconcile with the X-ray spectral behaviour of ULXs (see later). Whether there is a link between bulgeless galaxies, dwarf galaxies, and ULXs is still an open question (e.g. Prestwich et al. 2013; Somers et al. 2013; Plotkin et al. 2014).
A sub-class of ULXs, called hyperluminous X-ray sources (HLXs), have X-ray luminosities of LX ≥ 1041 erg s−1. Their luminosities deem them to be the best candidate IMBHs among ULXs as the above mechanisms cannot coherently explain such a powerful output from a stellar-mass BH. However, so far only a handful of HLXs have been studied (e.g. Kaaret et al. 2001; Gao et al. 2003; Farrell et al. 2009; Sutton et al. 2012). The record-holder is HLX-1 in ESO 243-49 with its peak X-ray luminosity of LX ≃ 1042 erg s−1 with a BH mass of MBH ≃ (0.3–30) × 104 M⊙ (Davis et al. 2011; Godet et al. 2012; Webb et al. 2012; Straub et al. 2014). HLX-1 was proposed to be the core of a tidally stripped dwarf (Farrell et al. 2012, 2014) or a bulgeless satellite galaxy (Mapelli et al. 2013). Lasota et al. (2011) proposed that HLX-1 may be a binary system with an eccentric orbit. In this case, the BH accretes material from a donor star when it passes periastron, which is thought to drive HLX-1 into regular X-ray outbursts. A wind fed binary system might also be a viable explanation (Miller, Farrell & Maccarone 2014).
The X-ray behaviour of HLX-1 is remarkably similar to BH X-ray binaries (BHXRBs) (e.g. McClintock & Remillard 2006; Fender, Homan & Belloni 2009). It shows X-ray state transitions (Godet et al. 2009) and follows the standard disc law between disc luminosity and temperature (L ∝ T4) in its soft state (Servillat et al. 2011; Godet et al. 2012). In contrast, the majority of the ULXs may be in a distinct or ‘ultraluminous’ X-ray state (e.g. Feng & Kaaret 2009; Gladstone, Roberts & Done 2009; King 2009); however, see also Miller et al. (2013) for a number of ULXs that are broadly consistent with the standard disc law. That said, there is one other HLX, M82 X-1, that also follows the trend of L ∝ T4 (Feng & Kaaret 2010).
Radio sources offer the best testbed for the scale invariance of the jets under BH mass and/or accretion rate (Heinz & Sunyaev 2003) and for the disc–jet coupling (e.g. Falcke & Biermann 1995; Merloni, Heinz & di Matteo 2003; Falcke, Körding & Markoff 2004). However, radio emission as a signature of an accreting IMBH in GCs is yet to be discovered (e.g. Cseh et al. 2010; Wrobel, Greene & Ho 2011, and references therein). On the other hand, Webb et al. (2012) found that HLX-1 exhibits radio flares (or jet ejections) when the source transits from a hard to soft X-ray state, similar to the behaviour of BHXRBs. King et al. (2013) also found similarities to BHXRBs in NGC 4395 in a sense that its disc–jet coupling could belong to the so-called outliers (e.g. Coriat et al. 2011) on the radio-X-ray luminosity plane.
In this paper we present radio observations of HLX-1 during its X-ray hard state with the Australia Telescope Compact Array (ATCA) as well as follow-up observations of its flaring emission during its outburst with the Karl G. Jansky Very Large Array (VLA). Throughout this paper, we use a spectroscopically measured distance of HLX-1 of 95 Mpc (Wiersema et al. 2010).
2 OBSERVATION, ANALYSIS, AND RESULTS
2.1 Swift X-ray light curve
The X-ray light curve of HLX-1 is shown in Fig. 1, indicating the evolution of the 2010, 2011, and 2012 outburst in the 0.3–10 keV band together with radio measurements of HLX-1 of this paper and from Webb et al. (2012). The X-ray light curve was adapted from Webb, Cseh & Kirsten (2014a) and for data reduction and analysis we refer to Godet et al. (2012) and Webb et al. (2014b). HLX-1 has a fast rise exponential decay (FRED) type of X-ray light curve and the source rapidly transits from a hard to soft state within days, right after the onset of the outburst. After reaching the peak X-ray luminosity, it begins a decay to quiescence over a time-scale of months with decreasing duration (e.g. Godet et al. 2014).
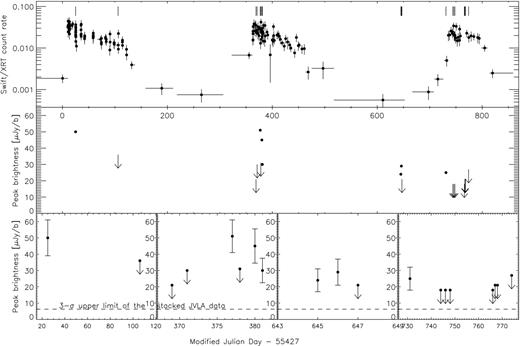
The figure shows the evolution of the 2010, 2011, and 2012 outburst of HLX-1 along with radio measurements. The top panel shows the Swift X-ray light curve with count rates in the 0.3–10 keV band. The ticks above each outburst indicate the epochs of radio observations. The middle panel shows the corresponding radio measurements. Detections are indicated with dots and non-detections are shown with an arrow. The non-detection values correspond to 3σ upper limits using the rms noise level. The bottom panel also shows the same radio data, but with zoomed subsets for clarity. The first subset corresponds to the 2010 outburst, the second subset to the 2011 outburst. The third subset shows observations from 2012 May, while the fourth subset shows the data corresponding to the 2012 outburst. The bottom panel also shows the deepest 3σ VLA upper limit. Radio points are drawn from Table 1 and from Webb et al. (2012).
2.2 ATCA observations
We obtained radio observations to look for further similarities between HLX-1 and the phenomenology of BHXRBs, that are known to show flat-spectrum radio cores during their X-ray hard state and are known to show radio flares which are associated with their X-ray state transitions (e.g. Fender et al. 2009). The ATCA measurements were obtained during the hard state of HLX-1 (Godet et al. 2012; Webb et al. 2014b). So, we combined all of our ATCA data from 2012 May and Aug (see Section 2.2). The rest of the radio measurements, shown in Fig. 1, were obtained during one of the X-ray outbursts of HLX-1 when the source was in a soft state (Servillat et al. 2011; Godet et al. 2012), following an X-ray state transition. We obtained the VLA data during the 2011 and 2012 outburst to catch potential flaring events, and then we combined these observations according to the X-ray state of HLX-1 (see Section 2.3).
We observed HLX-1 at a location of 1h10m28|${.\!\!^{{\mathrm{s}}}}$|28, −46°4′22|${^{\prime\prime}_{.}}$|3 (Webb et al. 2010; Farrell et al. 2012) with the CABB-upgraded (Wilson et al. 2011) ATCA in configuration 6D and 6A (baselines up to 6 km) in 2012 under programme code C2361 (PI Webb). The data were taken using the CFB 1M–0.5k correlator setup with 2 GHz bandwidth and 2048 channels, each with 1 MHz resolution; and with central frequencies of 5.5 and 9 GHz simultaneously. The on-source integration times were 7–9 h, see Table 1 for more details. The primary amplitude calibrator was PKS 1934-638 and the phase calibrator was 0048-427. The primary was observed for 10 min and the secondary was observed every 15 min. The data reduction was performed using the miriad software package (Sault, Teuben & Wright 1995).
First, we combined the 5.5 and 9 GHz visibility data to enhance sensitivity at each epoch. Then, we further combined the observations from 2012 May and Aug as these observations were carried out in the low/hard state of HLX-1 to reach the best sensitivity. Furthermore, we made a separate combination of these data in each frequency band. To produce images we used the multi-frequency synthesis (MFS) method (Sault & Conway 1999) and the measured system temperatures to compute the weight of the visibility points by the inverse noise variance (instead of integration time). The images were made without self-calibration and with natural weighting.
The resulting rms noise levels are listed in Table 1. We detected HLX-1 on May 26, 27 and on Aug 19 with a peak brightness of 24 ± 7, 29 ± 8, and 25 ± 7 μJy beam−1, respectively. (The 3σ upper limit of 21 μJy beam−1 on May 28 is consistent with the above values within the errors.) Due to the low signal-to-noise ratios, the point-source flux densities, listed in Table 1, were estimated from the peak brightnesses for the cases of individual detections. The resulting image from the combined data of 2012 May and Aug is shown in Fig. 2. In this deepest ATCA image, we detected emission at the location of HLX-1 during the hard state with a signal-to-noise ratio of ∼5.5 with a peak brightness of 18 ± 3.3 μJy beam−1. We fitted both, a point-source model and a Gaussian that resulted in Sν, Point = 22 ± 3.5 μJy and Sν, Gauss = 26.5 ± 5.5 μJy that are consistent within the errors. A point-source model adequately describes the radio emission. However, without higher resolution observations it is not possible to distinguish between a point source and an extended source. We note that the combination of the ATCA data and the VLA data or the combination of the hard-state data with non-hard-state data are beyond the scope of this paper.
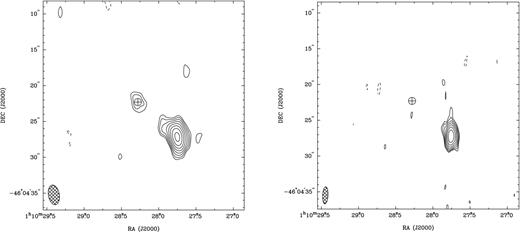
Left: the combined ATCA image of HLX-1 during the X-ray hard state at 6.8 GHz central frequency. The circle with a cross shows the 95 per cent positional uncertainty of the Chandra and HST counterpart of HLX-1 with a radius of 0.5 arcsec (Farrell et al. 2012). The radio image was made using natural weighting. The contours are drawn at |$9.9 \times (\sqrt{2})^{n}\, \mu$|Jy beam−1. The lowest contours represent radio emission at ±3 times the rms noise level of 3.3 μJy beam−1. The peak brightness is 119 μJy beam−1. The Gaussian restoring beam size is 2.79 arcsec × 1.53 arcsec at a major axis position angle of 10°. Right: the combined VLA image of the region of HLX-1 showing its host galaxy, ESO 243-49, at 7.25 GHz central frequency. The circle with a cross shows the 95 per cent positional uncertainty of the Chandra and HST counterpart of HLX-1 with a radius of 0.5 arcsec. The radio image was made using natural weighting. The contours are drawn at |$6.3 \times (\sqrt{2})^{n} \,\mu$|Jy beam−1. The lowest contours represent radio emission at ±3 times the rms noise level of 2.1 μJy beam−1. The peak brightness is 69 μJy beam−1. The Gaussian restoring beam size is 2.40 arcsec × 0.76 arcsec at a major axis position angle of −3°.
Summary of observations.
| Array | Array | Observation | On-source | Central | Reached | Flux | HLX-1 outburst |
|---|---|---|---|---|---|---|---|
| configuration | date | time | frequency | rms noise | density | status | |
| VLA | A | 2011 Aug 23 | 1 h | 5.9 GHz | 7 μJy/b | ≤21 μJy | During burst |
| ATCA | 6D | 2012 May 26 | 7.5 h | 6.7 GHz | 7 μJy/b | 24±7 μJy | Hard state |
| ATCA | 6D | 2012 May 27 | 7 h | 6.9 GHz | 8 μJy/b | 29±8 μJy | Hard state |
| ATCA | 6D | 2012 May 28 | 7 h | 6.9 GHz | 7 μJy/b | ≤21 μJy | Hard state |
| ATCA | 6A | 2012 Aug 19 | 9 h | 6.7 GHz | 7 μJy/b | 25±7 μJy | Hard state |
| Combined | May-Aug | 30.5 h | 6.8 GHz | 3.3 μJy/b | 22±5 μJy | Hard state | |
| Combined | May-Aug | 30.5 h | 5.5 GHz | 3.7 μJy/b | 23±5 μJy | Hard state | |
| Combined | May-Aug | 30.5 h | 9.0 GHz | 5.8 μJy/b | 19±8 μJy | Hard state | |
| VLA | B | 2012 Sep 1 | 1 h | 9 GHz | 6 μJy/b | ≤18 μJy | During burst |
| VLA | B | 2012 Sep 3 | 1 h | 9 GHz | 6 μJy/b | ≤18 μJy | During burst |
| VLA | B–>BnA | 2012 Sep 5 | 1 h | 9 GHz | 6 μJy/b | ≤18 μJy | During burst |
| VLA | BnA | 2012 Sep 23 | 1 h | 5.5 GHz | 6 μJy/b | ≤18 μJy | Burst decay |
| VLA | BnA | 2012 Sep 24 | 1 h | 5.5 GHz | 7 μJy/b | ≤21 μJy | Burst decay |
| VLA | BnA–>A | 2012 Sep 25 | 1 h | 5.5 GHz | 7 μJy/b | ≤21 μJy | Burst decay |
| VLA | A | 2012 Oct 1 | 40 min | 5.5 GHz | 9 μJy/b | ≤27 μJy | Burst decay |
| Combined VLA | 2011-2012 | 7.66 h | 7.25 GHz | 2.1 μJy/b | ≤6.3 μJy | During burst | |
| Combined VLA, 60 kλ | 2011-2012 | 7.66 h | 7.25 GHz | 3.1 μJy/b | ≤9.3 μJy | During burst |
The table shows the individual and combined observations of HLX-1 carried out with the VLA and the ATCA, the array configuration, and the date of the observations. We list the reached rms noise levels at the corresponding central frequency. The table also shows the flux densities obtained from modelling the visibilities or the 3σ upper limits that correspond to a point source. The last column reflects the status of the outburst of HLX-1. The point-source flux densities were estimated from the peak brightnesses for the cases of individual detections.
To test the fitted values and to minimize the error, we attempted to fit the data on the visibility plane. To this purpose we used the miriad task UVFIT. First, we attempted to fit the individual epochs, however, due to the low signal-to-noise ratio the fit did not converge. Regarding the combined data in the individual bands, we fit a point source to HLX-1 and a Gaussian to the host galaxy simultaneously and found Sν = 23 ± 5 μJy at 5.5 GHz and Sν = 19 ± 8 μJy at 9 GHz. For the deepest ATCA data at 6.8 GHz, we found Sν = 22 ± 5 μJy for HLX-1.
2.3 VLA observations
We observed HLX-1 using the VLA in 2011 and 2012 under project code 11A-290 (PI Krauss) and 12B-024 (PI Cseh), with filler scheduling priority. The observations were carried out in B, A, or hybrid array configuration in X or C band, see Table 1 for more details. The typical total on-source time was 1 h that is limited by the low declination of the target. The total bandwidth was 2 GHz, covering either 8–10 GHz (X band) or 4.5–6.5 GHz (C band), that consists of two base bands with 8-bit sampling, each with eight sub-bands with four polarization products, 64 channels per sub-band with 2 MHz channel width. In 2011, the lower and the upper baseband was placed as 4.5–5.5 and 6.2–7.2 GHz.
The data were calibrated and imaged in CASA 4.1.0 (McMullin et al. 2007), and we applied the VLA calibration pipeline version 1.2.0.2 We used 3C 48 for absolute flux density and bandpass calibration, and J0106-4034 was used for antenna gain and phase calibration. The primary calibrator was observed for 10 min and the phase calibrator for 2 min out of every 10 min. Images were made at each epoch using the MFS method and natural weighting. There was no self-calibration applied. The pipeline calibration products and the image quality – i.e. the reached rms noise levels and noise structures – were then visually examined. We also compared these to a set of manually calibrated data, and found equally good or better image quality of the pipeline calibrated data due to a more robust flagging strategy.
Our primary aim was to detect radio flares, study their time evolution, and to test if there is a permanent emission, like a ULX radio bubble (e.g. Cseh et al. 2012), at low flux density levels. The individual runs are in principle suitable to look for flares from HLX-1. However, we did not detect emission at or above the 3σ rms level (that corresponds to the individual epochs, see Table 1) at the location of HLX-1 in these observations.
Furthermore, to test the presence of a permanent or an extended emission, all of the VLA visibility data were combined and then imaged to reach the best rms noise level so far. This is shown in Fig. 2 right, where no radio emission is detected at the location of HLX-1 above a 3σ upper limit of ∼ 6.3 μJy. To test whether we could have resolved out large-scale, extended structures around HLX-1, we again combined all the visibility data and we restricted the maximum (u, v) range to 60 kλ. This reduction of the apparent maximum baseline length produces a much larger synthesized beam width allowing for the detection of emission from a larger spatial scale. In practice, the largest angular scale (LAS) that can be imaged comes from the shortest baselines and for these array configurations and observing bands the LAS is 4.5–8.5 arcsec.3 For our combined data, we take a conservative LAS of ∼4.5 arcsec that corresponds to A configuration in the C band. The resulting synthesized beam width is 4.70 arcsec × 2.40 arcsec, within the LAS, and the resulting rms noise level is 3.1 μJy beam−1. We do not detect radio emission at the location of HLX-1. The VLA data support that there is no permanent or extended emission present smaller than a physical scale of 2.2 kpc × 1.1 kpc.
Here we also provide the peak brightness and the total flux density of the host galaxy of HLX-1 that is fitted with a Gaussian and the errors given are statistical. These values correspond to Fig. 2 left, right, and to the (u, v)-restricted VLA image. Furthermore, given the low elevation of our target, we attempt to quantify the potential atmospheric attenuation in the X band. To this end, we compare the flux density and the fitted position of the host galaxy between the ATCA and the VLA at 9 GHz central frequency. We combined all of the VLA data observed in X band and restricted the (u, v) range to 60 kλ to minimize the flux density loss due to the higher resolution of the VLA. Comparing the flux densities, we find that they agree within the statistical errors (Table 2). However, given the relatively high uncertainties on the fitted flux densities and the lack of a more suitable source on the target field, we quote a conservative atmospheric attenuation of <24 per cent by taking the flux densities at face value and assuming a non-variable source. We also provide flux densities for the ATCA data, obtained from fitting a Gaussian on the visibility plane, that may indicate a flux density overestimate for the image-plane Gaussian fits and thus less of a difference at high frequencies. The fitted positions differ by only 0.02 arcsec in RA and 0.14 arcsec in Dec that is less than our cell size.
Host galaxy radio properties.
| Array | Peak | Flux density | Beam | Freq. |
|---|---|---|---|---|
| (μJy/b) | (μJy) | ( arcsec × arcsec) | (GHz) | |
| ATCA | 119 ± 9 | 157 ± 16 (153 ± 6) | 2.79 ×1.53 | 6.8 |
| VLA | 68 ± 4 | 116 ± 9 | 2.40 ×0.76 | 7.25 |
| VLA, 60kλ | 100 ± 7 | 122 ± 12 | 4.70 ×2.40 | 7.25 |
| ATCA | 117 ± 12 | 167 ± 24 (143 ± 11) | 2.30 ×1.23 | 9.0 |
| VLA, 60kλ | 91 ± 9 | 127 ± 19 | 5.99 ×2.52 | 9.0 |
The table shows the image-plane Gaussian fit results of the host galaxy. Flux density values in brackets indicate a Gaussian model fit on the visibility plane.
2.4 Spectral index and variability
We attempted to estimate a spectral index of the radio source detected with ATCA from the combined images in the different bands and found a two-point spectral index between 5.5 and 9 GHz of α = −0.4 ± 1.0, where Sν ∼ να. This spectral index does not constrain the radio spectrum to be steep, flat, or inverted.
We aimed to repeat this exercise on the previous individual detections in 2010 and 2011, using peak brightnesses in the different bands; see the values in the supplementary material of Webb et al. (2012). However, the frequency-split data do not show detections on 2011 Sep 4 due to the high noise level. Furthermore, in the remaining epochs, detections are present in only one of the frequency bands. Therefore, one can set upper or lower limits to the spectral indices using 3σ upper limits from the counter band. We find spectral indices of α1 < −0.5 ± 0.5 on 2010 Sep 3, α2 < 0.3 ± 0.5 on 2011 Aug 31, and α3 > 1.6 ± 0.4 on 2011 Sep 3. The spectral index of α1 indicates a flat to steep spectrum, α2 does not constrain the radio spectrum, and α3 indicates an inverted radio spectrum. Webb et al. (2012) showed that the radio emission in 2010 and 2011 was variable. Considering our deepest VLA limit and comparing it to the previously measured peak brightnesses, we find that the emission is variable by a factor of about 10, which unambiguously confirms a variable radio source in 2010 and 2011. The apparent variation in the spectral indices (α1, α2, α3) is also expected for a variable jet source.
Regarding the ATCA data in 2012, the peak brightness values are constant within the errors. Albeit, the non-detection on May 28 might indicate variability that is difficult to assess due to the high rms noise levels. However, in the deepest VLA limit the probed spatial scales are coupled with a sensitivity that is better than and matched to that of the ATCA, which argues against a permanent radio source in 2012.
3 DISCUSSION
In the following, we discuss the radio emission detected at the location of HLX-1 during the hard state. First, we investigate whether this emission could be contaminated by permanent emission such as a radio bubble or star formation (SF). Then, we discuss potential origins of the emission due to a compact jet or an interacting jet with the interstellar medium (ISM). Furthermore, we discuss the properties of the flaring emission and compare with microquasars and active galactic nuclei (AGNs).
3.1 Permanent emission: radio bubble or SF?
The smallest resolvable angular scale is 0.76 arcsec (Fig. 2 right), that corresponds to a physical scale of ∼350 pc at 95 Mpc. Some of the largest microquasar and ULX radio bubbles, like S26 and IC 342 X-1 (Soria et al. 2010; Cseh et al. 2012), have a size of ∼200–300 pc and a high radio luminosity of LR ≃ 2 × 1035 erg s−1 that would correspond to ∼3 μJy at a distance of HLX-1. These sources would not be resolved and would not reach our detection threshold. On the other hand, there is at least one peculiar example of an extended radio source, assumed to be associated with the ULX NGC 2276 3c, with a size of 650 pc and with an integrated flux density of 1.4 mJy at 33.3 Mpc (Mezcua et al. 2013) that would be detectable as well as resolvable if placed at 95 Mpc. This source was also inferred to be powered by an IMBH, that may allow a better comparison with HLX-1. Given that one would have detected ample extended emission if similar to NGC 2276 3c, HLX-1 is unlikely to be associated with any radio bubble above a flux density level of 6.3 μJy.
Farrell et al. (2012) argued for the presence of a young star cluster hosting HLX-1. In the following we estimate the expected radio flux density due to SF. We take a near-UV (NUV) flux of 23.96 ± 0.04 mag at wavelength of 2829.8 Å that is obtained from Hubble Space Telescope (HST) photometry (Farrell et al. 2012), which corresponds to an NUV luminosity of LNUV = (1.08 ± 0.04) × 1040 erg s−1. Assuming that all of this emission is stellar in origin, we estimate the star formation rate (SFR) using the relation of |$\log \dot{M_{\star }}/({\rm {M_{{\odot }}\, yr^{-1}}}) = \log L_{\rm {NUV}}/(\rm {erg\, s^{-1}}) - 43.17$| (Kennicutt & Evans 2012). Given that the accretion disc is expected to significantly contribute to the NUV emission, we place an upper limit to the SFR and find that |$\dot{M_{\star }}\le 7.3 \times 10^{-4}$| M⊙ yr−1.
3.2 Mass, accretion rate, and jet power
We detected radio emission during the hard state with a total flux density of Sν = 22 ± 3.5 μJy at a central frequency of 6.8 GHz at a significance of 5.5σ. A point-source model adequately describes the radio emission and it is unlikely to be permanent. Given that ‘compact jets’ are ubiquitous in a hard or inefficient accretion state and have a self-absorbed (flat or slightly inverted) radio spectrum, the radio emission detected at the location of HLX-1 can be consistent with a compact jet. Alternatively, this radio emission may not be related to the X-ray state of HLX-1 and it could perhaps be a residual emission due to the flaring activity of the source in a form that the ejected components could interact with the large-scale ISM. We discuss this option in the following sections. Here, we assume that the radio emission is causally connected to the X-ray hard state of HLX-1 and it is a compact jet as seen in other BHXRBs in this state.
Similarly, under the assumption that we witness a compact jet, we derive a total jet power and an accretion rate using equations 1 and 2 of Körding, Jester & Fender (2008). We obtain Qj ≃ 7.2 × 1036[LR/(1030 erg s−1)]12/17 ≃ 1.4 × 1041 erg s−1 and |$\dot{M}\simeq 4\times 10^{17}[L_{\rm R}/(10^{30}\,{\rm erg\,s^{-1}})]^{12/17}\simeq 7.8\times 10^{21}$| g s−1 (or 1.2 × 10⁻⁴ M⊙ yr−1).
Considering the jet power, we recall that the integrated X-ray energy of the 2011 outburst is 5.77 × 1048 erg (Miller et al. 2014). Averaging over the outburst decay time of 110 d, the average X-ray luminosity is |$\bar{L}_{{\rm X}} = 6 \times 10^{41}$| erg s−1. On average, a typical value of ∼10 per cent of the accretion power thought to go into to the jets during radio loud phases of accreting BHs (e.g. Falcke & Biermann 1995). Therefore, the expected average total jet power of HLX-1 is |$\bar{Q}_{\rm j}\simeq 6\times 10^{40}$| erg s−1. This average jet power is somewhat lower than the estimate from a hard-state compact jet, where Körding et al. (2008) also assumed a 10 per cent jet efficiency, but consistent within the errors.
3.2.1 Higher BH mass or an outlier on the Fundamental Plane?
After applying the slim disc model of Kawaguchi (2003) to the X-ray spectra of HLX-1, Godet et al. (2012) found a best-fitting BH mass of MBH ∼ 2 × 10⁴ M⊙. Similarly, a more sophisticated modelling that employs a relativistic slim disc with full radiative transfer resulted in a mass of MBH ≃ (0.6–19.2) × 104 M⊙, depending on spin and inclination (Straub et al. 2014). On the other hand, the chosen disc model does not affect significantly the BH mass estimate and if applying a standard disc model, the upper end of the mass of HLX-1 was found to be 3 × 10⁵ M⊙ at 90 per cent confidence (Davis et al. 2011). On the contrary, the BH mass obtained from the Fundamental Plane is at least a factor of 10 higher than obtained from the X-ray spectral fits and it is not consistent within the 90 per cent errors.
In the model of Godet et al. (2012), the peak accretion rate is |$\dot{M} = 4 \times 10^{-4}$| M⊙ yr−1 and during a hard state it is |$\dot{M}<4 \times 10^{-6}$| M⊙ yr−1. Also, Straub et al. (2014) found an accretion rate of |$\dot{M} = (0.3{\rm -}2) \times 10^{-4}$| M⊙ yr−1 during burst. The mass accretion rate deduced assuming the presence of a compact jet is also at least an order of magnitude higher than the accretion rate derived from X-ray spectra and the estimates are not consistent within the errors.
Furthermore, the star cluster that hosts HLX-1, has an inferred mass of 105–106 M⊙ (Farrell et al. 2014) and to have a BH mass to cluster mass ratio in the order of unity is unlikely (e.g. Miller & Hamilton 2002); however, recent results show that in compact dwarf galaxies the ratio could be as high as 15 per cent (Seth et al. 2014). We assume that the correct BH mass is estimated from the X-ray spectral fits. The resulting high BH mass (and accretion rate) obtained from the Fundamental Plane could then indicate that HLX-1 is an outlier source. It is either radio bright or X-ray faint with respect to the correlation. A comprehensive study of a sample of such outliers (de Gasperin et al. 2011) concluded that those sources are X-ray faint rather than radio bright. On the other hand, in the case of HLX-1, the hard-state X-ray luminosity is only a factor of ∼100 lower than the peak X-ray luminosity, and therefore, we argue that HLX-1 is rather radio bright. So, the radio emission could be Doppler-boosted and the above estimates should then be considered as upper limits.
Miller-Jones, Fender & Nakar (2006) argues that an unconfined, hard-state compact jet may have a Lorentz-factor above Γ ≃ 2. The Lorentz-factor is Γ = (1 − β2)−0.5, where β is in units of speed of light and the Doppler-factor is δ = [Γ(1 − βcos ϕ)]−1, where ϕ is the viewing angle. The Doppler enhancement is proportional to δ3 − α and it has a maximum at δmax ≃ 2Γ. Here, we conservatively assume that our compact jet has a Γ = 1.4–2. Then, the radio emission could be boosted by a factor of up to 22–64 for a flat-spectrum jet.4 To have a consistent mass estimate from the Fundamental Plane, the radio emission of the compact jet has to be boosted by at least a factor of ∼5, which would limit the viewing angle to θ ≤ 34° (to the angle where δ3 ≥ 5). On the other hand, in Section 3.3, based on the energetics we argue that the flares may not be boosted or could even be deboosted at the same time. This could be the case for certain viewing angles if the jet has a higher Lorentz-factor during a flaring event. Assuming a maximum of Γ = 10 for a flare would limit the viewing angle to θ ≥ 25° (the angle where δ ≤ 1). Therefore, the case of a mildly boosted compact jet and a deboosted flare is possible for a viewing angle range of θ ≃ 25°–34°, which would also limit the minimum Lorentz-factor of the flare to Γ = 5.5, assuming identical viewing angles for the compact jet and the flare. In this scenario, the maximum Doppler enhancement would be 7.4–12.3 for the compact jet.
Alternatively, a face-on SS433-type system has been proposed for some ULXs (Fabrika & Mescheryakov 2001) and recently specifically for HLX-1 (King & Lasota 2014), who argue that the geometric beam cone (or ’funnel’) has an opening angle of 1| $_{.}^{\circ}$|6. This is a tempting geometric model to apply to our radio observations. Taking a distance of 5.5 kpc and an integrated flux density of S = 0.7 Jy for SS433 (e.g. Miller-Jones et al. 2008, and references therein), the source would have an integrated flux density of 2.3 nJy if placed at the distance of HLX-1. To match the measured flux density of HLX-1, a Doppler enhancement of at least ∼9400 (or δ ≥ 21.1) would be required. Assuming that the radio jet has a viewing angle similar to the quoted geometric beam opening angle (i.e. it fits into the funnel), a Lorentz-factor of Γ ≥ 12 would be required. This would mean a highly relativistic jet (0.996c) that might be in contrast to SS433 whose jet is likely to be mass-loaded and has a speed of only 0.26c. In any case, this geometric model could be applied to the radio emission, albeit, this model does not explain the X-ray spectra and state transitions of HLX-1 (King & Lasota 2014).
3.3 Flare properties of HLX-1
In this section, we investigate the energetics and kinematics of the radio flares detected in 2010 and 2011 and discuss the possibility that the radio emission detected in 2012 is not related to the X-ray hard state.
3.3.1 Flaring behaviour
We observed HLX-1 during its outburst with the VLA to catch flares and to study their time evolution. However, we did not detect new flares in our 2012 campaign. With respect to the deepest VLA noise level, we find that the previously detected flares are variable by a factor of 10. Also, the apparent variation of the spectral indices (α1, α2, α3) is consistent with a variable jet source. This is because α3 indicates an inverted radio spectrum that is peaking in the 9-GHz band (or higher). Within the errors, it may be more inverted than allowed by a synchrotron self-absorbed core of a conical jet of ∼1.5 (e.g. Paragi et al. 2013), that may indicate a flare or discrete ejection. Inverted spectra are typically seen in synchrotron self-absorbed objects, where the signature of the evolution (or age) of an ejection is that the synchrotron turnover frequency shifts from high to low frequencies with time due to the expansion and the radiative losses of the ejected material. However, the exact dynamical evolution of a flare will depend on the ejected mass, on its initial Lorentz-factor, and ISM density (e.g. Pe'er 2012). There are example radio spectra of flaring microquasars, like GRS1915+105, that show a turnover frequency at ∼1–3 GHz (Rodriguez et al. 1995). In the case of Cyg X-3, the turnover is at ∼7–10 GHz (e.g. Marti, Paredes & Estalella 1992). This kind of radio spectrum is also exhibited by AGN flares, where the actual shift of the turnover frequency may start from tens to hundreds of GHz and could be tracked by having several broad-band radio spectra measured, that is allowed by a much longer flaring time-scale (e.g. Hovatta et al. 2008). In this regard, HLX-1 exhibits radio properties that are typical for flares in jets that also complies with the interpretation of the radio emission being due to flares (Webb et al. 2012).
Furthermore, the X-ray evolution of HLX-1 shows state transitions (Servillat et al. 2011; Godet et al. 2012) similar to microquasars (e.g. McClintock & Remillard 2006; Fender et al. 2009) and radio emission was detected following these transitions (Webb et al. 2012). These flares are thought to occur after crossing the ‘jet line’ (Fender et al. 2009) on the hardness-intensity diagram of the outbursts, still, it is not straightforward to estimate an exact arrival time. In HLX-1, radio flares were detected after reaching the X-ray peak (Fig 1), when the source was already in a disc-dominated state, where the radio emission is quenched in most cases of microquasars. On the other hand, as observations show, flares can indeed occur during a purely disc-dominated state and some sources do not seem to completely quench in radio (Brocksopp et al. 2002, 2007, 2013). Nevertheless, in some cases it is also common to have a major flare that is later followed by multiple smaller ones, see e.g. fig. 4 of Brocksopp et al. (2002). Webb et al. (2012) showed a detection of at least two flares from HLX-1 in 2011, that may indicate similar flaring activity in HLX-1. However, Brocksopp et al. (2013) have shown that the different subsequent flares have diverse spectra, duration, and morphology, which could be due to multiple ejecta or due to rebrightening. This is because instead of a simple flux decay, as a result of a ballistic motion, the rebrightening may reflect an additional deceleration due to the interaction with an earlier ejecta or with the ISM.
Here, we account for the possibility that the radio emission detected in 2012 is not connected causally to the X-ray state, rather to the flaring activity. In this case, one has to explain a variable source, as argued in Section 3.1, that slowly decelerates. The average flux density of the flares in 2011 was about 45 μJy, that then dropped to ∼22 μJy within 9–11 months, considering the detections in 2012 May and Aug. This hard-state flux density then dropped below 6.3 μJy in 1 month, when the first VLA observations were carried out. In principle, such a slow deceleration might not be excluded as some microquasars show ejecta interaction with the ISM on time-scales up to years (Corbel et al. 2002) and we would not be able to spatially resolve such components at the distance of HLX-1. On the other hand, the number of measurements are not sufficient to model a decay time. Still, we posit that a simple exponential flux decay is unlikely on the above time-scales. This is because the flare emission detected in 2011 has already varied within a few days (Webb et al. 2012), that may indicate a more rapid cooling. Also, we could easily miss flares in 2012 due to a potentially short flaring time-scale, i.e. due to sparse sampling or bad timing, given that the VLA on-source time is limited to 1 hr, while the ATCA integration times were much longer on the order of 7–9 h. If the flares are variable on the order of a day or shorter, then one has a much lower chance to catch a flare with the VLA.
Flares are typically a factor of 10–100 above a non-flaring continuum (Brocksopp et al. 2002, 2013) and our 3σ limit of 6.3 μJy may imply that in HLX-1 such continuum level is below this limit or the source does quench between the subsequent flares. Based on this, a compact jet would be expected to have a much lower flux density than the flares, lower than the measured factor of 2–3. Given the relatively short variability time-scale and the apparently high flux density with respect to the flares, one may also conclude that the radio emission is boosted. Alternatively, we missed the major flare, which may involve the future possibility of detecting flares closer to mJy levels.
3.3.2 Energetics and beaming
To have an insight into the intrinsic jet power, the derived Qmin has to be transformed to the rest frame by scaling it by a factor5 of δ−(3 − α)4/7 (e.g. Miller-Jones et al. 2006), where δ is the Doppler-factor. To estimate the correction factor, we consider a deboosted approaching jet – neglecting a receding jet – and an acceptable range of Γ ≃ [1.4; 10]. The lower end of this range reflects one of the lowest Γ measured among microquasar ejecta (Yang et al. 2011). While, the upper end was chosen to account for a possibly high Γ, should the ejecta have not been frustrated (Miller-Jones et al. 2006). Given the unknown viewing angle, this range of Lorentz-factors translates to a minimum and maximum δ of [0.1; 20]. Then, a correction factor of up to 193 could be obtained for α = −1. Therefore, a deboosted flare might not be excluded. However, as argued in Section 3.2, it is unlikely that the intrinsic jet power of an ejection is larger than the overall average output and the boosted compact jet scenario is favoured.
4 CONCLUSIONS
We investigated the radio properties of HLX-1 using a set of follow-up ATCA and VLA observations. These involved observations during a hard X-ray state (ATCA) as well as at the beginning and during the decay of the 2012 outburst (VLA). We detected radio emission at the location of HLX-1 when the source was in a hard state. Under the assumption that the emission is coming from a compact jet we provide an independent mass estimate of the BH of |$M_{\rm {BH}}\le 2.8^{+7.5}_{-2.1} \times 10^{6}$| M⊙ at 90 per cent confidence. We also investigated the possibility that this radio emission could be due to a radio nebulae, SF, a residual of the flaring activity. We conclude that the detected emission is not compatible with a nebula or SF and it is unlikely to be due to a jet interacting with the ISM, because the variability seen on much shorter time-scales. We argue that the radio emission is likely to be Doppler-boosted making the mass (and accretion rate) estimate an upper limit. The follow-up VLA observations do not reveal new detections, possibly due to an insufficient sampling of a relatively short rise time of the flares. The VLA data suggest a variable radio source and the flare energetics, based on analogies with microquasars, also suggests a boosted radio source. Further radio monitoring is needed to test the time-dependent behaviour and the compactness of the radio emission, perhaps with the MeerKAT or the SKA.
We thank the anonymous referee for the quality comments that improved the paper. The National Radio Astronomy Observatory is a facility of the National Science Foundation operated under cooperative agreement by Associated Universities, Inc. The Australia Telescope is funded by the Commonwealth of Australia for operation as a national facility managed by CSIRO. The authors are grateful to N. Gehrels for supporting Swift observations of HLX-1. This work made use of data supplied by the UK Swift Science Data Centre at the University of Leicester. EK acknowledges fund from an NWO Vidi grant no. 2013/15390/EW. SAF was the recipient of an Australian Research Council Postdoctoral Fellowship, funded by grant DP110102889. The Centre for All-sky Astrophysics (CAASTRO) is an Australian Research Council Centre of Excellence, funded by grant CE110001020. SC acknowledges funding support from the French Research National Agency: CHAOS project ANR-12-BS05-0009 (http://www.chaos-project.fr) and financial support from the UnivEarthS Labex program of Sorbonne Paris Cité (ANR-10-LABX-0023 and ANR-11-IDEX-0005-02).
The term IMBH is used in the ULX community while the term MBH is used in the AGN community and these mass ranges are blurred together in the 104–106 M⊙ range. However, the low end of the IMBH range is physically motivated as BHs above 100 M⊙ are hard to form from a single star. Also, one may want to avoid the usually considered lower range of supermassive BHs of 106 M⊙.
Applying this value to the radio emission and using the Fundamental Plane would still give a mass estimate consistent with the X-ray spectral fits.
Note that this correction factor is model dependent as the emitting volume is estimated from the rise time that also suffers time dilation. For instance, if the volume can be estimated directly from high-resolution observations, then the correction factor needs to be modified accordingly.
