


Abstract
1ES 1927+654 is an active galactic nucleus (AGN) that appears to defy the unification model. It exhibits a type-2 optical spectrum, but possesses little X-ray obscuration. XMM–Newton and Suzaku observations obtained in 2011 are used to study the X-ray properties of 1ES 1927+654. The spectral energy distribution derived from simultaneous optical-to-X-ray data obtained with XMM–Newton shows that the AGN has a typical Eddington ratio (L/LEdd = 0.014 – 0.11). The X-ray spectrum and rapid variability are consistent with originating from a corona surrounding a standard accretion disc. Partial covering models can describe the X-ray data; however, the narrow Fe Kα emission line predicted from standard photoelectric absorption is not detected. Ionized partial covering also favours a high-velocity outflow (v ≈ 0.3c), which requires the kinetic luminosity of the wind to be ≳30 per cent of the bolometric luminosity of the AGN. Such values are not unusual, but for 1ES 1927+654 it requires that the wind is launched very close to the black hole (∼10 rg). Blurred reflection models also work well at describing the spectral and timing properties of 1ES 1927+654 if the AGN is viewed nearly edge-on, implying that an inner accretion disc must be present. The high inclination is intriguing as it suggests 1ES 1927+654 could be orientated like a Seyfert 2, in agreement with its optical classification, but viewed through a tenuous torus.
INTRODUCTION
Previous Chandra and ROSAT observations of the active galactic nucleus (AGN) 1ES 1927+654 (z = 0.017) found that it did not fit within the standard AGN unification model (Boller et al. 2003, hereafter B03). Its optical spectrum is deficient of the broad emission lines associated with unabsorbed Seyfert 1 (Sy1) galaxies, but its X-ray spectrum lacks the absorption associated with Seyfert 2 (Sy2) galaxies. B03 provided a number of possible explanations including an underluminous broad line region (BLR); an X-ray absorber that is optically thick possibly with a higher than usual dust-to-gas ratio; partial covering absorption; or that 1ES 1927+654 was highly variable, and misclassified due to non-simultaneous X-ray and optical observations. Such ‘changing look’ AGN have been previously observed (e.g. Matt, Guainazzi & Maiolino 2003; Bianchi et al. 2005), but simultaneous X-ray and optical observations by Panessa et al. (in preparation) show that this is not the case for 1ES 1927+654 and that the AGN is a true optical type 2 (e.g. Bianchi et al. 2008; Panessa et al. 2009; Bianchi et al. 2012). Several objects that exhibited this non-standard behaviour have been discovered (e.g. Panessa & Bassani 2002; Balestra et al. 2005; Mateos et al. 2005; Gallo et al. 2006) demonstrating that such objects may not be unusual. Panessa & Bassani (2002) speculate that as many as ∼10–30 per cent of optically selected type 2 AGN could exhibit such unorthodox behaviour in X-rays (see also Trouille et al. 2009).
Nicastro (2000) considered the possibility of a class of objects that are truly void of a BLR (i.e. true Sy2s). Assuming that the BLR is a wind formed in a region of accretion disc instabilities where the disc changes from radiation-pressure dominated to gas-pressure dominated, the radius at which this occurs depends on the accretion rate and will decrease as the accretion rate falls. Once the accretion rate becomes sufficiently low this radius will not be conducive to stable orbits, the wind will cease, and the BLR will fade. This is compatible with an evolutionary scenario proposed by Wang & Zhang (2007), in which they postulate that non-hidden broad line region (non-HBLR) Sy2 galaxies, without absorption, are the end state of AGN development. These galaxies would have the most massive AGNs with the lowest accretion rates. It is worth mentioning that the three confirmed true type 2 AGN (NGC 3147, NGC 3660, Q 2131 − 427) all have low Eddington ratios (Bianchi et al. 2012). Tran, Lyke & Mader (2011) propose 1ES 1927+654 is such an object.
1ES 1927+654 may appear atypical even amongst this unusual class. In the X-rays, Boller (2000) found the object possessed a steep ROSAT spectrum and large-amplitude variability similar to narrow-line Seyfert 1 galaxies (NLS1s), which are normally associated with high Eddington ratios. Even Nicastro, Martocchia & Matt (2003) likened 1ES 1927+654 to an NLS1. Wang et al. (2012) proposed that 1ES 1927+654 could be a young AGN that has not yet had time to develop a BLR, and predict that such objects should be distinguished by high Eddington ratios.
In this work, we examine the X-ray properties of 1ES 1927+654 making use of non-simultaneous XMM–Newton and Suzaku data obtained in 2011 in order to determine if the X-rays can elucidate the nature of 1ES 1927+654. While the AGN was discovered in the Einstein survey and observed with ROSAT and the Chandra LETG (B03), these most recent observations are the highest quality data obtained to date of 1ES 1927+654 above ∼2 keV. In the next section, we describe the observations and data processing. In Section 3, we fit the X-ray spectra of 1ES 1927+654 with traditional models in order to compare with other AGNs, and in Section 4, we model the UV-to-X-ray spectral energy distribution (SED). We use this information in Section 5 to consider physical motivated spectral models for the X-ray emission. The X-ray variability over the past 20 years, as well as the shorter time-scales during the Suzaku and XMM–Newton observations, are examined in Section 6. We discuss our results and conclusions in Sections 7 and 8, respectively.
OBSERVATIONS AND DATA REDUCTION
1ES 1927+654 was observed with Suzaku (Mitsuda et al. 2007) and XMM–Newton (Jansen et al. 2001) starting on 2011 April 16 and May 20, respectively. The duration of the Suzaku observation was 122 ks and that of the XMM–Newton observation was 29 ks. A summary of the observations is provided in Table 1.
Suzaku and XMM–Newton observation logs for 1ES 1927+654. The start date of the observation is given in column (1). The telescope and instrument used is shown in columns (2) and (3), respectively. Column (4) is the ID corresponding to the observations. Good exposure time and source counts (corrected for background) are given in columns (5) and (6), respectively. For the EPIC instruments the counts correspond to the 0.3–10 keV band. For the RGS the counts correspond to the 0.3–2 keV band. The values for the Suzaku CCDs are taken in the 0.7–1.5 and 2.5–10 keV band.
| (1) | (2) | (3) | (4) | (5) | (6) |
|---|---|---|---|---|---|
| Start date | Telescope | Instrument | Observation ID | Exposure | Counts |
| (year-mm-dd) | (s) | ||||
| 2011-04-16 | Suzaku | BI | 706006010 | 71 890 | 40 611 |
| FI | 71 900 | 60 132 | |||
| PIN | 74 330 | NA | |||
| 2011-05-20 | XMM–Newton | PN | 0671860201 | 19 750 | 99 132 |
| MOS1 | 28 010 | 35 096 | |||
| MOS2 | 28 030 | 34 728 | |||
| RGS1 | 28 480 | 4814 | |||
| RGS2 | 28 520 | 5356 |
The EPIC pn (Strüder et al. 2001) and MOS (MOS1 and MOS2; Turner et al. 2001) cameras were operated in small-window and full-window modes, respectively, and with the thin filter in place. The Reflection Grating Spectrometers (RGS1 and RGS2; den Herder et al. 2001) and the Optical Monitor (OM; Mason et al. 2001) also collected data during this time.
The XMM–Newton Observation Data Files (ODFs) from all observations were processed to produce calibrated event lists using the XMM–Newton Science Analysis System (sas v12.0.0). EPIC response matrices were generated using the sas tasks ARFGEN and RMFGEN. Light curves were extracted from these event lists to search for periods of high background flaring, which was deemed negligible. The total amount of good pn exposure is listed in Table 1. Source photons were extracted from a circular region 35 arcsec across and centred on the source. Pile up was examined for and determined to be unimportant. The background photons were extracted from an off-source region on the same CCD.
Single and double events were selected for the pn detector, and single-quadruple events were selected for the MOS. The MOS and pn data at each epoch are compared for consistency and determined to be in agreement within known uncertainties (Guainazzi 2010).
The RGS spectra were extracted using the sas task RGSPROC and response matrices were generated using RGSRMFGEN. The OM operated in imaging mode and collected data in the V, UVW1, and UVM2 filters.
During the Suzaku observation, the two front-illuminated (FI) CCDs (XIS0 and XIS3), the back-illuminated (BI) CCD (XIS1), and the HXD-PIN all functioned normally and collected data. The target was observed in the XIS-nominal position.
Cleaned event files from version 2 processed data were used in the analysis and data products were extracted using xselect. For each XIS chip, source counts were extracted from a 4 arcmin circular region centred on the target. Background counts were taken from surrounding regions on the chip. Response files (rmf and arf) were generated using xisrmfgen and xissimarfgen.
After examining for consistency, the data from the XIS-FI were combined to create a single spectrum.
The PIN spectrum was extracted from the HXD data following standard procedures. A non-X-ray background (NXB) file corresponding to the observation was obtained to generate good-time interval common to the data and NXB. The data were also corrected for detector dead time. The resulting PIN exposure was 74 330 s. The cosmic X-ray background (CXB) was modelled using the provided flat response files. The CXB and NXB background files were combined to create the PIN background spectrum. Examination of the PIN data yielded no detection of the AGN.
All parameters are reported in the rest frame of the source unless specified otherwise. The quoted errors on the model parameters correspond to a 90 per cent confidence level for one interesting parameter (i.e. a Δχ2 = 2.7 criterion). A value for the Galactic column density towards 1ES 1927+654 of |$6.87 \times 10^{20}\,{\rm cm}^{-2}$| (Kalberla et al. 2005) is adopted in all of the spectral fits and solar abundances from Anders & Grevesse (1989) are assumed unless stated otherwise (see Section 5.1). K-corrected luminosities are calculated using a Hubble constant of H0 = 70 km s−1 Mpc−1 and a standard flat cosmology with ΩM = 0.3 and |$\Omega _\Lambda$| = 0.7.
CHARACTERIZING THE X-RAY SPECTRA
In this section, we attempt to characterize the X-ray spectra of 1ES 1927+654 with traditional phenomenological models. Initially, the spectra from all the Suzaku and XMM–Newton CCDs were fitted separately. It was found that XMM–Newton pn data agreed well with the MOS data. Similarly, it was found that the data from the Suzaku FI detectors agreed well with data from the BI CCD. Since all the data agreed within the calibration uncertainties, we present only the XMM–Newton pn and Suzaku FI spectra for multi-epoch comparison and for the ease of presentation. Due to uncertainties in the calibration, the FI data are ignored below 0.7 keV and between 1.5 and 2.5 keV. In general, given the AGN spectrum is rather steep the data quickly become noisy at higher energies. This seems to be the main cause of the increased residuals above ∼7 keV. The Suzaku data above 9 keV become completely background dominated and are consequently ignored. The pn data are used between 0.3 and 10 keV.
For comparison, the pn and FI spectra are shown in Fig. 1 corrected for instrumental differences. The spectra are comparable at both epochs except that the Suzaku spectrum appears slightly flatter and dimmer. Both spectra show a drop at lower energies commensurate with some level of absorption in addition to Galactic.
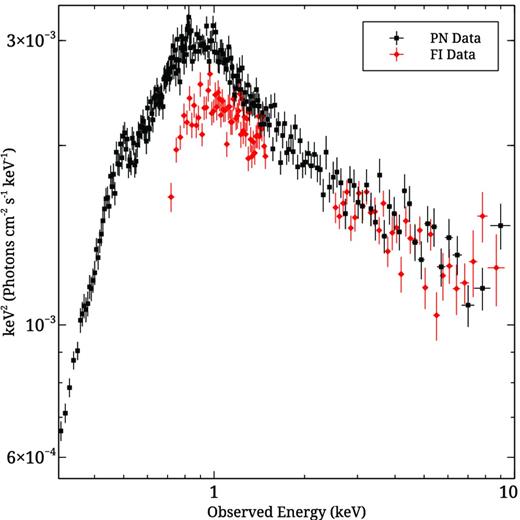
The XMM–Newton pn (black) and Suzaku FI (red) spectra corrected for instrumental differences. Both spectra exhibit a steep slope and a drop at low energies, likely from absorption in addition to Galactic levels.
The 2.5–10 keV band
Fitting the 2.5–10 keV band at each epoch with a single power law modified by the Galactic column density resulted in a good fit (|$\chi ^{2}_{\nu }=0.99$|). The photon indices were Γ ≈ 2.41 and Γ ≈ 2.27 for the pn and FI, respectively. If the X-ray spectra were highly absorbed like in typical Sy2s one would predict a strong narrow Fe Kα feature at around 6.4 keV; however, the residuals show no deviations around this band. Adding a narrow (σ = 1 eV) Gaussian profile at 6.4 keV to the model did not provide a significant improvement. The upper-limit on the flux of the narrow feature is |${<} 9.39 \times 10^{-15} \,{\rm erg}\,{\rm cm}^{-2}\,{\rm s}^{-1}$|, corresponding to an upper-limit on the equivalent width of EW < 30 eV and EW < 28 eV for pn and FI, respectively. Allowing the width and energy of the Gaussian profile to vary freely did not improve the fit over the simple power law.
The broad-band X-ray spectra
When the 2.5–10 keV power-law fit from Section 3.1 is extrapolated to lower energies, a clear soft excess is evident below ∼2 keV (Fig. 2 top panel).
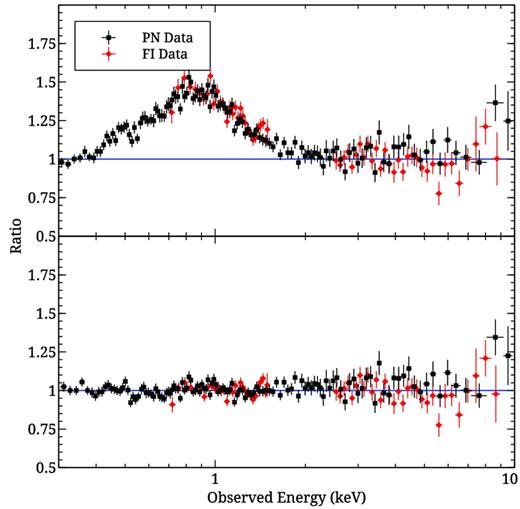
Top panel: the residuals remaining when fitting a power law absorbed by Galactic column density to the 2.5-10 keV band and extrapolating to 0.3 keV. A soft excess below ∼2 keV is revealed, which is then modified at energies below ∼0.7 keV. Lower panel: the residuals after the addition of blackbody modified by additional absorption.
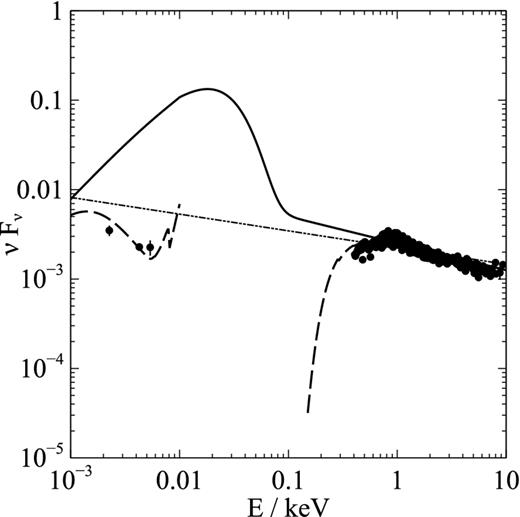
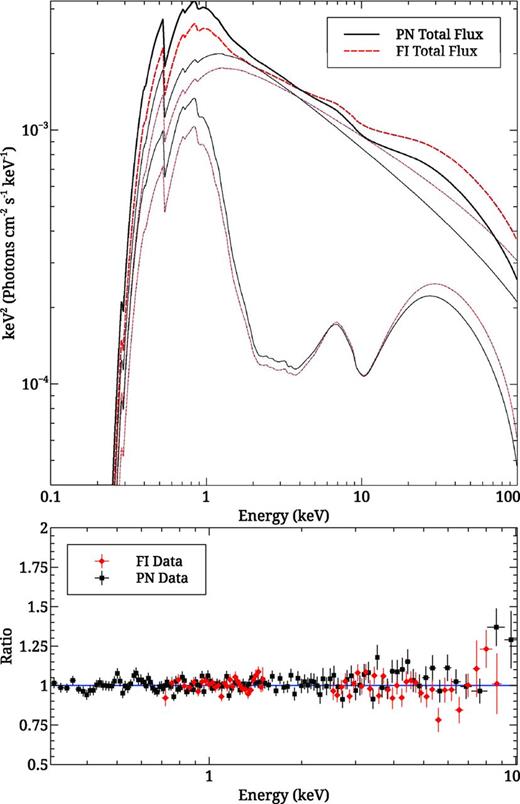
SED for 1ES 1927+654, from XMM–Newton PN and OM data and Suzaku FI data (black filled points). The dashed line shows an accretion disc and broken power-law model fitted with dust extinction in the optical–UV and photoelectric absorption in X-rays, and the solid line shows the unabsorbed fit (with dust reddening and absorption set to zero), with a prominent unobservable accretion disc component. The dot–dashed line shows a simple power-law extrapolation from X-rays down to optical wavelengths.
Adding a blackbody component worked well to describe the data. Since the pn data extend to lower energies than the FI data, the blackbody temperature was linked between the two epochs, but all other parameters were allowed to vary. The fit was statistically acceptable with |${\chi ^2_\nu /{\rm d.o.f.}}= 1.01/1226$|. Replacing the blackbody with a second power law (i.e. a double power law) or refitting the spectra with a broken power law generated poorer fits (|${\chi ^2_\nu /{\rm d.o.f.}}= 2.20/1226$| and 1.20/1227, for the double power law and broken power law, respectively).
Although reasonable fits were possible, in particular with the blackbody plus power-law model, all three models showed a drop in the residuals at energies below about 0.5 keV. The addition of a neutral absorber intrinsic to the host galaxy (ztbabs) improved the residuals in all cases. The level of absorption was modest (|${\sim } 5-10 \times 10^{20} \,{\rm cm}^{-2}$|) and it was in line with what was reported with ROSAT observations (B03), which were sensitive to even lower energies than the pn. The parameters are reported for each model in Table 2. The residuals from the best-fitting blackbody plus power-law model are shown in Fig. 2 (lower panel). The observed 0.3–2 keV and 2–10 keV fluxes during the XMM–Newton observation are 6.8 and |$3.7 \times 10^{-12} \,{\rm erg}\,{\rm cm}^{-2}\,{\rm s}^{-1}$|, respectively. The intrinsic 2–10 keV luminosity, corrected for absorption in the Galaxy and host galaxy, is |$L = 2.4 \times 10^{42} \,{\rm erg}\,{\rm s}^{-1}$| during the XMM–Newton observation.
Results from fitting XMM–Newton and Suzaku spectra with traditional models. The broad-band X-ray model is stated in column (1). The model components and parameters are shown in columns (2) and (3), respectively. The parameter values during the XMM–Newton and Suzaku epochs are reported in columns (4) and (5), respectively. Observed fluxes are reported for each component in units of |$\times 10^{-12} \,{\rm erg}\,{\rm cm}^{-2}\,{\rm s}^{-1}$| over the 0.3–10 keV band except in the case of the broken power-law model where fluxes are reported above and below the break energy. Parameters that are linked between epochs are only reported in one column. The Galactic column density has been included in all models.
| (1) | (2) | (3) | (4) | (5) |
|---|---|---|---|---|
| Model | Model component | Model parameter | XMM–Newton | Suzaku |
| Broken power law | Intrinsic absorption | NH (|${\rm cm}^{-2}$|) | 1.24 ± 0.08 × 10²¹ | |
| Power law | Γ1 | 3.30 ± 0.06 | ||
| Flux | 25.3 ± 0.1 | 21.3 ± 0.3 | ||
| Eb (keV) | 1.82 ± 0.07 | |||
| Γ2 | 2.47 ± 0.04 | 2.27 ± 0.04 | ||
| Flux | 4.06 ± 0.02 | 3.99 ± 0.03 | ||
| Fit quality | |${\chi ^2_\nu /{\rm d.o.f.}}$| | 1.11/1226 | ||
| Double power law | Intrinsic Absorption | NH (|${\rm cm}^{-2}$|) | |$1.22^{+0.11}_{-0.10} \times 10^{21}$| | |
| Power law 1 | Γ | |$3.40^{+0.12}_{-0.11}$| | ||
| Flux | 26.2 ± 0.2 | 20.6 ± 0.2 | ||
| Power law 2 | Γ | |$1.49^{+0.17}_{-0.20}$| | |$1.60^{+0.11}_{-0.13}$| | |
| Flux | 3.13 ± 0.10 | 4.06 ± 0.10 | ||
| Fit quality | |${\chi ^2_\nu /{\rm d.o.f.}}$| | 1.23/1225 | ||
| Blackbody plus | Intrinsic absorption | NH (|${\rm cm}^{-2}$|) | 2.58 ± 0.01 × 10²⁰ | |
| power law | Power law | Γ | 2.39±0.04 | 2.27±0.04 |
| Flux | 3.35 ± 0.06 | 2.75 ± 0.10 | ||
| Blackbody | kT ( keV) | 0.170 ± 0.005 | ||
| Flux | 12.36 ± 0.09 | 10.7 ± 0.1 | ||
| Fit quality | |${\chi ^2_\nu /{\rm d.o.f.}}$| | 0.97/1225 |
RGS data
The small level of cold absorption evident in the CCD spectra motivated investigation at higher spectral resolution with the XMM–Newton RGS data. The RGS data between 0.4–2.0 keV were examined 100 channel at a time and fitted with a simple power law (corrected for Galactic absorption). A Gaussian profile was used to examine for possible narrow emission and absorption features. A potential absorption feature was found around 0.85 keV, but was not constrained in the error analysis. No other features were detected within the available signal-to-noise.
OPTICAL-TO-X-RAY SPECTRAL ENERGY DISTRIBUTION
We construct a broad-band SED using the XMM–Newton pn and OM data along with the Suzaku FI data (Fig. 3). The OM points are corrected for Galactic dust extinction [E(B − V)Gal = 0.087 ± 0.003] (Schlegel, Finkbeiner & Davis 1998)1 before fitting in xspec. We follow the procedure of Vasudevan et al. (2009) for constructing the SED, using the xspec model combination zdust(diskpn)+ztbabs(bknpower), to allow for optical/UV reddening as well as X-ray absorption obscuring the intrinsic accretion disc and power-law emission, respectively. The power law falls in the UV where the disc dominates. We include an intrinsic (host galaxy) dust reddening component of E(B − V) = 0.55, corresponding to the upper limiting intrinsic extinction AV of 1.71 identified in B03 from the Hα/Hβ line ratio, using the standard relation E(B − V) = AV/RV and assuming RV = 3.1. We freeze the normalization of the diskpn model using the black hole mass estimate of log(MBH/Msun) = 7.34 from Tran et al. (2011), and assume an accretion disc extending close to the innermost stable orbit, down to 6 Rg. The photon index of the power law in the 2–10 keV regime is fixed at 2.3, as found from the analysis in Section 3.2. Under these assumptions, we obtain a bolometric (absorption-corrected) luminosity of 3.0 × 1044 erg s− 1 (integrated between 0.001 and 100 keV), and find that at least 53 per cent of this power is absorbed by dust. These assumptions yield an Eddington ratio of 0.11, larger than the value of 0.006 estimated from Tran et al. (2011) due to the extra disc contribution extrapolated here into the unobservable far-UV. If we consider an alternate disc geometry where the disc is truncated further out from the black hole (at, e.g. 60 Rg), we find that the Eddington ratio reduces to 0.046 (with 80 per cent of the bolometric flux absorbed by dust reddening), but is still well above the Tran et al. estimate. If we simply extrapolate a power law from the X-rays down to the optical and UV, discarding any contribution from the disc and integrate over the same range, we find a lower limit to the Eddington ratio of 0.014. It is also possible that the optical/UV flux is not from a canonical accretion disc, but we do not explore that possibility further here.
Overall, this implies that the accretion rate of the object (0.014–0.11) is in between the Wang et al. and Tran et al. estimates, regardless of the type of geometry we assume for the accretion disc. A substantial fraction of the intrinsic luminosity is probably absorbed by dust (between 50 and 80 per cent). We have not attempted a host-galaxy light correction to the XMM–OM fluxes, but this would serve to push the true bolometric luminosity down and reduce the Eddington accretion rate from the values seen here. The optical images reveal a crowded field, so a more refined analysis may be needed to more accurately estimate the bolometric luminosity and Eddington ratio.
MULTI-EPOCH SPECTRAL ANALYSIS OF 1ES 1927+654
Based on our phenomenological approach in Section 3, there are only slight differences between the XMM–Newton and Suzaku data sets (Table 2). In this section, we attempt to model the two broad-band X-ray data sets simultaneously and in a self-consistent manner while testing more physically motivated models. For example, while the blackbody plus power-law model presented in Section 3 was statistically pleasing, the implied thermal origin for the soft excess is questionable. Given the relatively large black hole mass, even for the highest Eddington accretion rate measured in Section 4, a standard accretion disc extending down to 2 rg would peak at a temperature of kT ≈ 45 eV. Any blackbody disc component in 1ES 1927+654 should have a temperature that is less than one-quarter of what we measure in the X-rays. In general, the lack of T ∝ M−1/4 relation between the black hole mass and disc temperature observed in samples of unobscured AGN (e.g. Crummy et al. 2006) suggests a non-thermal origin for the soft excess. Both absorption (e.g. Gierliński & Done 2004) and blurred reflection models (e.g. Crummy et al. 2006) can be used to describe the shape of the soft excess via atomic processes, and we will attempt such models to describe the spectrum of 1ES 1927+654. In doing so, we will also be testing some of the scenarios that have been put forth to describe the characteristics of 1ES 1927+654.
Neutral partial covering
We consider the scenario in which the intrinsic power-law continuum is partially obscured by a neutral absorber that lies along the line of sight. The observed X-ray emission is then the combination of the primary emitter and a highly obscured component. Such models have been proposed for type-1 Seyfert galaxies with relative success in fitting the spectrum (e.g. Gallo et al. 2004; Tanaka, Boller & Gallo 2005; Grupe et al. 2008).
Since the XMM–Newton and Suzaku observations were separated by only about one month, we assumed that the primary emitter (e.g. the power-law component) remained constant in shape and normalization and that only changes in the absorber (i.e. the covering fraction and column density) would be necessary to describe the differences at the two epochs. The simplest case of the single absorber resulted in a mediocre fit (|${\chi ^2_\nu /{\rm d.o.f.}}= 1.18/1226$|; Fig. 4 top panel). The addition of a second absorber (i.e. neutral double partial covering) was favourable, as an improvement could be achieved by changing only the covering fraction of the second absorber (Δχ2 = 43 for one additional free parameter). The model and quality of fit are shown in Table 3 and Fig. 4 (lower panel), respectively.
Top panel: the residuals remaining from fitting the XMM–Newton and Suzaku spectra with one neutral absorber partially covering the power-law source. The changes are attributed to variations in the covering fraction and column density at each epoch. Lower panel: the residuals remaining from fitting the XMM–Newton and Suzaku spectra with two neutral absorbers partially covering the power-law source. In this case, the variations from one epoch to the next are attributed to changes in the covering fraction of only one absorber. See the text and Table 3 for details.
Results from fitting the XMM–Newton and Suzaku spectra with physically motivated models. The model is stated in column (1). The model components and parameters are shown in column (2) and (3), respectively. The parameter values during the XMM–Newton and Suzaku epochs are reported in columns (4) and (5), respectively. Parameters that are linked between epochs are only reported in one column. The Galactic column density has been included in all models.
| (1) | (2) | (3) | (4) | (5) |
|---|---|---|---|---|
| Model | Component | Parameter | XMM–Newton | Suzaku |
| Neutral double partial covering | Intrinsic absorption | NH (cm−2) | (1.21 ± 0.08) × 1021 | |
| Absorber 1 | NH (cm−2) | |$5.8^{+3.3}_{-2.0} \times 10^{23}$| | ||
| Cf | |$0.52^{+0.11}_{-0.09}$| | |||
| Absorber 2 | NH (cm−2) | (7 ± 1) × 1022 | ||
| Cf | |$0.57^{+0.03}_{-0.04}$| | 0.64 ± 0.03 | ||
| Power law | Γ | 3.27 ± 0.06 | ||
| Fit quality | |${\chi ^2_\nu /{\rm d.o.f.}}$| | 1.15/1225 | ||
| Ionized double partial covering | Intrinsic absorption | NH (cm−2) | |$9.23^{+0.40}_{-1.16} \times 10^{20}$| | |
| Absorber 1 | NH (cm−2) | |$6.6^{+1.6}_{-0.7} \times 10^{23}$| | ||
| log (ξ) | |$3.03^{+0.11}_{-0.16}$| | |||
| Cf | 0.49 ± 0.11 | 0.34 ± 0.09 | ||
| za | −0.30 ± 0.01 | |||
| Absorber 2 | NH (cm−2) | |$3.34^{+2.5}_{-1.0} \times 10^{22}$| | ||
| log (ξ) | |$-0.54^{+0.81}_{-0.70}$| | |||
| Cf | |$0.28^{+0.11}_{-0.08}$| | |$0.43^{+0.07}_{-0.11}$| | ||
| za | −0.30 ± 0.01 | |||
| Power law | Γ | 2.78 ± 0.07 | ||
| Fit quality | |${\chi ^2_\nu /{\rm d.o.f.}}$| | 1.01/1221 | ||
| Blurred reflection (A) | Intrinsic absorption | NH (cm−2) | |$5.00^{+0.39}_{-0.56} \times 10^{20}$| | |
| Power law | Γ | |$2.48^{+0.05}_{-0.03}$| | 2.36 ± 0.04 | |
| Ecut | 300f | |||
| Blurring | q | 3f | ||
| Rin (rg) | 4.5f | |||
| Rout (rg) | 400f | |||
| i (°) | 86 ± 1 | |||
| Reflection | AFe (Fe/solar) | |$2.78^{+1.03}_{-1.21}$| | ||
| ξ | |$384^{+162}_{-131}$| | |$310^{+197}_{-91}$| | ||
| Fit quality | |${\chi ^2_\nu /{\rm d.o.f.}}$| | 0.96/1222 | ||
| Blurred reflection (B) | Intrinsic absorption | NH (cm−2) | (4.40 ± 0.05) × 1020 | |
| Power law | Γ | 2.43 ± 0.05 | 2.31 ± 0.05 | |
| Ecut | 300f | |||
| Blurring | qin | 5f | ||
| Rin (rg) | 1.5f | |||
| Rout (rg) | 400f | |||
| Rbreak (rg) | 5f | |||
| qout | 3f | |||
| i (°) | |$90^{+0}_{-1}$| | |||
| Reflection | AFe (Fe/solar) | |$0.76^{+0.37}_{-0.16}$| | ||
| ξ | |$200^{+25}_{-88}$| | |$202^{+35}_{-120}$| | ||
| Fit quality | |${\chi ^2_\nu /{\rm d.o.f.}}$| | 0.96/1222 |
aThe redshifts of the partial covering components in this model are linked.
The two absorbers have considerably different densities, which could be indicative of a density gradient along the line of sight as opposed to two distinct absorbing regions (e.g. Tanaka et al. 2004). The slightly lower flux during the Suzaku observation can be attributed to slightly higher covering fraction while the primary power-law emission remains unchanged between the epochs. Allowing the power-law component to vary along with the absorbers does not produce a significant improvement.
While the fit is reasonable, there are clearly spectral regions where the model does not adequately fit the data, for example between 0.4–0.6 keV and 7–10 keV (Fig. 4 top panel). The 0.4–0.6 keV residuals can be improved with the addition of an absorption edge with rest-frame energy E = 0.39 ± 0.01 keV and optical depth τ = 0.66 ± 0.12. Given the energy the feature seems unlikely to originate from calibration issues around the oxygen edge. We considered the possibility that the residuals, could be improved by adjusting the elemental abundance. In other abundance tables, like those of Wilms, Allen & McCray (2000) or Grevesse & Sauval (1998), the oxygen abundance relative to hydrogen can be almost half of what is used in Anders & Grevesse (1989). However, while the adopted abundance table does influence some model parameters, the residuals between 0.4–0.6 keV do not change significantly.
Ionized partial covering
The negative residuals between 0.4 and 0.6 keVresulting from the neutral partial covering model (Fig. 4) could be indicative of an absorber with some level of ionization. A moderately ionized absorber will preferentially remove intermediate energy X-rays giving rise to a spectral break in the 0.3–10 keV band generating a soft excess and it could account for some of the low-energy residuals.
As with single neutral partial covering, a single ionized absorber (zxipcf in xspec) was a modest fit to the data (|${\chi ^2_\nu /{\rm d.o.f.}}= 1.32/1225$|; Fig. 5 top panel). A considerably better fit could be achieved with the addition of a second ionized absorber. We tested various combinations of parameters to determine which were the most important to describe the spectra in a self-consistent manner. We determined that an excellent fit could be obtained (|${\chi ^2_\nu /{\rm d.o.f.}}= 1.01/1221$|) when the covering fraction of each absorber was allowed to vary at each epoch (Table 3 and Fig. 5 lower panel), but we also recognize that the power-law photon index is considerably steeper than is normally seen in AGN (likewise for the neutral partial covering model). In addition, we found that the best fit was achieved when the absorbers were significantly blueshifted with respect to the source frame, consistent with an outflow of 90000 ± 3000 km s−1 (0.30 ± 0.01 c). The value of the blueshift was tightly constrained independent of the uncertainty in other covering parameters like the column density, covering fraction and ionization.
Top panel: the residuals remaining from fitting the XMM–Newton and Suzaku spectra with one ionized absorber partially covering the power-law source. The ionization parameter, covering fraction and column density of the absorber are allowed to vary at each epoch. Lower panel: the improved residuals from the addition of a second ionized absorber are shown. The variations from one epoch to the next are attributed to changes in the covering fraction of each ionized absorber. See the text and Table 3 for details.
We note the ionization parameter of the second absorber is rather low log (ξ) ≈ –0.54 and could perhaps be described with another neutral absorber instead (e.g. ztbabs). The fit was significantly poorer than the double ionized absorber, but acceptable (|${\chi ^2_\nu /{\rm d.o.f.}}=1.05/1222$|). We do not test various combinations of cold and warm absorbers any further. In all likelihood, the absorbers may not be distinct regions with different densities, but a single region with some density and/or ionization gradient. Comparing the residuals from the ionized and neutral partial covering models (Figs 4 and 5) shows that the ionized partial covering is favoured. The deviations between 0.4–0.6 keV and 7–10 keV seen in the neutral absorber model are considerably improved with the ionized absorber.
If the partial covering model were correct it would only have a small impact on the Eddington ratio estimated in Section 4. The unabsorbed X-ray luminosity in this model is approximately 3.5 times greater than the value used in Section 4, thereby increasing the bolometric luminosity only slightly. The unabsorbed putative disc would still dominate and the upper limit on the Eddington ratio would only increase to about 0.13.
Compton-thick absorption
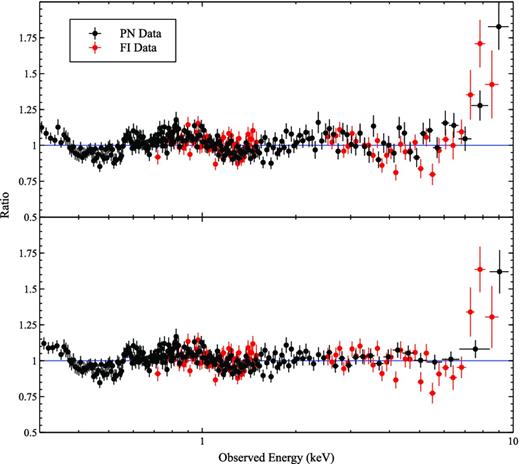
There has been speculation that 1ES 1927+654 could be a Compton-thick source. Indeed, Bianchi et al. (2012) found that some true Sy 2 candidates were in fact Compton-thick. With observations available in the 0.3–50 keV band (i.e. including the PIN null detection), we can test this model more robustly. For this purpose, we used the model MYTorus (Murphy & Yaqoob 2009), in which we view the central engine through some fraction of the torus. Reasonable fits were established, but only in cases with low, face-on, inclinations (i ≈ 0°), which would be indicative of no absorption from a torus. Attempts to fix the disc inclination more edge-on (i ≈ 85°) generated very poor fits (Fig. 6).
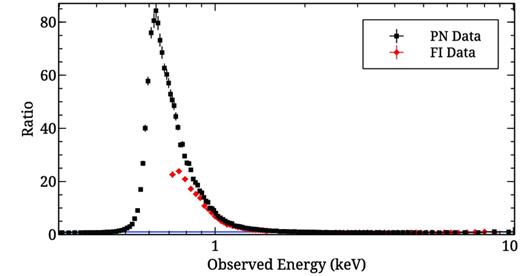
The residuals based on an edge-on dusty torus model fitted to the data.
Ionized disc reflection
Reflection from an ionized disc blurred for relativistic effects close to the black hole is often adopted to describe the origin of the soft excess (Ballantyne, Ross & Fabian 2001; Ross & Fabian 2005), and has been successfully fitted to the spectra of unabsorbed AGN (e.g. Fabian et al. 2004; Crummy et al. 2006; Ponti et al. 2010; Walton et al. 2013). We consider this scenario to describe the spectra of 1ES 1927+654 and the variations between the two epochs.
Given that the observations were obtained within about one month of each other and that the AGN is in a similar flux state, we do not expect significant variations. Initially, only the power-law slope and normalization, and the reflector ionization and normalization were permitted to vary. The blurring parameters were fixed to default values and linked between the two observations. The model produced a reasonable fit (|${\chi ^2_\nu /{\rm d.o.f.}}=1.04/1224$|).
We examined each individual parameter and then combinations of parameters, to determine which variables would improve the fit most significantly. We determined that the fit was substantially improved (Δχ2 = 104 for two additional free parameters) only when the inclination and iron abundance were free to vary [Fig. 7 and see blurred reflection (A) in Table 3]. The iron abundance was found to be about twice the solar value (|$A_{{\rm Fe}}=2.78^{+1.03}_{-1.21}$|) and the disc was significantly inclined (edge-on, i = 86 ± 1°). Permitting more than these two additional parameters to vary did not improve the quality of the fit. We further examined how the two parameters depend on each other and found that they influence each other rather modestly (Fig. 8).
Top panel: the blurred reflection model (A) for the Suzaku FI (red) and XMM–Newton (black) data. The source is power law dominated over the entire X-ray band at both epochs. Lower panel: the residuals from the model fit in the 0.3–10 keV band.
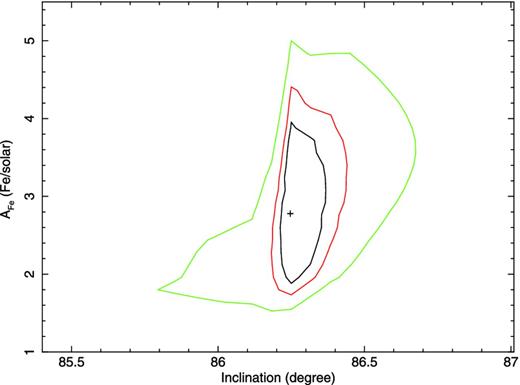
A contour plot of the blurred reflection model (A) fit with varying inclination and iron abundance. The contour lines are drawn around Δχ2 values of 3, 5, and 9.
We note that the measured inclination is rather extreme while the emissivity index is fixed to q = 3 as expected from lamp-post illumination at a large distance. However, the quality of the fit does not change if the emissivity is fixed to values of q > 3. Similarly, while the disc inner edge was initially fixed to Rin = 4.5 rg, the value in the current fit could be reduced to Rin = 3.3 rg and still achieve a perfectly acceptable fit (|${\chi ^2_\nu }=0.99$|).
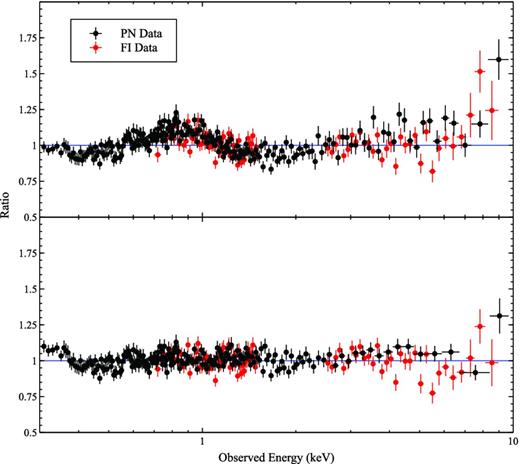
In fact, a second blurred reflection model that is more relativistic in nature fits the spectra equally well. In this case, we fixed the inner emissivity index to qin = 5 and the disc inner edge to Rin = 1.5 rg [see blurred reflection (B) in Table 3]. While the iron abundance and ionization parameter slightly decrease in this relativistic fit, the inclination still remains high (i ≈ 90°).
The two blurred reflection models demonstrate that compact geometries for the primary emitter cannot be ruled out, but the fit shows a preference for high inclinations. We also note there are no dominant Fe Kα emission features in the spectrum, so the blurred reflection models are primarily fitting the soft excess.
TIMING ANALYSIS
In Fig. 9, the 0.5–2 keV light curve of 1ES 1927+654 over the past ∼20 years is shown. The vertical bars mark the range between minimum and maximum flux that is observed at each epoch. The XMM–Newton and Suzaku fluxes are measured from the blackbody plus power-law model described in Section 3.2. Fluxes from the earlier data are estimated from the count rates and models presented by B03 using webpimms.2
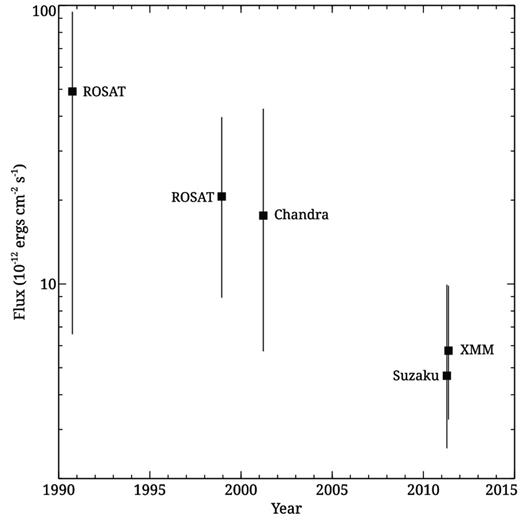
The 0.5–2 keV light curve of 1ES 1927+654 over the past ∼20 years. The mission from which the data are obtain is labelled beside each point. The vertical bars represent the range between minimum and maximum flux that is observed at that epoch.
1ES 1927+654 varies significantly during all observations. On average, the XMM–Newton and Suzaku observations catch 1ES 1927+654 at lower X-ray flux levels than have been previously observed.
In this section, we examine the variability of the AGN during the XMM–Newton and Suzaku observations. The short, uninterrupted XMM–Newton observations will provide the opportunity to examine the rapid variability (i.e. over hundreds of seconds) with high count rates. The Suzaku observation is interrupted every ∼5.7 ks due to Earth occultation, but the longer duration of the observation allows us to study the variability over ∼1.5 d.
Rapid and large amplitude variability
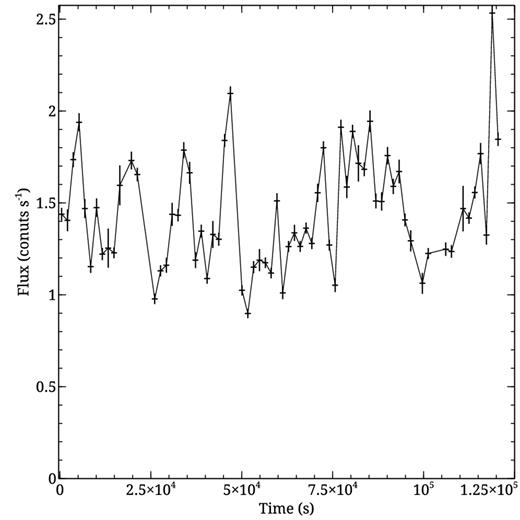
One of the distinguishing characteristics of 1ES 1927+654 from ROSAT observations was the rapid variability, comparable to what is seen in NLS1s (Boller 2000; B03). Even at this lower flux level, the AGN continues to exhibit impressive variability.
The broad-band (0.2–12 keV) pn light curve is shown in Fig. 10. The variability is persistent over the 30 ks. During the largest flares the count rate changes by more than a factor of 3 in about a thousand seconds. We calculated the radiative efficiency (η) assuming photon diffusion through a spherical mass of accreting material (Fabian 1979). The most rapid rise seen in the light curve corresponds to a luminosity change of |$8.95 \times 10^{42} \,{\rm erg}\,{\rm s}^{-1}$| in about 900 s (rest frame). However, as 1ES 1927+654 is a relatively low-luminosity AGN the lower limit on the radiative efficiency is η ≥ 0.5 per cent. Anisotropic emission or a maximum spinning black hole is not required to describe the large amplitude variability in 1ES 1927+654.
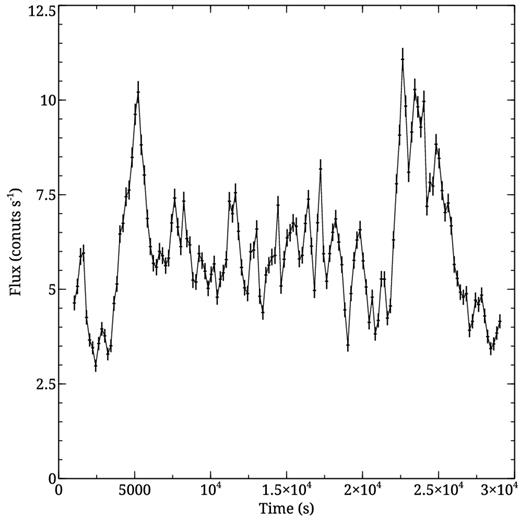
The 0.2–12 keV XMM–Newton light curve binned in 200 s intervals.
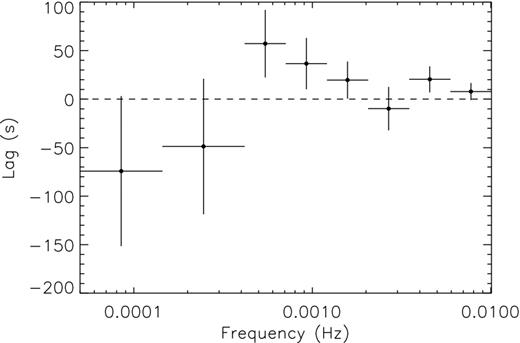
The time lag as a function of Fourier frequency between the 0.4–1.5 keV and 2–4 keV bands. A negative lag would imply that the hard band leads the soft. No significant lag is detected in 1ES 1927+654.
Light curves were created in several energy bands between 0.2 and 12 keVto compare the variability at different energies. All of the energy bands examined exhibited persistent variability. Given the highly variable light curves from 1ES 1927+654, we decided to perform a search for lags in these data. To date, over a dozen AGN display reverberation lags (e.g. Fabian et al. 2009, Fabian et al. 2012; De Marco et al. 2011; De Marco et al. 2013; Emmanoulopoulos, McHardy & Papadakis 2011; Zoghbi et al. 2012). We initially search for lags between two bands, a soft band (0.4–1.5 keV) where the soft excess is strong, and a hard band (2–4 keV) dominated by the power law. We extracted light curves in these bands using 20 s binning. From these light curves, we calculate the cross spectrum and determine the phase lag from the argument of the cross spectrum (see Nowak, Wilms & Dove 1999, for a detailed description). The time lag is simply the phase lag divided by 2πf, where f is the Fourier frequency. We find no significant lag between these two bands (see Fig. 11) even when we combine the first two data points at the lowest frequencies.
Hardness ratios (HR = H − S/H + S; where H and S are the count rates in the hard and soft band, respectively) as a function of time were calculated between all the energy bands. A few examples are shown in Fig. 12. The degree of variability depends on the energy bands being compared. The variations were most significant when the intermediate bands were compared to the softest bands (see the upper and middle panels of Fig. 12).
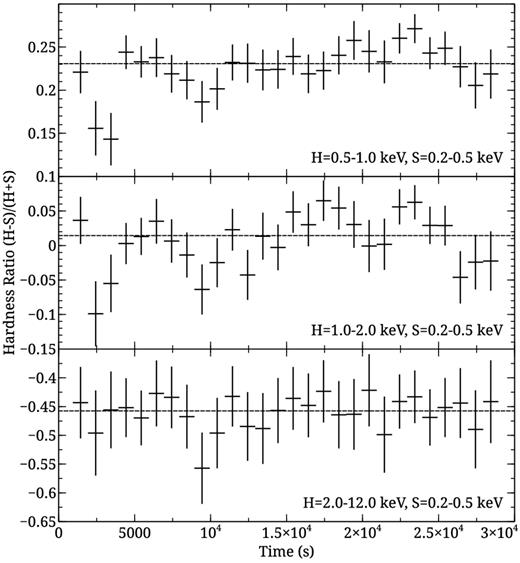
The hardness ratio plotted for various energy bands as a function of time. The light curves are binned in 1 ks intervals to improve statistics. The degree of variability differs depending on the energy bands being compared.
The 0.5–10 keV FI CCD light curve is shown in Fig. 13 with bins corresponding to orbital time-scales (5760 s). The variability is very similar to that exhibited during the XMM–Newton observation.
The 0.5–10 keV Suzaku light curve binned in orbital time intervals (5760 s).
The Fvar in various energy bands is calculated following Edelson et al. (2002) and uncertainties are estimated following Ponti et al. (2004). The XMM–Newton light curves are in 500 s bins while the Suzaku light curves are in 5760 s bins. The Fvar spectrum from the XMM–Newton and Suzaku observations are shown in Fig. 14. The spectrum shows the amplitude of the variability peaks at intermediate energies resulting in the bell-shaped Fvar that is commonly seen in unobscured Seyfert galaxies (e.g. Gallo et al. 2004; Ponti et al. 2010).
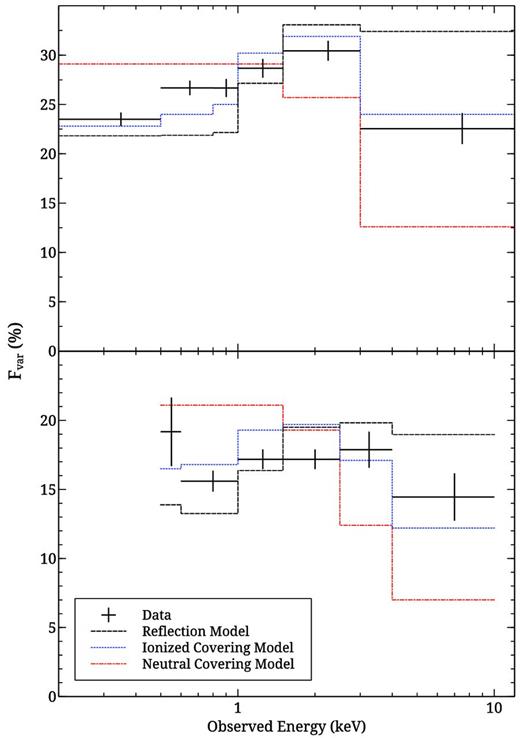
Upper panel: the fractional variability spectrum from the XMM–Newton observation calculated using 500 s binning of the light curves. The fractional variability expected from the best-fitting spectral models assuming the fluctuations are dominated by the power-law component are overplotted. Lower panel: the same as above, but for the Suzaku data using 5760 s binning of the light curves.
We considered if the blurred reflection, neutral partial covering and ionized partial covering spectral models presented in Section 5 could describe the spectral variability seen in Fig. 14. In all three cases, we considered the possibility that the variability was caused by changing the normalization of the power-law component alone. The models are overplotted on the Fvar spectra in Fig. 14. The ionized partial covering describes the variations very well. We note that in unabsorbed sources, the rapid variability is often attributed to variations in the power-law component, and it is reasonable to expect that such variability is taking place even when line-of-sight absorption is present. However, variations in covering fraction and/or column densities have been observed, even on time-scales of less than about 1–2 d (e.g. Risaliti et al. 2005; Turner et al. 2008). We return to this in Section 6.2 and consider variations in the covering fraction.
Varying the power-law normalization in the blurred reflection model gives a reasonable approximation of the Fvar spectrum. The model broadly describes the amplitude, peak and general shape of the Fvar spectrum, but there are clearly inaccuracies.
Flux-resolved spectroscopy
It stands to reason the variability model (i.e. power law varying in brightness) presented above is an oversimplification. For example, in the blurred reflection model, when varying the brightness of the primary emitter (whether by intrinsic fluctuations or via light bending, Miniutti & Fabian 2004), there should be variations in the dependent parameters of the reflector (e.g. ionization and reflected flux).
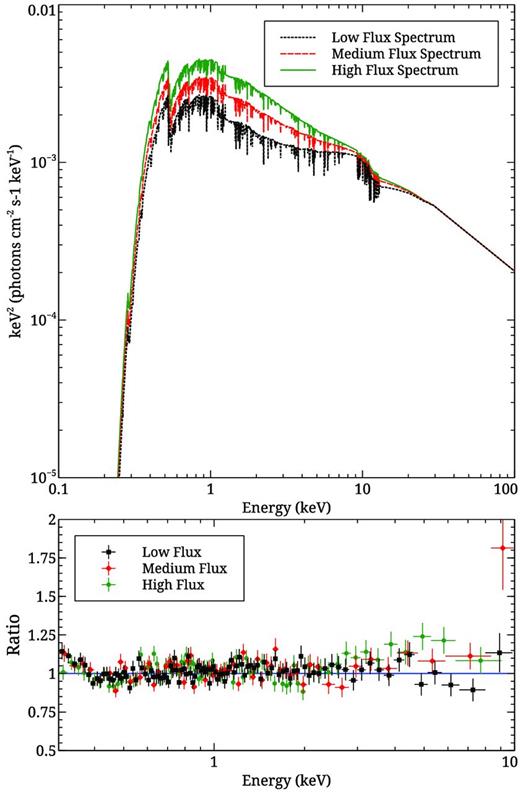
To determine if more complicated (but more realistic) variability is required, we created flux-resolved spectra of 1ES 1927+654 in low- (|${<} 6 \,{\rm count}\,{\rm s}^{-1}$|), medium- (|$6-7 \,{\rm count}\,{\rm s}^{-1}$|), and high-flux (|${>} 7 \,{\rm count}\,{\rm s}^{-1}$|) states.3 Fitting the three states with the average blurred reflection model, but allowing for changes in the power-law normalization resulted in a good fit (|${\chi ^2_\nu /{\rm d.o.f.}}= 1.04/1421$|). The fit was significantly improved (Δχ2 = 83 for three addition free parameters) when we allowed the ionization of the reflector to vary along with the power law. (Fig. 15) The changes in the ionization are well correlated with the flux in the reflection component (Fig. 16) as would be expected (e.g. Miniutti & Fabian 2004). The fits to the flux-resolved spectra demonstrate that in terms of the blurred reflection model the variability is more complicated than was assumed for Fig. 14, and completely consistent with general AGN behaviour.
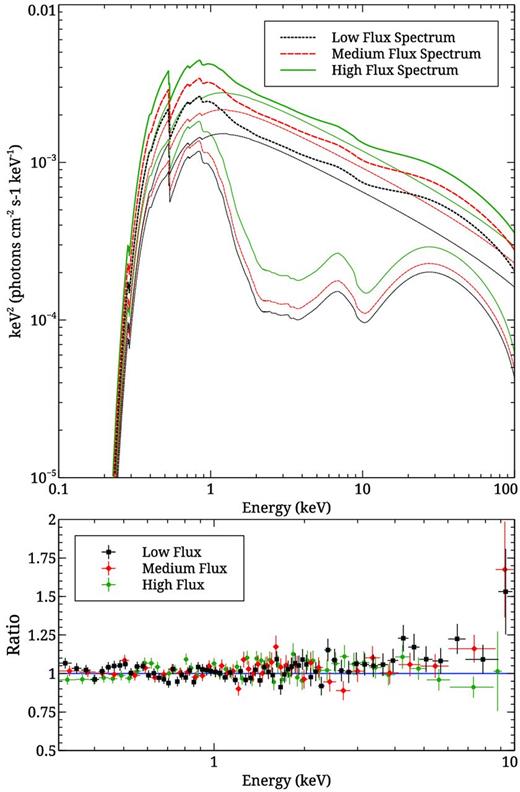
Top panel: the blurred reflection models used to describe the various flux states during the XMM–Newton observation. The differences can be described by changes in the ionization parameter of the reflector as would arise from changes in the flux of the source illuminating the disc. Lower panel: the residuals remaining at each flux state based on the model described in the top panel.
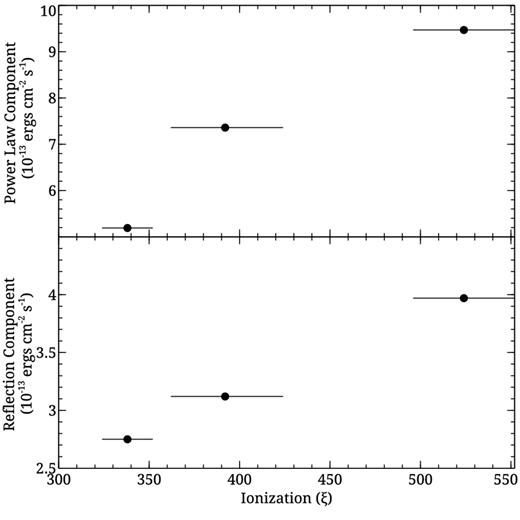
The correlation between the ionization parameter of the reflector and the 20–50 keV flux of the power-law (top panel) and reflection (bottom panel) components derived from the blurred reflection model description for the XMM–Newton flux states (Fig. 15). The correlation follows the expected behaviour that would occur as the flux illuminating the disc varies.
For the ionized partial covering model, we also considered if changes in the covering fraction alone (i.e. constant primary emitter) could describe the various flux states. The three spectra could be well fitted (|${\chi ^2_\nu /{\rm d.o.f.}}= 1.02/1419$|; Fig. 17) by allowing only the covering fraction of each absorber to vary. In this scenario, the covering fraction of the highly ionized absorber dropped from ∼58 to ∼42 per cent between the high and low state. The covering fraction of the colder absorber dropped significantly from ∼40 to ∼2 per cent between the high and low state.
Top panel: the ionized double partial covering model applied to the various flux states during the XMM–Newton observation. The differences can be attributed to changes in the covering fraction of a relatively constant primary emitter. Lower panel: the residuals remaining at each flux state based on the model described in the top panel.
DISCUSSION
These XMM–Newton and Suzaku data provide the first high signal-to-noise observations of 1ES 1927+654 above 2 keV. For the first time, the existence of a soft excess below about 1 keV has been confirmed, and an upper limit on a narrow Fe Kα line and Compton hump have been established. The 0.3–10 keV spectra are well fitted with the standard traditional models, in particularly the blackbody plus power-law model. The photon index (Γ ≈ 2.3) and blackbody temperature (kT ≈ 170 eV) are both higher than the canonical values, but within observed ranges (e.g. Nandra & Pounds 1994; Crummy et al. 2006). There is a small level of cold absorption required (|$5{-}10 \times 10^{20} \,{\rm cm}^{-2}$|) for every model attempted, which could be associated with either the AGN or the host galaxy.
1ES 1927+654 exhibits rapid and large amplitude flux and spectral variations. The bell-shape seen in the Fvar spectrum resembles the typical curve seen in unabsorbed, type-1 Seyferts, in particularly those of NLS1s (e.g. Gallo et al. 2004; Ponti et al. 2010). The Fvar spectra and flux-resolved spectra can be well described by either a blurred reflection model or by an ionized double partial covering model. In terms of blurred reflection, the rapid variability could be described by changing brightness of the primary emitter and corresponding changes in the ionization of the reflector. Variability based on the ionized partial covering model can be described by changes in the covering fraction while the power-law component remains constant. The variability seems to be in line with what is predicted by each model.
The partial covering models are pure absorption models in that they do not include Compton scattering (e.g. Miller & Turner 2013) or the fluorescent emission that accompanies photoelectric absorption (e.g. Reynolds et al. 2009). If the partial covering models could be described in this standard way, then a narrow Fe Kα emission line is expected to accompany the absorber. The denser absorber (|$N_H \approx 66 \times 10^{22} \,{\rm cm}^{-2}$|) in the ionized partial covering model would remove about 1.8 × 10⁻⁵ ph s−1 cm−2 ionizing photons (7.08–20 keV) from the XMM–Newton spectrum. Assuming the absorber is isotropically distributed around the source, then the strength of the iron line generated from photoelectric absorption is governed by the fluorescent yield. Adopting the fluorescent yield value for neutral iron (0.347; slightly higher for ionized iron) results in 6.4 × 10⁻⁶ ph s−1 cm−2 line photons being created. Such a feature would have an EW ≈ 147 eV in the XMM–Newton spectrum. A similar exercise for the Suzaku observation predicts a line with EW ≈ 101 eV. Such lines should be detected and are inconsistent with the upper-limit of 30 eV found for a narrow Fe Kα feature in the data. We note that Yaqoob et al. (2010) argue that Compton-thick lines of sight could have much lower Fe Kα fluxes (see also Miller, Turner & Reeves 2009), rendering our predicted fluxes overestimated.
The expected flux of the Compton bump in the Suzaku PIN band can also be estimated from the strength of the predicted iron line using pexrav. The reflection fraction (R) is estimated from the equivalent width of the predicted iron line during the Suzaku observation: R = EW/180 eV = 0.56. The 20–50 keV flux is estimated to be about |$1.6 \times 10^{-12} \,{\rm erg}\,{\rm cm}^{-2}\,{\rm s}^{-1}$|, more than double the flux in the pure absorption scenario. However, the source would still not be bright enough to be detected in the Suzaku PIN.
The ionized double partial covering model provides a good fit to the multi-epoch spectra and the rapid variability. The variability, both on short and long time-scales, can be reasonably attributed to changes in covering fraction and a relatively constant X-ray source. However, the best fit is achieved when the absorbers are outflowing at a velocity of v ≈ 0.3 c. We note that the determination of this blueshift is not driven by any particular spectral feature, but rather by the broad-band fit, specifically the soft excess. The ionized absorption model has been shown to replicate the soft excess in AGN quite well (e.g. Middleton, Done & Gierliński 2007). The shape of this soft excess in a sample of AGN is also well modelled with a blackbody with a temperature between ∼100 and 150 eV (e.g. Gierlínski & Done 2004; Crummy et al. 2006). The blackbody temperature measured in 1ES 1927+654 was about 170 eV (see Table 2), which is consistent with an average blackbody spectrum seen in AGN (i.e. kT ≈ 130 eV) blueshifted by ∼0.3 c. The outflowing, ionized partial covering seems consistent with the high blackbody temperature measured in 1ES 1927+654.
If the wind is launched where v is the local escape velocity, then the wind must originate very close to the black hole (rmin ∼ (c/v)2 rg ≈ 10 rg). Following Fabian (2012), the kinetic luminosity of the wind, is LW = Cf/2(rmin/ rg)(v/c)NH/NT = 0.03LEdd, where |$N_T = 1.5\times 10^{24} \,{\rm cm}^{-2}$| and Cf and NH are the covering fraction and column density of the denser absorber in Table 3. Based on the SED fitting in Section 4, the Eddington ratio is Lbol/LEdd ≲ 0.1, which would imply that the kinetic luminosity of the wind is about ≳30 per cent the bolometric luminosity of the AGN. Such values for LW do not appear unreasonable for ultrafast outflows according to Tombesi et al. (2012). However, Tombesi et al. find the inner launching radius for such winds are on average >10 times farther from the black hole than rmin is in 1ES 1927+654.
The blurred reflection models fit the spectral data quite well. However, we cannot distinguish between extremely relativistic models (e.g. rapidly spinning black hole and compact primary emitter) and less extreme ones. The Newtonian model [blurred reflection (A) in Table 3] favours about a factor of 2 overabundance of iron, which is commonly seen in Seyfert X-ray spectra (e.g. Reynolds et al. 2012; Walton et al. 2013). The ionization parameter at both epochs is about 350 erg cm s−1 and falls in the range where Auger effect is dominated over the fluorescence rendering weak Fe Kα features. In the relativistic model [blurred reflection (B) in Table 3], the iron abundance and ionization parameters are both lower. However, the more intense blurring describes the absence of distinct features in the spectrum. If the soft excess is due to reflection then the inner disc must be present. The predicted 20–50 keV flux based on the reflection model is about |$1.2 \times 10^{-12} \,{\rm erg}\,{\rm cm}^{-2}\,{\rm s}^{-1}$| and would not be detectable in the Suzaku PIN. Unfortunately, the null PIN detection of 1ES 1927+654 alone does not allow us to eliminate any of the potential models.
Both reflection models predict a high inclination (∼85°) consistent with an edge-on disc. As with the need for a high velocity outflow in the partial covering models, the preference for an edge-on disc is largely motivated by the ‘bluer’ soft excess seen in 1ES 1927+654. Reflected emission will be more highly beamed in the disc plane thus the reflection component in the spectrum should appear shifted to higher energies. The high inclination would also be manifested in the blue wing of the Fe Kα line, but since the fluorescent line is weak (either due to the Auger effect dominating or extreme blurring), the spectral feature is not significant.
This is intriguing given the Sy2 nature of 1ES 1927+654 exhibited in the optical band (B03), and arguments that this is a true Sy2 based on optical and near-infrared observations (Panessa et al. in preparation). At face-value, this would indicate that 1ES 1927+654 is orientated like an Sy2 in X-rays and optical, but void of the absorption that is associated with the torus. The small level of cold absorption (|${\sim } 10^{21} \,{\rm cm}^{-2}$|) could be from a torus that is currently in some evolutionary state. This could be confirmed with mid-infrared data to measure the torus emission.
The works of Tran et al. (2011) and Wang et al. (2012) propose two different scenarios to explain the absence of the BLR in some AGN. Tran et al. predict that such objects would be old systems and could be identified by very low L/LEdd values, while Wang et al. suggests that such objects are young and would exhibit high Eddington ratios. The SED measurements presented in this work show that 1ES 1927+654 may be a typical AGN with an Eddington ratio between 0.014 and 0.11. These values appear inconsistent with the predictions of both Tran et al. (2011) and Wang et al. (2012). Neglecting the effects of absorption momentarily, if the disc, and consequently the BLR, are seen edge-on as the blurred reflection models suggest, then the Doppler broadening of the BLR lines could be quite extreme. These very broad lines could be difficult to distinguish from the optical continuum. B03 measure the upper limit on the flux of a broad Hα component to be <5 per cent that of the narrow component, but it is not clear what the width of this feature is.
CONCLUSION
1ES 1927+654 is a perplexing object that challenges the standard AGN unification model exhibiting optical properties of absorbed systems and X-ray properties of unobscured systems. According to our SED measurements, 1ES 1927+654 exhibits a typical Eddington ratio and the absence of its BLR cannot be easily attributed to current models that call for very high or very low L/LEdd. Based on X-ray spectral models, we speculate that 1ES 1927+654 could be an edge-on system (i.e. like a Sy2), with a standard accretion disc that extends to the inner regions, but viewed through a tenuous torus. Future optical and mid-infrared observations could test this hypothesis. Future observations with NuSTAR (Harrison et al. 2013) and ASTRO-H (Takahashi et al. 2012) would produce high-quality data above 10 keV that would distinguish between the two proposed X-ray models.
The authors are grateful to the referee for valuable comments that improved the paper. LCG would like to thank Kirsten Bonson, Marcin Sawicki and Dave Thompson for discussions. The XMM–Newton project is an ESA Science Mission with instruments and contributions directly funded by ESA Member States and the USA (NASA). This research has made use of data obtained from the Suzaku satellite, a collaborative mission between the space agencies of Japan (JAXA) and the USA (NASA).
The average, observed 0.3–10 keV flux in each level from low-to-high is approximately 0.8, 1.1 and |$1.5\times 10^{-11} \,{\rm erg}\,{\rm cm}^{-2}\,{\rm s}^{-1}$|.
