


Abstract
We investigate the circumstellar dust properties of the oxygen-rich bipolar proto-planetary nebula (PPN) IRAS 18276−1431 by means of two-dimensional radiative transfer simulations of the circumstellar dust shell. The model geometry is assumed to have a torus and an envelope which consists of a pair of bipolar lobes and a spherical asymptotic giant branch shell. The parameters of the dust and the dust shell are constrained by comparing the spectral energy distribution (SED) and near-infrared intensity and polarization data with the models. The polarization in the envelope reaches 50–60 per cent and is nearly constant in the H and KS bands in the observations. This weak wavelength dependence of the polarization can be reproduced with a grain-size distribution function for the torus: 0.05 μm ≤ a with n(a)∝a− (p = 5.5)exp ( − a/ac = 0.3 μm). The power index p is significantly steeper than that for interstellar dust (p ∼ 3). Similar results have also been found in some other PPNs and suggest that mechanisms that grind down large particles, such as sputtering, may also have acted when the dust particles formed. The spectral opacity index β is found to be 0.6 ± 0.5 from the 760 μm to 2.6 mm fluxes, which is characterized by the dust in the torus. This low value (<2) indicates the presence of large dust grains in the torus. We discuss two possible dust models for the torus. One has a size distribution function of 1.0 ≤ a ≤ amax = 5 000.0 μm with n(a) ∝ a−(p = 2.5) and the other is 1.0 μm ≤ a ≤ amax = 10 000.0 μm with n(a) ∝ a−(p = 3.5). The former has β of 0.633, but we are not able to find reasonable geometry parameters to fit the SED in the infrared. The latter has β of 1.12, but reproduces the SED better over a wide wavelength range. With this dust model, the geometric parameters are estimated as follows: the inner and outer radii are 30 and 1000 au and the torus mass is 3.0 M⊙. Given that the torii are generally not found to be rotating, a large fraction of the torus material is likely to be expanding. Assuming an expansion velocity of 15 km s−1, the torus formation time and mass-loss rate are found to be ∼300 yr and ∼10−2 M⊙ yr−1, respectively.
1 INTRODUCTION
IRAS 18276−1431 (hereafter I18276), also known as OH 17.7−2.0, is an oxygen-rich proto(pre)-planetary nebula (PPN). This object has been well studied in maser observations over the past three decades since its discovery as a strong OH 1612 MHz source (Bowers 1978). No SiO maser has been detected (Nyman, Hall & Olofsson 1998). The intensity of the H2O maser dropped by a factor of 100 during the period between 1985 and 1990 and is now undetectable, indicating that the mass-loss rate has rapidly decreased to below 10−7 M⊙ yr−1 (Engels 2002). These maser properties suggest that the central star evolved off the asymptotic giant branch (AGB) phase very recently.
The dust shell of this object has also been the subject of several studies. Sánchez Contreras et al. (2007, hereafter SC07) presented optical Hubble Space Telescope (HST)/WFPC2 images and infrared (IR) KP, LP and MS images from the Keck II telescope. The images show a striking bipolar appearance with an extension of ∼2 arcsec × 3 arcsec. While the extension and the appearance look similar in these shorter wavelength ranges, the mid-IR (MIR) images at 8.59, 11.85 and 12.81 μm show an elongated shape along the polar direction with a flux peak towards the central star (Lagadec et al. 2011). SC07 also performed a one-dimensional (1D) double-shell model that mainly fits the MIR flux. They found that the observed fluxes between 800 and 2.6 mm are roughly proportional to ν2, where ν is the frequency, indicating the opacity coefficient Qν ∼ 1. Hence, they concluded that the dust grains with radii a ≳ 400 μm could explain the flux slope at these wavelengths.
The dust growth in the circumstellar environment is an interesting issue. If the ejected material radially expands at typical expansion velocities of ∼15 km s−1, the dust particles may only grow a little and retain the properties that were set in the dust formation region. That is to say, particles with sizes up to a few micron should exist. This is confirmed in several previous papers (e.g. Jura & Morris 1985). Bipolar objects such as I18276 are expected to have an optically thick, long-lived dust torus or disc around the central star, which is thought to have formed because of binary interactions (e.g. Morris 1987). In such a thick dusty region, the dust grows in size by mutual collisions. Although the formation of the disc/torus and the dust processes therein have been studied in various object classes, they are still under debate and present some intriguing problems.
In this work, we investigate the dust properties in I18276's circumstellar dust shell (CDS) by means of two-dimensional (2D) radiative transfer calculations. An approximate solution was obtained by SC07's 1D SED model. However, since I18276 exhibits a striking bipolar lobe, we explore 2D modelling. Furthermore, the spectral slope of the (sub)millimetre flux is often used to detect large grains of a few hundred micron or larger. In our modelling, we encounter difficulties explaining the millimetre flux excess and the fluxes at far-IR or shorter wavelengths simultaneously with a reasonable mass of the material in the equatorial region. We will revisit the spectral slope issue.
2 DUST SHELL MODELLING
We performed 2D radiative transfer modelling of I18276's CDS. Our aim is to investigate the dust properties in the envelope and the equatorial region. An analysis of the arc-like structure and the ‘search light’ feature, which are detected in previous optical and near-IR (NIR) images (SC07), and the formation of bipolarity are beyond the scope of this work. A comprehensive discussion on the morphology can be found in SC07. Our modelling approach is basically similar to our previous work (Murakawa, Ueta & Meixner 2010a; Murakawa 2010b). We used NIR polarimetric data obtained with VLT/NACO; these data are particularly useful to estimate the dust sizes. This is complemented by spectral energy distribution (SED) data collected from various sources. The results of the HST and Keck images (SC07) and the VISIR image (Lagadec et al. 2011) are weighted less to constrain the parameters in our 2D modelling. In the following subsections, the archival data, model assumptions and the results for the selected model are presented.
2.1 Observational constraints
Fig. 1 shows the SED of I18276; it has a single flux peak at ∼25 μm and a weak 10 μm absorption feature. In this plot, the interstellar (IS) reddening, which is calculated to be 1.6 (±0.5) mag at V (SC07), is used to correct the measured fluxes for wavelengths shorter than 5 μm.
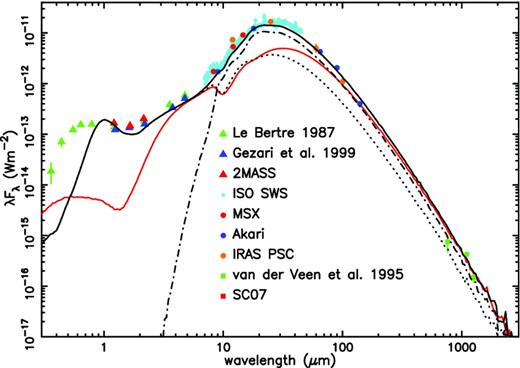
The observed SED of I18276, with the model results over plotted. The solid, dotted and dash–dotted curves denote the total flux, the scattered light and the thermal emission, respectively. The black lines represent the model with the torus and envelope. The red line denotes the model with only the torus. The sources for the photometry are of the order of wavelength, from the optical to millimetre: Le Bertre (1987), Catalog of Infrared Observations, Edition 5 (Gezari, Pitts & Schmitz 1999), 2MASS all-sky catalogue of point sources, Akari/IRC MIR all-sky Survey (Ishihara et al. 2010), the calibrated data (the data ID of 10802940) of the ISO Short Wavelength Spectrometer (Kraemer et al. 2002), MSX IR point source catalogue, IRAS point source catalogue and SC07. For the data where the error bars are not seen, the uncertainties are smaller than the plot symbols.
The upper panels of Fig. 2 present the NIR images, which are collected from the VLT/NACO data archive. The natural seeing was 0.5–0.6 arcsec in the optical during the observations, which is typical for the Paranal site. The H and KS band data were taken with the Wollaston prism to measure the polarization. The data were reduced following the same method as before (Murakawa & Izumiura 2012). Standard star data were used to calibrate the surface brightness and the polarization, and also served to estimate the size of the point spread function (PSF). The measured full widths at half-maximum of the beam are 0.1, 0.058 and 0.063 arcsec in the J, H and KS bands, respectively. The PSFs were modelled using 1D Moffat function fitting. The PSF size 2σ and slope β are obtained to be 0.146 and 1.17 arcsec in the J band, 0.074 and 1.18 arcsec in the H band, and 0.048 and 1.03 arcsec in the KS band. The model images are convolved with the model PSF which allows comparison with the observed images. The intensity images show a striking bipolar appearance and look similar in the J, H and KS bands, consistent with previous observations (e.g. SC07). For the H- and KS-band images, the polarization vectors are overlaid. The vectors are aligned perpendicularly to the bipolar axis. The polarization reaches 50–60 per cent and does not change much between the H and KS bands. There is no significant difference between the upper, brighter and lower, fainter lobes.
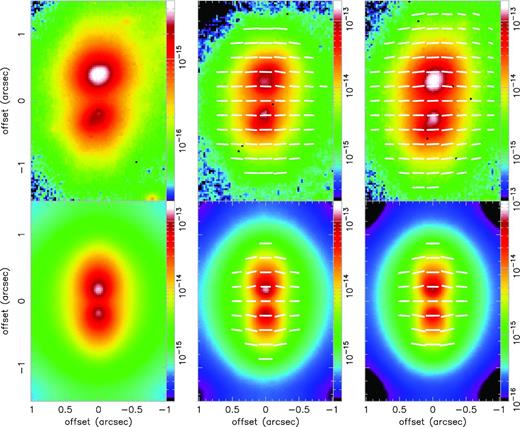
Left three columns: J-, H- and KS-band images. Top and bottom panels are from the VLT/NACO archived and our model results, respectively. The colour scale bars indicate the surface brightness in W m− 2 μm−1 arcsec−2. In the H- and KS-band images, the polarization vector lines are overlaid. The modelled images are convolved with a 1D Moffat model PSF.
In our modelling, we aim to fit the shape of the SED including the weak 10 μm silicate feature, the constant bipolar appearance and degree of polarization in the NIR.
2.2 Model assumptions
The spectral type and the total luminosity of the central star are estimated to be ∼K5 or earlier and ∼1.5 × 10⁴(D kpc/4.6)2, respectively (Le Bertre et al. 1989). Previous OH maser phase-lag measurements yielded a distance in the range 3.4–5.4 kpc (Bowers, Johnston & Spencer 1981, 1983). In our model, the central star is assumed to have a blackbody spectrum with 7000 K, which is an intermediate value of the previous estimates of 4000 to 10 000 K (e.g. Le Bertre et al. 1989). We adopted the distance to be 3 kpc following SC07, yielding a luminosity of 6380 L⊙. We will start with this value, but will eventually use 8500 L⊙ to better fit the SED.
In bipolar PPNs such as I18276, it is expected that the CDS has an optically thick dust torus/disc in the equatorial region and an envelope, which characterizes the lobe shape. In our separate paper on the bipolar PPN IRAS 16342−3814, we needed an additional optically thick, geometrically thin disc inside the torus (Murakawa & Izumiura 2012). For I18276, we tried both model geometries, but found that the inner disc is not necessary. The mass density form for I18276 is assumed to be ρ = ρtorus + ρlobe + ρAGB. We apply a mass density form ρtorus(r, z) = ρt(r/Rtorus)−2exp (−z2/2(H0r)2) for the torus, where (r, z) are the 2D cylindrical coordinates, and the torus region is defined as |$R_\mathrm{in}\le \sqrt{r^2+z^2}\le R_\mathrm{torus}$|. We would like to stress that the dust particle motions in the torii of evolved stars are not well known. For example, it is not clear whether they are accreting on to the star, expanding or rotating in a Keplerian fashion, or not. Hence, we regard the torus just as a tapered dust structure. For the envelope, we assume a spherical AGB shell in the outer part and a pair of bipolar lobes inside the AGB shell. This is because the mass-loss rate rapidly increases at the very end of the thermal pulsing AGB phase. The lobe is then carved out by the fast wind when the star evolves to the post-AGB phase. The bipolar appearance is mainly characterized by the lobe structure. The mass density forms of the lobe and AGB shell are given by equations 4 and 5 in our I16342 paper, respectively. They are determined by the density coefficient, ρe, the density ratios ϵin and ϵrim, for the inner cavity and the rim of the lobe; the lobe shape, β, the lobe thickness, γ, the lobe size, Rlobe, and the outer radius Rout. The mass density coefficients, ρt and ρe, are determined from the masses of the torus and envelope (i.e. lobe and AGB shell) assuming a gas-to-dust mass ratio of 200. The important parameters are the radii of the inner Rin and outer Rtorus boundaries of the torus, the aspect ratio of the torus height H0, the masses of the torus Mtorus and the envelope Menv, γ, ϵin and ϵrim are determined in our modelling. The other parameters such as β, Rlobe and Rout are set to be fixed values. Fig. 3 shows the mass density map of the inner 2000 × 3000 au region.
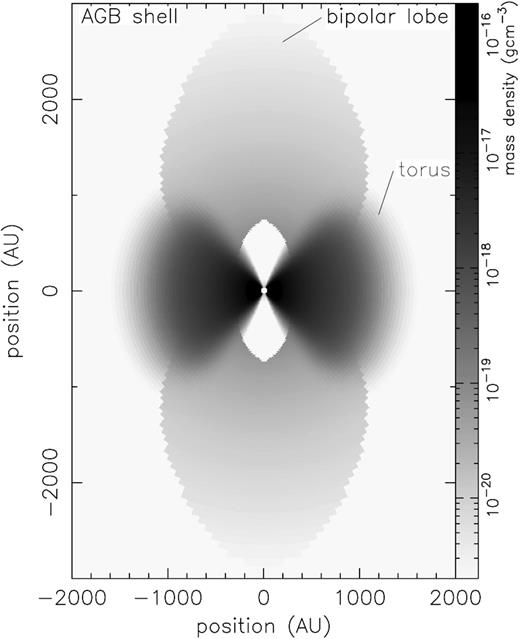
Mass density distribution of the model in a plane cutting through the symmetry axis. The parameters are from the selected model (see Table 1). The AGB shell is not explicitly indicated, because the mass density is lower than 2 × 10⁻²¹ g cm−3, but it exists outside the bipolar lobe and torus.
The mineralogy of dust in the CDS is not well known. We therefore simplify the dust model and adopt the optical constants of oxygen deficient silicate (Ossenkopf, Henning & Mathis 1992). We assume different dust sizes for the torus and the envelope. The dust size in the envelope can be constrained with polarimetric data. We assume a KMH-like size distribution function (Kim, Martin & Hendry 1994): n(a) ∝ a−pexp (−a/ac) with amin of 0.05 μm and note that a steep power index p of 5.5 results in a weak wavelength dependence. Only the cutoff size, ac, is a free parameter. The wavelength dependence of the power index p will be discussed in Section 3.1.
The dust sizes in the torus can be constrained with the spectral flux slope α in the (sub)millimetre wavelength ranges. With the flux data between 761 and 2.6 mm, α is 2.6 ± 0.5, which yields the spectral opacity index β of 0.6 ± 0.5 (= α − 2). In principle, this allows us to determine a size distribution function; however, it is not a unique solution. We encounter difficulties in fitting the SED at the shorter wavelengths with the derived dust models. The details of this problem will be discussed in Section 3.2. Instead of applying a dust model that can be determined using β, we attempted to find one that fits the SED better over a wider wavelength range. Assuming an MRN-like size distribution function (Mathis, Rumple & Nordsick 1977): n(a) ∝ a−3.5 with amin ≤ a ≤ amax, amax is determined by the SED fitting. For amin, we adopt 1.0 μm. However, since we do not have enough clues to determine the value precisely, we exclude the amin value from the discussion of the dust properties in the torus in Section 3.2.
2.3 Results and comparison with the observations
The aforementioned parameters are estimated by means of radiative transfer calculations using our stsh code (Murakawa et al. 2008). We first tried several parameter sets to get approximate solutions and to understand the parameter dependence on the model results. Then, a few thousand parameter sets were examined by SED fitting. From this result, a dozen good parameter sets are chosen and their images are evaluated. We finally chose the one that explains the observations fairly well. We would like to stress that it is very difficult to find a parameter set that reproduces all aspects of the observations. Because our aim is to investigate the dust properties, our modelling is mostly concerned with explaining the NIR polarization and the SED over a wide wavelength range. The images in the optical and MIR are not accurately reproduced. The derived parameters are: Rin = 30 au, Rtorus = 1000 au, Mtorus = 3.0 M⊙, amin = 1.0 μm, amax = 10 000.0 μm, the optical depth in the torus mid-plane is 52 at 5.0 μm, Menv = 1.2 M⊙ and ac = 0.3 μm. The viewing angle measured from the polar axis is 80°. Table 1 lists these parameters and uncertainties. We briefly summarize the selected model results in this section and discuss the effects of dust sizes on the model results in detail in Section 3.
Model parameters of I18276's CDS.
| Parameters | Values | Commentsa |
|---|---|---|
| Central star | ||
| Teff | 7000 K | Le Bertre et al. (1989) |
| L⋆ | 8500 L⊙ | Adoptedb |
| D | 3.0 kpc | SC07 |
| R⋆ | 4.38 × 1013 cm | Calculated |
| Torus | ||
| Rin | 30 au | 20–30 |
| Rtorus | 1000 au | 700–1500 |
| H0 | 1.0 | 0.8 – 1.2 |
| Mtorus | 3.0 M⊙ | 2.5–4.0 |
| amin | 1.0 μm | Adopted |
| amax | 10 000.0 μm | ≳ 1000.0 |
| τ5 μm | 52 | Calculated |
| Bipolar lobe and AGB shell | ||
| Rlobe | 3000 au | Adoptedc |
| β | 1.0 | Adopted |
| γ | 0.75 | 0.7–0.8 |
| ϵin | 0.01 | <0.1 |
| ϵrim | 10 | 10–15 |
| Rout | 90 000 au | Adopted |
| Menv | 1.2 M⊙ | 1.0–1.5 |
| ac | 0.3 μm | 0.3–0.4 |
aRanges give the uncertainty of the corresponding model parameters. bBased on comparison of the SED. cBased on comparison with the intensity image.
The SED of the selected model is plotted with black lines in Fig. 1. The aperture sizes used for the photometric and spectroscopic data are different for the various observations; they are 4 arcsec in radius (for 2MASS) or larger. Because the apparent size of the nebulosity is small and most flux is concentrated within ∼1 arcsec, the effect of aperture size on the observed SED is negligible in I18276. In fact, the model flux derived applying a 4 arcsec aperture differs less than 1 per cent from that applying an infinite aperture from optical to millimetre wavelengths. The model fits the observed SED well apart from the optical. The weak 10 μm feature is due to a filling in the underlying absorption with strong thermal emission. In fact, the MIR images show a flux peak towards the central star (Lagadec et al. 2011) and the calculated optical depth becomes high as 41 at 10 μm. The red line denotes the result of the selected model but with only the torus, e.g. Menv is simply set to be 0. It approximately indicates the contribution from the torus in the selected model. In the wavelengths shorter than ∼9 μm and between ∼9 and ∼200 μm, the scattered light and thermal emission from the envelope, respectively, dominate. The SED of the selected model fits the observations comparably well in the NIR and longer wavelengths. However, a large discrepancy is seen in the optical. In some models with other parameter sets, e.g. amin = 5 μm dust for the torus and a shallower power index of the mass density distribution in the envelope, we find that these models can fit the SED in the optical better than the selected model. However, these models provide poorer fits to the images or the MIR fluxes.
The bottom panels in Fig. 2 show the model results. The pair of bipolar lobes and a nearly constant appearance from J to KS bands are reproduced. The optical and MIR images are also reproduced although they are not presented. The bipolarity is seen in the optical, LP and MS bands. On the other hand, the 11.85 μm image shows a single peak. These results are qualitatively consistent with the observations (SC07 and Lagadec et al. 2011). However, the details of the surface brightness structures of the images are not accurately reproduced because the images at these wavelengths are not used to strictly constrain the model parameters.
The polarization vectors are aligned perpendicular to the bipolar axis in the entire nebulosity. Since a centrosymmetric pattern is seen in the raw images, this alignment is due to the PSF smoothing effect, as is also demonstrated in our I16342 paper (Murakawa & Izumiura 2012). The polarization in the bipolar lobes reaches 50–65 per cent, which is slightly higher than the observations. If ac = 0.4 μm is used, the polarization becomes 45–60 per cent. We confirm that our estimation of the particle size in the envelope is consistent with that by Gledhill (2005).
We reach an important conclusion with respect to the particle sizes. In the envelope, the mass fraction of the particles with radius larger than the cutoff size (ac = 0.3 μm) is 28 per cent. This fraction decreases dramatically for larger sizes, e.g. only 1.7 per cent for a ≥ 1.0 μm. The submicron-sized dust dominates in the envelope. On the other hand, the fraction of the particles larger than 400 μm is as high as 81 per cent for the torus. Hence, the particles in the torus are expected to be significantly larger than in the envelope. In Section 3.1, we discuss the effect of the power index, p, on the polarization and provide our interpretation on the derived p of 5.5. In Section 3.2, we discuss the determination of the particle sizes using the millimetre flux excess and the problems encountered in our modelling.
3 DUST PROPERTIES
3.1 In the bipolar lobe and the AGB shell
In NIR polarimetric images of bipolar reflection nebulae such as those seen around for example evolved stars, young stellar objects (YSOs) and active galactic nuclei, the polarization vectors are centrosymmetrically aligned and the degree of linear polarization reaches ≳ 10 per cent in general. This result is explained by single scattering of submicron-sized dust particles. The polarization is sensitive to the dust size, or to be more precise, the size parameter x = 2πa/λ for x ∼ 1. In the case of YSOs, a strong wavelength dependence of the polarization is seen which can be explained with a size distribution function: n(a) ∝ a−3.5 (e.g. Hales et al. 2006; Beckford et al. 2008; Murakawa et al. 2008). This value for the exponent can be readily understood because the dust in the YSO envelope originates from IS matter. In contrast, weak wavelength dependences are found in some evolved stars. The polarization ranges from 35 to 60 per cent in the optical to NIR in Frosty Leo (Dougados et al. 1990; Scarrott & Scarrott 1994). Scarrott & Scarrott (1994) found a steeper power index p ranging from 5.2 to 5.5.
We now investigate the effects of the dust sizes and the size distribution function on polarization. Two models are considered: G1 has 0.05 μm ≤ a and n(a) ∝ a−5.5exp (−a/ac), and G2 has 0.005 μm ≤ a ≤ amax μm and n(a) ∝ a−3.5. Upper limits of the dust size ac or amax of 0.1, 0.2, 0.3, 0.5 and 0.7 μm are examined. Fig. 4 presents the resulting polarization. The degree of polarization Pmax is calculated using the ratio of −S12 to S11 at the scattering angle that maximizes the polarization, where S11 and S12 are the scattering matrix elements for spherical grains (Bohren & Huffman 1983). These values should be the upper limit of the polarization expected in the envelope because the scattered light at various scattering angles is integrated in the observed data. In fact, the polarization values in our model are 50–65 per cent in the H and KS bands, but the above calculations give 70–80 per cent.
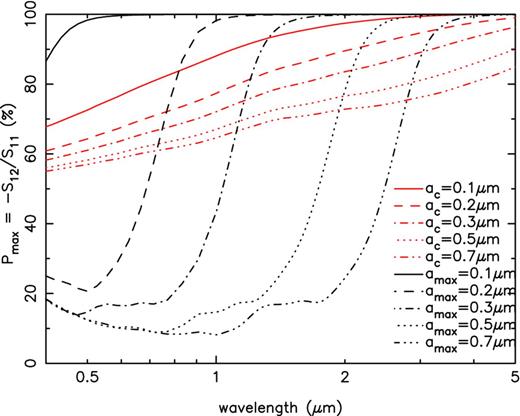
Plot of scattering property. The degree of polarization is the maximum values of the single scattered light. The red and black lines denote the results of G1 and G2, respectively.
G2 has a strong wavelength dependence in the optical to the NIR, as is observed in YSO envelopes. On the other hand, G1 has a weak dependence on wavelength and dust size. The scattering properties are determined by the relative fractions of small and large dust. The scattering matrix elements S are weighted with n(a) by 〈S〉 = ∫Sn(a) da/∫n(a) da. In G2, the scattering property is dominated by the dust at the maximum sizes. The polarization varies rapidly around x ∼ 1, e.g. λ ∼ 1 μm for amax = 0.3 μm. It is of interest that in fact the polarizations cannot be simultaneously fitted in the H and KS bands if the G2 dust is applied in the envelope in our modelling. For example, whereas the amax = 0.4 μm model reproduces the H-band polarization with a value of PH ∼ 55 per cent, the model returns a too high K-band polarization of ∼70 per cent. The 0.5 μm dust models, instead, reproduce the K-band polarization and return PK ∼ 60 per cent; however, they result in too low PH ∼ 27 per cent. We see large discrepancies despite a small difference of ∼0.1 μm in the amax values. On the other hand, the G1 model has a larger fraction of small particles (x < 1). Thus, the polarizations are higher even at shorter wavelengths, i.e. λ < 1 μm. In contrast, lower polarizations are obtained at longer wavelengths (λ > 1 μm) because of the large particles, even though the fractions are low.
It is also useful to note that the polarizations of the G1 models are lower than those of G2 at λ > 3 μm even with the same upper limit sizes. This is because dust models with the KMH-like size distribution function have particles with sizes exceeding ac. If a steeper power index, e.g. p = 5.5 > 3.5, is assumed in the MRN-type dust model, the scattering properties at longer wavelengths (λ ≳ 2πamax) consequently becomes similar to those with a shallower power index. We reach two conclusions. First, in objects that show a weak wavelength dependence in their envelopes such as I18276 and Frosty Leo, a steep power index p(>3.5) is expected in the size distribution function. Secondly, if the polarization is measured over a wider wavelength range such as from the optical to 3–5 μm, which is still in the scattering regime in cool dust regions, the size distribution functions are better constrained, e.g. the lower limit and whether the MRN-type or the KMH-type is more favoured.
This brings us to the more general question whether the dust properties depend on the objects under consideration. An NIR polarimetric survey of a dozen of PPNs was presented (Gledhill et al. 2001). Four objects (IRAS 17436+5003, IRAS 19114+0002, IRAS 18095+2704 and IRAS 19500−1709) out of seven for which the nebulosity is spatially resolved show nearly constant polarizations in the J and K bands. Including three other objects (Frosty Leo, I16342 and I18276), a weak wavelength dependence on polarization is detected. We thus find similar polarization behaviour for different morphologies, i.e. spherical, elliptic and bipolar, while all objects except for IRAS 19500−1709 are oxygen rich. Differences in morphology are thought to result from the different initial stellar mass, i.e. the higher the mass, the more the asymmetry (e.g. Corradi & Schwarz 1995). These observational results suggest that the initial stellar mass and the dust shell morphology do not play important roles in determining the dust-size distribution function. The power index of ∼3 that is found in the IS medium (Mathis et al. 1977) is thought to be the result of dust formation process of mass-losing evolved stars (e.g. Bierman & Harwit 1980).
Dominik, Gail & Sedlmayr (1989) analyzed the dust size spectrum in the dust-driven winds of carbon-rich stars. In their models, dust particles form via nucleation at ≲ 2.0 R⋆, the size distribution function rapidly approaches the final distribution within ∼20 R⋆. They found that the size distribution functions are proportional to a−5 in the case without drift between the gas and dust motions and to a−7 in the case with drift. Their results show that large drift velocities steepen the size distribution function because they can break up large particles by sputtering. Woitke (2006) and Höfner & Andersen (2007) pointed out that in oxygen-rich winds, the radiation pressure on the dust is too weak to drive the wind because of low dust opacities. In fact, survey observations of a large number of AGB stars and mass-loss models have shown that expansion velocities are lower in oxygen-rich stars (Groenewegen et al. 1999; Schöier & Olofsson 2001; Olofsson et al. 2002), suggesting lower drift velocities in oxygen-rich stars than the carbon-rich objects. At first glance, this is in the opposite sense to the result that the majority of the objects where steeper power indices are found are oxygen rich in the aforementioned polarization survey. Follow-up observations of various objects, i.e. C/O rich, and various stellar luminosities, mass-loss rates and evolutionary stages, and further analyses of the dust formation and stellar wind are essential. Although we are not in a position to identify the physical reasons, one may expect that shattering or sputtering works efficiently in the circumstellar environments in objects like I18276.
3.2 In the torus
Measuring the flux excess at submillimetre to millimetre wavelengths provides a simple and powerful method to evaluate whether large dust grains ( ≳ a few hundred microns) exist in the disc/torus region or not (Beckwith & Sargent 1991; Miyake & Nakagawa 1993; Draine 2006). In fact, numerous previous works have found dust growth particularly in discs around young stars (e.g. Calvet et al. 2002; Testi et al. 2003; Lommen et al. 2007). Some intensive modelling to investigate the effects of the dust growth on the SEDs and images has been done (e.g. D’alessio, Calvet & Hartmann 2001). In our modelling of I18276, the flux from the torus dominates in the FIR or longer wavelengths (see Fig. 1 and Section 2.3). In this result, the dust size in the torus was estimated to fit the SED in a wide wavelength range. In this section, we discuss dust models that fit the flux slope in the submillimetre and millimetre wavelength ranges by applying the aforementioned analysis.
The spectral opacity index cannot be directly determined from observations. Rigorously speaking, it should be derived from the (sub)millimetre flux by solving the radiative transfer problem. In special cases, such as accretion discs (Beckwith & Sargent 1991), approximate solutions are given. Here, we show a simpler prescription. Let us assume that the flux in that wavelength regime is dominated by emission from the torus and that this emission can be approximated by blackbody radiation with a representative dust temperature, Bν(Td), the flux Fν is given by Fν ≈ MtorusκνBν(Td)D−2ζ−1, where κν, D and ζ are the mass absorptive opacity, the distance to the object and the gas-to-dust mass ratio, respectively. If the dust emission at this wavelength range is assumed to be in the Rayleigh–Jeans limit, the blackbody function can be approximated by a power law, Bν(Td) ∝ ν2. In addition, if the dust opacity has a power-law dependence on frequency, κν ∝ νβ, the flux is given by Fν ∝ να with α ≡ dln Fν/dln ν = β + 2. This can be obtained when the ratio of the optically thick to thin emission, Δ, is neglected in the result derived by Beckwith & Sargent (1991).
With the observed flux data of I18276 from λ = 761 to 2.6 mm, β is found to be 0.6 ± 0.5 where the flux measurement errors are taken into account. Next, we consider β in the dust models. Fig. 5 shows the mass absorptive opacity κ and the spectral opacity index β at λ = 1.1 mm for several spherical dust models, which are calculated using Mie scattering theory. The examined size distribution functions have an MRN-like form with p = 5.5, 4.5, 3.5 (G3) and 2.5 (G4). The minimum size amin is set to be 1.0 μm and the maximum sizes that were examined range from 1.0 to 10 000 μm. β is constant at ∼2 for amax ≤ 100.0 μm, as is known for IS dust. The behaviour of β does not change much for amin ≲ 10 μm. An anomalous β > 2 is seen at 100 μm ≤ amax ≤ 400 μm. This is due to a sudden drop in the opacity at x ∼ 1, as seen in the top panel. For amax ≳ 400 μm, β monotonically decreases. The behaviour of β depends on the power index p. The absorptive opacity is πa2Q(a), where Q(a) is the absorptive coefficient. The fraction of dust opacity to grains with size a or larger, f(a), is given by f(a) ≳ (a3 − pmax − a3 − p)/(a3 − pmax − a3 − pmin). This should be the lower limit because Q depends on a and is less than unity at smaller a. The larger the p value, the smaller the fraction of large particles. In the dust models with p = 5.5 and 4.5, β stays ∼2 even with large amax values. In the G3 type, β decreases down to ∼1. Such a lower limit is reproduced in astronomical silicate particles (βmin ∼ 0.85; Draine 2006). A very low β < 1 in an oxygen-rich environment implies a lower p < 3.5, as seen in G4. We find that a dust model with amax = 5000 μm and p = 2.5 has β = 0.633, which agrees with the observations. We assume the representative temperature of 200 K, which actually varies between 100 and 700 K in the torus mid-plane, a distance of 3 kpc and a gas-to-dust mass ratio of 200. To fit the (sub)millimetre flux, the torus mass should be 2.59 M⊙ for the observed flux of 156 mJy at λ = 1.1 mm (van der Veen et al. 1995) and the dust opacity at this wavelength of 1.18 cm−2 g−1.
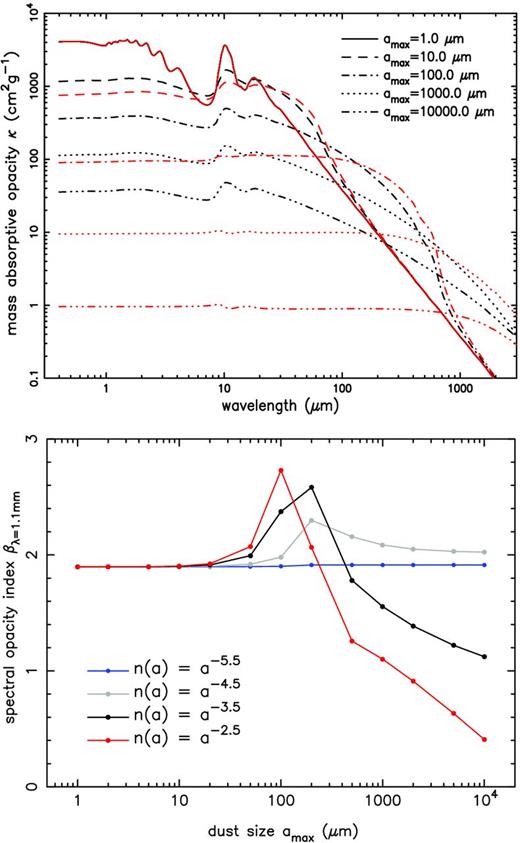
Top: mass absorptive opacity κ(λ) and bottom: spectral opacity indices β at λ = 1.1 mm as a function of the maximum size amax. The black and red lines denote dust models with a power index p of 3.5 and 2.5, respectively. The minimum size amin is set to be 1.0 μm. In the bottom panel, the dust models with a power index of 4.5 (grey) and 5.5 (blue) are also indicated. In the top panel, the plot for the amax = 1.0 μm model is identical to the single-sized dust with a radius of 1.0 μm.
With this dust model, we encounter the serious problem that the NIR flux cannot be reasonably fit. The reason is that the extinction cross-section of this dust model is too low in the NIR. It would be easier to understand this using our selected model as reference. The optical depth of the torus is found to be 52 at 5.0 μm. To fit the NIR flux with a dust model other than that used for the selected model, the optical depth of the torus should be kept constant. Namely CextMtorus should be constant because τtorus ∝ CextMtorus, where Cext is the extinction cross-section at λ = 5 μm. Table 2 lists β, κ, Cext and torus masses of two dust models. Whereas Cext of the dust model A (the selected model shown in Fig. 1) is high at 103 cm2 g−1, that for model B, which fits β, is only 4.54 cm2 g−1. The torus mass for model B is required to be unreliably large at 68.1 M⊙. Hence, the β value is more likely close to unity.
Dust model parameters for the torus.
| ID | amax/p | β | κ | Cext | Mtorus | |
|---|---|---|---|---|---|---|
| (μm/–) | (cm2 g−1) | (cm2 g−1) | (M⊙) | |||
| A | 10 000.0/3.5 | 1.12 | 1.44 | 103 | 3.0 | 2.11 |
| B | 5000.0/2.5 | 0.633 | 1.18 | 4.54 | 68.1 | 2.59 |
| ID | amax/p | β | κ | Cext | Mtorus | |
|---|---|---|---|---|---|---|
| (μm/–) | (cm2 g−1) | (cm2 g−1) | (M⊙) | |||
| A | 10 000.0/3.5 | 1.12 | 1.44 | 103 | 3.0 | 2.11 |
| B | 5000.0/2.5 | 0.633 | 1.18 | 4.54 | 68.1 | 2.59 |
The spectral opacity index β and the mass absorptive opacity κ are values at λ = 1.1 mm. The value of the extinction cross-section Cext is for λ = 5.0 μm. For the torus mass Mtorus, the values are obtained to keep a constant optical depth at 5.0 μm τ = 52 (left-hand column), i.e. CextMtorus is constant, and to fit the flux at λ = 1.1 mm (right-hand column).
In either estimations (Mtorus = 3.0 or 2.59 M⊙), the torus is massive. Even if a binary companion with mass of ∼1 M⊙ is assumed to exist in I18276's stellar system, it is unlikely that the derived torus has a pure Keplerian rotating motion. Rather a large fraction of the torus material should be radially expanding. A hydrodynamic simulation of a binary interacted outflow model shows a spiral structure in AGB shells even in the models that are classified as bipolar (Mastrodemos & Morris 1999). Similar features are detected in some AGB shells, e.g. NGC 3068 (Mauron & Huggins 2006) and R Scl (Maercker et al. 2012), although these are optically thin cases. In addition, up to now, a Keplerian rotating motion is detected only for the Red Rectangle (Bujarrabal et al. 2003) while other objects are found to have expanding motions for which the velocity is well studied from observations. Assuming an expansion velocity, Vexp, of 15 km s−1, which is an intermediate value of 12–17 km s−1 (Bowers et al. 1983; Heske et al. 1990; SC07), the torus is formed in ∼300 yr (=Rtorus/Vexp). To accumulate a mass of 3.0 M⊙, the mass-loss rate should be as high as ∼10−2 M⊙ yr−1. Large mass-loss rates lasting a short time at the very end of the AGB phase have been found in some other objects (e.g. Bujarrabal et al. 2001; Sánchez Contreras et al. 2004).
We briefly highlight the problem of dust growth in the torus. In some objects, for which large grains are detected, e.g. the Red Rectangle (Jura, Balm & Kahane 1995; van Winckel et al. 1998) and AFGL 2688 (Bieging & Nguyen 1996; Jura et al. 2000), a long-lived disc is also expected to be present. This is a quite natural expectation because the dust particles have a larger chance to collide and grow in size in a disc than in an expanding outflow, although this is still hypothesized. However, as mentioned above, only for the Red Rectangle a stable-rotating disc is detected. The Red Rectangle's Keplerian rotating disc is spatially resolved by CO emission line radio interferometry (Bujarrabal et al. 2005). These authors estimate a disc mass of 0.04 M⊙, a radius of 560 au and a central mass of ∼0.9 M⊙. This system is somewhat similar to the solar nebula besides the stellar luminosity. Hence, the dust growth in Red Rectangle can be explained with theories developed for the solar nebula (e.g. Weidenschilling 1980; Nakagawa, Sekiya & Hayashi 1986). On the other hand, in some objects like I18276 (this work) and IRAS 22036+5306 (Sahai et al. 2006), in which large fractions of large grains are expected in the torus, the torus mass is very high ( ≳ 1 M⊙) and expansion motions are detected. Further studies, in which the dust growth theory should be optimized for the circumstellar environment around evolved stars, are encouraged to better understand such massive large particles in the tori of these objects.
4 CONCLUSION
We modelled the CDS of the oxygen-rich bipolar PPN I18276 by means of 2D dust radiative transfer calculations. The previously observed SED and NIR polarimetric images were used to constrain the physical parameters. The primary aim of our work was to investigate the dust properties.
The polarization reaches 50–60 per cent in the bipolar lobes and is almost constant in the H and KS bands. This weak wavelength dependence and high values can be reproduced by dust models with a steeper power index of 5.5 of the size distribution function than IS dust. If the dust in I18276's envelope has conserved its properties since its formation during the AGB phase, mechanisms that break up large grains and increase the fraction of small particles, such as sputtering, may have also acted. Polarization measurements at a large wavelength range for various object classes of C-rich and O-rich and AGB stars to planetary nebulae will provide better constraints of the size distribution functions and will help our understanding of the dust formation and process in circumstellar environments.
We also investigated the dust properties in the torus. Two-candidate dust models were examined. One has a size distribution function of n(a) ∝ a−2.5 and amax = 5000 μm and the spectral opacity index β of 0.633. This model agrees with the observed β of 0.6 from the 760 μm to 2.6 mm fluxes; however, it reproduces too low IR flux because the opacity is too small. The other dust model has n(a) ∝ a−3.5 and amax = 10 000 μm and fits the SED over a wide wavelength range besides the (sub)millimetre opacity slope (β = 1.12). The torus masses are large for both models: 2.59 M⊙ (former) and 3.0 M⊙ (latter). In this massive torus, the material is probably radially expanding rather than purely rotating around the central star, as is expected in the previous CO emission line observations. If the expansion velocity of 15 km s−1, which is an intermediate value of the previous estimations, is assumed, the torus has been formed in ∼300 yr with a mass-loss rate of ∼10−2 M⊙ yr−1.
The NIR polarimetric images are obtained at the European Southern Observatory (proposal ID: 075.D-0268). The photometric and spectroscopic data are data produced from the Two Micron All Sky Survey, which is a joint project of the University of Massachusetts and the Infrared Processing and Analysis Center/California Institute of Technology, funded by the National Aeronautics and Space Administration and the National Science Foundation, AKARI, a JAXA project with the participation of ESA, Infrared Space Observatory and Infrared Astronomical Satellite.
