


Abstract
In this work, we analyse late-time (t > 100 d) optical spectra of low-redshift (z < 0.1) Type Ia supernovae (SNe Ia) which come mostly from the Berkeley Supernova Ia Program (BSNIP) data set. We also present spectra of SN 2011 by for the first time. The BSNIP sample studied consists of 34 SNe Ia with 60 nebular spectra, to which we add nebular spectral feature measurements of 20 SNe Ia from previously published work (Maeda et al. and Blondin et al.), representing the largest set of late-time SN Ia spectra ever analysed. The full width at half-maximum intensity and velocities of the [Fe iii] λ4701, [Fe ii] λ7155 and [Ni ii] λ7378 emission features are measured in most observations of spectroscopically normal objects where the data have signal-to-noise ratios ≳ 20 pixel−1 and are older than 160 d past maximum brightness. The velocities of all three features are seen to be relatively constant with time, increasing only a few to ∼20 km s−1 d−1. The nebular velocity (vneb, calculated by taking the average of the [Fe ii] λ7155 and [Ni ii] λ7378 velocities) is correlated with the near-maximum-brightness velocity gradient and early-time ejecta velocity. Nearly all high velocity gradient objects have redshifted nebular lines while most low velocity gradient objects have blueshifted nebular lines. No correlation is found between vneb and Δm15(B), and for a given light-curve shape there is a large range of observed nebular velocities. The data also indicate a correlation between observed (B − V)max and vneb.
1 INTRODUCTION
Type Ia supernovae (SNe Ia) can be used to accurately measure cosmological parameters (e.g. Astier et al. 2006; Riess et al. 2007; Wood-Vasey et al. 2007; Hicken et al. 2009; Kessler et al. 2009; Amanullah et al. 2010; Conley et al. 2011; Suzuki et al. 2012), and they led to the discovery of the accelerating expansion of the Universe (Riess et al. 1998; Perlmutter et al. 1999). SNe Ia are thought to be the result of thermonuclear explosions of C/O white dwarfs (e.g. Hoyle & Fowler 1960; Colgate & McKee 1969; Nomoto, Thielemann & Yokoi 1984; see Hillebrandt & Niemeyer 2000 for a review). Despite their cosmological utility, we are still missing a detailed understanding of the progenitor systems and explosion mechanisms (see Howell 2011 for further information).
By about 100 d past maximum brightness, SN Ia ejecta have expanded significantly and the SN enters the so-called nebular phase (as opposed to the ‘early-time’ phase). At these late epochs, SN Ia spectra consist of broad emission lines of (mostly) iron-group elements and can yield valuable insights into the physics of the explosion itself. However, SNe Ia often appear quite faint at these late phases and thus not many late-time spectra exist in the literature.
There are a handful of relatively ‘normal’ SNe Ia (i.e. ones that follow the light-curve width versus luminosity relationship; Phillips 1993) that have published spectra at phases later than ∼100 d (e.g. Stanishev et al. 2007; Stritzinger & Sollerman 2007; Leloudas et al. 2009). In addition, there are some rare and peculiar SNe Ia with published late-time spectra (e.g. Jha et al. 2006; Silverman et al. 2011). While there are large spectroscopic samples of SNe Ia published (Matheson et al. 2008; Blondin et al. 2012; Silverman et al. 2012a), only a tiny fraction of those data consist of late-time spectra. However, moderate-sized comparative studies of ∼14–24 SNe Ia with late-time spectra have been undertaken (Mazzali et al. 1998; Maeda et al. 2010a; Blondin et al. 2012).
These works have concentrated mainly on three broad emission features centred near 4701, 7155, and 7378 Å (see Fig. 1). The 4701 Å feature is likely a blend of various [Fe iii] lines (Stritzinger et al. 2006; Maeda et al. 2010b) which come from material produced by a supersonic burning front (i.e. a detonation; Maeda et al. 2010a). On the other hand, the 7155 Å feature is likely due to [Fe ii] (Maeda et al. 2010a) and the 7378 Å feature is probably from [Ni ii] (Maeda et al. 2010b). These are both thought to trace material from where the explosion began and where the burning initially proceeded subsonically (i.e. a deflagration; Maeda et al. 2010a).
![Spectrum of SN 2011by from 206 d past maximum brightness with prominent features labelled. The left-hand shaded area represents the [Fe iii] λ4701 feature while the right-hand shaded area represents the [Fe ii] λ7155 and [Ni ii] λ7378 features.](https://oup.silverchair-cdn.com/oup/backfile/Content_public/Journal/mnras/430/2/10.1093_mnras_sts674/2/m_sts674fig1.jpeg?Expires=1716409552&Signature=P1hXf3W98nMFitfBgz6s6fzfxq2RY~XW1uXF8~SBo3ziJTG~1U~2V5U1gv7z6AG~p2W3LWrkITlRNQtc1kbhB9af8QLrs3stEudX2x-A-v7Lj4jgdyVuC1ihxG8J7bWJNUBrS~9JBDwZxuFndaXB44AeznmI-KzP86sH0Om8KEMFfOfGFrIKghyZ9Wkxr27AridmnOHvHX7DoTdCN4zR9m2BM7NaVnFedIJGcf8RPz6mYPIFIxAwwul9dlH-7zhiHvcLMqa1KcjW0LnLqC1qTOQuQa-4aiuJz8naUnx53KgvRFZsZ0nsG7WRNdP10XHGDFKIW7EDQBD0FSP5m4dT0Q__&Key-Pair-Id=APKAIE5G5CRDK6RD3PGA)
Spectrum of SN 2011by from 206 d past maximum brightness with prominent features labelled. The left-hand shaded area represents the [Fe iii] λ4701 feature while the right-hand shaded area represents the [Fe ii] λ7155 and [Ni ii] λ7378 features.
To the previous late-time SN Ia spectral studies we now add this work, where we analyse 60 nebular-phase (t > 100 d) low-resolution optical spectra of 34 low-redshift (z < 0.1) SNe Ia obtained as part of the Berkeley SN Ia Program (BSNIP; Silverman et al. 2012a). The data are presented by Silverman et al. (2012a) (supplemented herein with one new object: SN 2011by),1 and we utilize spectral feature measurement tools similar to those described by Silverman, Kong & Filippenko (2012a). The spectral data used in this work are summarized in Section 2, and our method of spectral feature measurement and our determination of nebular velocities are described in Section 3. Comparison of our late-time spectral measurements to other SN Ia observables can be found in Section 4. We present our conclusions in Section 5.
2 DATA SET
The late-time spectral sample used in this work is a subset of spectra presented by Silverman et al. (2012a), with the addition of one new object (see Section 2.1). The majority of the spectra were obtained using the Shane 3 m telescope at Lick Observatory with the Kast double spectrograph (Miller & Stone 1993) and the 10 m Keck telescopes with the Low Resolution Imaging Spectrometer (LRIS; Oke et al. 1995). The Kast data typically cover 3300–10 400 Å with resolutions of ∼11 and ∼6 Å on the red and blue sides (crossover wavelength ∼5500 Å), respectively. The LRIS spectra usually have a range of 3100–9200 Å with resolutions of ∼7 and ∼5.5 Å on the red and blue sides (crossover wavelength ∼5600 Å), respectively.
All data were reduced using standard reduction methods. For more information regarding the observations and data reduction, see Silverman et al. (2012a). The spectral ages of the BSNIP data referred to throughout this work are calculated using the redshift and Julian Date of maximum presented in table 1 of Silverman et al. (2012a). Furthermore, photometric parameters (such as light-curve width and colour information) used in the present study can be found in Ganeshalingam et al. (2010).
Nebular feature measurements. All FWHMs and velocities are in km s−1. Uncertainties are given in parentheses.
| FWHM | Velocity | Velocity | Velocity | FWHM | Velocity | Velocity | Velocity | ||||
|---|---|---|---|---|---|---|---|---|---|---|---|
| SN name | Phasea | [Fe iii] λ4701 | [Fe iii] λ4701 | [Fe ii] λ7155 | [Ni ii] λ7378 | SN name | Phasea | [Fe iii] λ4701 | [Fe iii] λ4701 | [Fe ii] λ7155 | [Ni ii] λ7378 |
| SN 1989M | 146.8 | 15 000 (900) | −2800 (160) | 660 (40) | 450 (30) | SN 2001ep | 114.9 | 12 400 (900) | −3370 (190) | – | – |
| SN 1991T | 112.2 | 14 300 (1500) | −2710 (130) | – | – | SN 2002bo | 227.4 | 16 600 (1300) | −1620 (80) | 2330 (120) | 2530 (200) |
| SN 1991T | 318.4 | 17 200 (1700) | 810 (60) | – | – | SN 2002cs | 119.0 | 15 500 (1300) | −3810 (270) | – | – |
| SN 1991T | 347.2 | 17 000 (1400) | 1810 (90) | – | – | SN 2002cs | 143.5 | 15 000 (1100) | −4280 (220) | – | – |
| SN 1991bg | 161.9 | 3200 (300) | −1840 (110) | – | – | SN 2002cs | 172.2 | 15 800 (1600) | −3720 (220) | – | – |
| SN 1992G | 110.8 | 14 700 (1000) | −3000 (200) | – | – | SN 2002dp | 103.1 | 14 300 (1100) | −4080 (250) | – | – |
| SN 1992G | 111.9 | 14 700 (1000) | −3130 (260) | – | – | SN 2002dp | 134.7 | 13 800 (1200) | −2630 (120) | – | – |
| SN 1992G | 126.8 | 16 000 (1500) | −2990 (160) | – | – | SN 2002fk | 148.7 | 14 600 (1000) | −2650 (160) | −1370 (90) | −2750 (200) |
| SN 1993Z | 112.5 | 15 100 (1100) | −2120 (120) | – | – | SN 2003gs | 199.5 | 14 700 (1200) | −2630 (150) | 3870 (260) | 1210 (80) |
| SN 1993Z | 132.4 | 15 000 (1600) | −2120 (130) | – | – | SN 2004bv | 135.2 | 14 200 (1400) | −3300 (280) | – | – |
| SN 1993Z | 144.3 | 14 800 (1200) | −1230 (80) | – | – | SN 2004bv | 161.7 | 14 300 (1100) | −2530 (140) | – | – |
| SN 1993Z | 161.2 | 14 400 (1400) | −1350 (100) | 1820 (100) | 1180 (90) | SN 2004dt | 109.2 | 13 600 (1200) | −4970 (250) | – | – |
| SN 1993Z | 200.8 | 15 300 (1100) | −2880 (200) | 1900 (150) | 3660 (290) | SN 2004dt | 168.9 | – | – | −1470 (100) | −4220 (360) |
| SN 1993Z | 232.7 | 14 400 (900) | −720 (50) | 1000 (60) | 2390 (190) | SN 2005cf | 317.1 | 15 400 (1200) | −530 (20) | 410 (40) | 1400 (80) |
| SN 1994D | 114.7 | 15 400 (1100) | −3010 (170) | −2280 (150) | −1150 (100) | SN 2005ke | 362.1 | 10 500 (700) | −430 (30) | – | – |
| SN 1994ae | 144.0 | 14 500 (1200) | −2430 (140) | – | – | SN 2006D | 126.5 | 14 200 (1000) | −3320 (200) | – | – |
| SN 1994ae | 218.6 | 12 200 (900) | −890 (60) | – | – | SN 2006X | 126.3 | 15 200 (1400) | −2970 (160) | 3420 (230) | 2320 (160) |
| SN 1998bp | 139.4 | 8700 (600) | −3490 (220) | – | – | SN 2006X | 275.9 | 19 300 (1400) | 1210 (70) | 2610 (170) | 2730 (220) |
| SN 1998bp | 163.1 | 10 600 (500) | −2340 (150) | – | – | SN 2006X | 358.4 | 23 700 (2500) | −3290 (190) | 1960 (140) | 3180 (200) |
| SN 1998bu | 235.1 | 15 600 (1300) | −1030 (50) | −1890 (150) | −790 (60) | SN 2007af | 113.8 | 13 300 (1200) | −2920 (140) | – | – |
| SN 1998bu | 279.0 | 16 400 (1100) | −2040 (140) | −1710 (150) | −1430 (110) | SN 2007af | 121.7 | 13 300 (1300) | −2790 (190) | – | – |
| SN 1998bu | 338.7 | 22 200 (1900) | −650 (40) | −2640 (200) | −2330 (220) | SN 2007af | 144.6 | 13 100 (1100) | −3170 (200) | – | – |
| SN 1998es | 106.0 | 13 500 (1300) | −3790 (260) | – | – | SN 2007af | 158.5 | 13 600 (1300) | −3550 (210) | – | – |
| SN 1999aa | 255.9 | 16 700 (1500) | −1030 (60) | 830 (40) | 690 (50) | SN 2007fb | 100.9 | 13 700 (1300) | −3590 (240) | – | – |
| SN 1999aa | 281.5 | 18 500 (1500) | 520 (30) | – | – | SN 2007gi | 153.3 | 15 800 (1400) | −1440 (90) | – | – |
| SN 1999ac | 116.9 | 10 300 (800) | −2200 (120) | – | – | SN 2007le | 304.7 | 16 700 (1600) | −230 (10) | 2160 (150) | 1890 (160) |
| SN 1999by | 183.5 | 9500 (700) | −1440 (100) | – | – | SN 2007sr | 135.7 | 13 700 (1200) | −2280 (110) | – | – |
| SN 1999cw | 104.6 | 14 400 (1400) | −2920 (170) | – | – | SN 2008Q | 199.3 | 15 700 (1400) | −1860 (90) | −2940 (270) | −1450 (120) |
| SN 1999cw | 132.1 | 13 600 (900) | −2410 (150) | – | – | SN 2011by | 206.1 | 14 500 (1300) | −2260 (120) | −1350 (100) | −1470 (120) |
| SN 1999gh | 118.0 | 12 200 (1100) | −4200 (260) | 1290 (90) | 1840 (130) | SN 2011by | 309.7 | 15 300 (1200) | −280 (20) | −1210 (70) | −1750 (150) |
The BSNIP sample contains 81 spectra of 43 SNe Ia older than 100 d past maximum brightness. In order to measure the three emission features mentioned above (i.e. [Fe iii] λ4701, [Fe ii] λ7155 and [Ni ii] λ7378), we required that the spectra span ∼4300–7250 Å, which decreased the sample to 73 spectra of 38 SNe Ia. In previous BSNIP studies (Silverman et al. 2012a), we a priori ignored the extremely peculiar SN 2000cx (e.g. Li et al. 2001a), SN 2002cx (e.g. Li et al. 2003; Jha et al. 2006), SN 2005gj (e.g. Aldering et al. 2006; Prieto et al. 2007) and SN 2005hk (e.g. Chornock et al. 2006; Phillips et al. 2007). These objects are so spectroscopically peculiar that it is difficult to consistently measure their spectral features in comparison to the bulk of the SN Ia population. Thus, in this work we will only concentrate on the SNe Ia that follow the ‘Phillips relation’ (Phillips 1993) and can be used as cosmological distance indicators. We also include the underluminous SN 1991bg-like objects, which lie on a quadratic relationship between light-curve width and luminosity (e.g. Filippenko et al. 1992b; Leibundgut et al. 1993).
After removing the peculiar objects mentioned above, we are left with 33 SNe Ia with 58 BSNIP spectra having t > 100 d. Of these, seven were in the late-time sample studied by Maeda et al. (2010a), and those seven plus two more were in the sample of Blondin et al. (2012). Each of the objects studied herein and the spectral phases are listed in Table 1, along with the full width at half-maximum intensity (FWHM) and velocity of the [Fe iii] λ4701 feature, and the velocities of the [Fe ii] λ7155 and [Ni ii] λ7378 features.
2.1 SN 2011by
To the BSNIP sample discussed above we also add new data for the nearby Type Ia SN 2011by (see Appendix A for more information). We obtained broad-band BVRI photometry as well as seven near-maximum-brightness spectra and two late-time spectra of SN 2011by. All of these data indicate that SN 2011by is photometrically (Δm15(B) = 1.14 ± 0.03 mag) and spectroscopically normal.
SN 2011by will serve as a high-quality individual case study that can be directly compared to the larger late-time BSNIP sample discussed above. Adding this object and its two late-time spectra to the aforementioned data set yields a sample of 60 spectra of 34 SNe Ia with t > 100 d past maximum brightness. This represents one of the largest sets of late-time SN Ia spectra ever analysed.
3 MEASURING NEBULAR SPECTRAL FEATURES
The algorithm used in this work to measure the [Fe iii] λ4701, [Fe ii] λ7155 and [Ni ii] λ7378 emission features is similar to that used to measure absorption features in near-maximum-brightness BSNIP spectra. It is described in detail by Silverman et al. (2012a), but here we give a brief summary of the procedure. Each spectrum first has its host-galaxy recession velocity removed and is corrected for Galactic reddening (according to the values presented in table 1 of Silverman et al. 2012a), and then is smoothed using a Savitzky–Golay smoothing filter (Savitzky & Golay 1964).
For each feature, a linear background is defined by connecting points on either side of the feature and then subtracting out that background flux level. A cubic spline is then fitted to the smoothed data and the expansion velocity is calculated from the wavelength at which the spline fit reaches its maximum. This maximum is also used to measure the FWHM for the [Fe iii] λ4701 feature.
[Fe iii] λ4701 is usually the strongest feature in late-time SN Ia spectra and is often seen to be a single-peaked, distinct feature. On the other hand, [Fe ii] λ7155 and [Ni ii] λ7378 are found to be blended into either a single- or double-peaked broad emission feature. Any spectrum where the two features were severely blended with each other (or showed more than two peaks near the wavelengths of interest) did not have velocities measured for [Fe ii] λ7155 and [Ni ii] λ7378. For the spectra that do show clearly double-peaked profiles, a cubic spline is again fitted to the smoothed data and the expansion velocities are calculated from the wavelengths at which the spline fit reaches its maximum on either side of the local minimum (i.e. the point between the two peaks). The FWHM and velocity of the [Fe iii] λ4701 feature and the velocities of the [Fe ii] λ7155 and [Ni ii] λ7378 features are displayed in Table 1.
While we were able to measure [Fe iii] λ4701 in all late-time spectra presented herein whose wavelength range included this feature, we were only able to accurately measure the velocities of [Fe ii] λ7155 and [Ni ii] λ7378 in 22 spectra of 15 SNe Ia (nebular velocities of six of these objects have been calculated previously; Maeda et al. 2010a; Blondin et al. 2012). In these previous studies, velocities were reported even when there was only a single peak near these wavelengths. With only one peak, however, it is not clear which reference wavelength to use when calculating a nebular velocity, and so for a velocity measurement in this work we require that exactly two peaks be present in a late-time spectrum.
The underluminous SN 1991bg-like objects (e.g. Filippenko et al. 1992b; Leibundgut et al. 1993) have narrower emission profiles than do normal SNe Ia at late times, but they do not typically show the [Fe ii] λ7155 and [Ni ii] λ7378 features. Furthermore, the SN 1991T-like objects (e.g. Filippenko et al. 1992a; Phillips et al. 1992) and SN 1999aa-like objects (e.g. Li et al. 2001b; Strolger et al. 2002; Garavini et al. 2004), which together generally represent overluminous SNe Ia, often have complex and multipeaked profiles near 7300 Å, and thus we are again unable to accurately measure the velocities of [Fe ii] λ7155 and [Ni ii] λ7378 for most of these objects. We are, however, able to measure velocities in one spectrum of SN 1999aa. Note that Maeda et al. (2010a) cut these peculiar objects from their sample as well. Of the remaining ‘normal’ SNe Ia, six of the spectra in which we are unable to reliably measure these features have low signal-to-noise ratios (S/N ≲ 20 pixel−1), with three of those having S/N < 5 pixel−1, and all normal SN Ia spectra with S/N > 20 pixel−1 were successfully measured.
Even after removing 9 spectra of peculiar SNe Ia and 6 spectra with low S/N, there are still 23 instances where we are unable to measure reliable velocities for the [Fe ii] λ7155 and [Ni ii] λ7378 features. Nearly all of these failures are due to the spectra being obtained at too young a phase. Fig. 2 shows a histogram of the ages of the spectra investigated in this work, after removing peculiar objects and low-S/N spectra. The grey histogram represents the ages of spectra in which we are unable to measure [Fe ii] λ7155 and [Ni ii] λ7378 velocities, while the white histogram represents ages where we successfully measure the velocities. At epochs less than ∼160 d past maximum brightness, the emission near 7300 Å is often still multipeaked and too complex to definitively identify the [Fe ii] λ7155 and [Ni ii] λ7378 features. Thus, in order to be able to measure these velocities, one should wait until ∼160 d past maximum, after which time we are able to measure the velocity in 16 of 17 spectra. Despite this finding, there are some BSNIP spectra at 115, 118, 126, 147 and 149 d past maximum that have measured velocities.
![Histogram of spectral ages after removing peculiar objects and low-S/N spectra. The grey area represents spectra in which we are unable to measure [Fe ii] λ7155 and [Ni ii] λ7378 velocities. The white area represents spectra in which we can measure these velocities. Note that the vast majority of spectra with t > 160 d have measured velocities.](https://oup.silverchair-cdn.com/oup/backfile/Content_public/Journal/mnras/430/2/10.1093_mnras_sts674/2/m_sts674fig2.jpeg?Expires=1716409552&Signature=o3XN5fnfd2Ky8L9iyB3br3Ov1vQujp0V-WfijD5f1V82usiTtNUG1ORVRQdcvyfP~eYQTW3vvm3GJdzEGg9VaSunMH0ahWAZsIMyiIZ1QM3VD50eaEYCB1wfDax27Iz4N2VnOiF5XntnKRRynDcTmdPrVJjPW0b0KvcAnfiEhRwnEbEg88NpZIzWFmqY7vL0A1ORSfvJyH4tkcPmnPk2~dti5F5vxIgL4hoVmNj9XwcI5aKQYMvufUqFfssTroQcw0GktFgOmf3pmmj9kr~vp6VAKuHT3qeURRO0amK3p3Sx~BirV21xDtEVgb2jHXVmLXyPWOauqImxxayi03mtng__&Key-Pair-Id=APKAIE5G5CRDK6RD3PGA)
Histogram of spectral ages after removing peculiar objects and low-S/N spectra. The grey area represents spectra in which we are unable to measure [Fe ii] λ7155 and [Ni ii] λ7378 velocities. The white area represents spectra in which we can measure these velocities. Note that the vast majority of spectra with t > 160 d have measured velocities.
The oldest spectrum in our sample is from 362 d past maximum brightness, but it is SN 1991bg-like and we are unable to measure the velocities of the [Fe ii] λ7155 and [Ni ii] λ7378 features. The next-oldest spectrum is from 358 d past maximum and in that case we are able to measure the velocities accurately. Thus, the epoch range in which we successfully measure nebular velocities of [Fe ii] λ7155 and [Ni ii] λ7378 is 115–358 d past maximum, with the majority of the spectra in the range 160–358 d past maximum. Both Maeda et al. (2010a) and Blondin et al. (2012) had a similar range (∼150–400 d past maximum), with the vast majority of their spectra being older than ∼200 d past maximum.
3.1 Calculating nebular velocities
Following Maeda et al. (2010a) and Blondin et al. (2012), we calculate nebular velocities from the mean of the individual velocities of the [Fe ii] λ7155 and [Ni ii] λ7378 features. Thus, the nebular velocity represents the typical velocity of material synthesized at the earliest times in the SN explosion. Previous studies used the difference between the two velocities as the uncertainty of the nebular velocity, but we use the difference divided by 2 (since that is how much the average differs from each measurement).
For the four SNe Ia in which we are able to measure both velocities in multiple late-time spectra, the nebular velocity is the average of all [Fe ii] λ7155 and [Ni ii] λ7378 velocities and the uncertainty is the average difference. The calculated nebular velocities (vneb) of all 15 SNe Ia with [Fe ii] λ7155 and [Ni ii] λ7378 velocity measurements are listed in the ninth column of Table 2, along with various classifications and other measured properties.
Summary of objects studied. Uncertainties are given in parentheses.
| SN Name | Δm15(B)a | (B − V)maxa | Wang | Si ii λ6355 Vel.c | Benetti|$^{\phantom{{\rm dj}}}$| | |$\dot{v}$|e | v0f | Nebular Vel.g | EW (Na) | EW (Ca) |
|---|---|---|---|---|---|---|---|---|---|---|
| (mag) | (mag) | typeb | (103 km s−1) | type|$^{{\rm d}\phantom{{\rm j}}}$| | (km s−1 d−1) | (103 km s−1) | (km s−1) | (Å) | (Å) | |
| SN 1989M | 1.10 (0.20)|$\phantom{^{\rm k}}$| | –|$\phantom{^{\rm k}}$| | HV|$\phantom{^{\rm i}}$| | 12.46 (0.10)|$\phantom{^{\rm h}}$| | HVG|$\phantom{^{\rm hj}}$| | 291.84 (139.49)|$\phantom{^{\rm hj}}$| | 13.19 (0.42)|$\phantom{^{\rm hj}}$| | 560 |$\phantom{0}$|(110) | 1.88 (0.73) | 0.36 (0.18) |
| SN 1993Z | –|$\phantom{^{\rm k}}$| | –|$\phantom{^{\rm k}}$| | |$\text{--}\phantom{^{\rm i}}$| | –|$\phantom{^{\rm h}}$| | –|$\phantom{^{\rm hj}}$| | |$\text{--}\phantom{^{\rm hj}}$| | |$\text{--}\phantom{^{\rm hj}}$| | 1990 |$\phantom{0}$|(630) | 1.56 (0.40) | 0.96 (1.67) |
| SN 1994D† | 1.36 (0.05)|$\phantom{^{\rm k}}$| | −0.053 (0.035)|$\phantom{^{\rm k}}$| | N|$\phantom{^{\rm i}}$| | 10.72 (0.10)|$\phantom{^{\rm h}}$| | LVG|$\phantom{^{\rm hj}}$| | 33.43 |$\phantom{00}$|(6.77)|$\phantom{^{\rm hj}}$| | 10.60 (0.05)|$\phantom{^{\rm hj}}$| | −1720 |$\phantom{0}$|(570) | 0.40 (0.44) | 0.09 (0.08) |
| SN 1998bu | 1.05 (0.03)|$\phantom{^{\rm k}}$| | |$\phantom{-}$|0.292 (0.032)|$\phantom{^{\rm k}}$| | N|$\phantom{^{\rm i}}$| | 10.84 (0.11)h | LVG|$^{{\rm h}\phantom{{\rm j}}}$| | 46.52 |$\phantom{00}$|(5.38)|$^{{\rm h}\phantom{{\rm j}}}$| | 11.01 (0.05)|$^{{\rm h}\phantom{{\rm j}}}$| | −1800 |$\phantom{0}$|(280) | 1.52 (1.12) | 0.39 (0.19) |
| SN 1999aa† | 0.79 (0.05)|$\phantom{^{\rm k}}$| | −0.093 (0.033)|$\phantom{^{\rm k}}$| | |$\text{--}^{\rm i}$| | 10.50 (0.10)|$\phantom{^{\rm h}}$| | LVG|$^{{\rm j}\phantom{{\rm h}}}$| | 14.33 |$\phantom{00}$|(3.52)|$^{{\rm j}\phantom{{\rm h}}}$| | 10.49 (0.03)|$^{{\rm j}\phantom{{\rm h}}}$| | 760 |$\phantom{00}$|(70) | 0.44 (0.64) | 0.27 (0.14) |
| SN 1999gh† | 1.69 (0.05)|$\phantom{^{\rm k}}$| | |$\phantom{-}$|0.190 (0.000)|$\phantom{^{\rm k}}$| | N|$\phantom{^{\rm i}}$| | 11.02 (0.10)|$\phantom{^{\rm h}}$| | FAINT|$\phantom{^{\rm hj}}$| | 46.49 |$\phantom{0}$|(10.13)|$\phantom{^{\rm hj}}$| | 11.20 (0.13)|$\phantom{^{\rm hj}}$| | 1570 |$\phantom{0}$|(280) | 0.50 (0.25) | – |
| SN 2002bo | 1.15 (0.04)|$\phantom{^{\rm k}}$| | |$\phantom{-}$|0.315 (0.052)|$\phantom{^{\rm k}}$| | HV|$\phantom{^{\rm i}}$| | 13.88 (0.10)|$\phantom{^{\rm h}}$| | HVG|$\phantom{^{\rm hj}}$| | 245.14 |$\phantom{00}$|(8.12)|$\phantom{^{\rm hj}}$| | 13.61 (0.09)|$\phantom{^{\rm hj}}$| | 2430 (100) | 2.36 (0.53) | 0.57 (0.31) |
| SN 2002fk† | 1.20 (0.03)|$\phantom{^{\rm k}}$| | −0.155 (0.032)|$\phantom{^{\rm k}}$| | N|$\phantom{^{\rm i}}$| | |$\phantom{0}$|9.51 (0.10)|$\phantom{^{\rm h}}$| | LVG|$^{{\rm j}\phantom{{\rm h}}}$| | 11.21 |$\phantom{00}$|(8.28)|$^{{\rm j}\phantom{{\rm h}}}$| | 9.74 (0.05)|$^{{\rm j}\phantom{{\rm h}}}$| | −2060 |$\phantom{0}$|(690) | 0.46 (0.09) | 0.26 (0.07) |
| SN 2003gs | 1.83 (0.02)k | |$\phantom{-}$|0.634 (0.021)k | |$\text{--}\phantom{^{\rm i}}$| | 11.00 (0.20)k | –|$\phantom{^{\rm hj}}$| | |$\text{--}\phantom{^{\rm hj}}$| | |$\text{--}\phantom{^{\rm hj}}$| | 2540 (1330) | 0.98 (0.49) | – |
| SN 2004dt | 1.29 (0.05)|$\phantom{^{\rm k}}$| | −0.080 (0.034)|$\phantom{^{\rm k}}$| | HV|$\phantom{^{\rm i}}$| | 14.34 (0.10)|$\phantom{^{\rm h}}$| | HVG|$\phantom{^{\rm hj}}$| | 269.45 |$\phantom{00}$|(8.34)|$\phantom{^{\rm hj}}$| | 14.70 (0.10)|$\phantom{^{\rm hj}}$| | −2850 (1380) | 1.80 (1.04) | – |
| SN 2005cf† | 1.08 (0.03)|$\phantom{^{\rm k}}$| | −0.062 (0.031)|$\phantom{^{\rm k}}$| | N|$\phantom{^{\rm i}}$| | 10.26 (0.10)|$\phantom{^{\rm h}}$| | HVG|$\phantom{^{\rm hj}}$| | 106.69 (149.59)|$\phantom{^{\rm hj}}$| | 10.13 (0.25)|$\phantom{^{\rm hj}}$| | 910 |$\phantom{0}$|(500) | 0.14 (0.09) | 0.53 (0.26) |
| SN 2006X | 1.10 (0.04)|$\phantom{^{\rm k}}$| | |$\phantom{-}$|1.260 (0.034)|$\phantom{^{\rm k}}$| | HV|$\phantom{^{\rm i}}$| | 15.26 (0.10)|$\phantom{^{\rm h}}$| | HVG|$^{{\rm j}\phantom{{\rm h}}}$| | 184.80 |$\phantom{00}$|(5.82)|$^{{\rm j}\phantom{{\rm h}}}$| | 15.63 (0.06)|$^{{\rm j}\phantom{{\rm h}}}$| | 2700 |$\phantom{0}$|(410) | 2.04 (1.61) | 1.05 (0.46) |
| SN 2007le | 1.02 (0.04)|$\phantom{^{\rm k}}$| | |$\phantom{-}$|0.280 (0.039)|$\phantom{^{\rm k}}$| | HV|$\phantom{^{\rm i}}$| | 12.09 (0.10)|$\phantom{^{\rm h}}$| | HVG|$\phantom{^{\rm hj}}$| | 93.35 |$\phantom{0}$|(12.65)|$\phantom{^{\rm hj}}$| | 12.77 (0.18)|$\phantom{^{\rm hj}}$| | 2030 |$\phantom{0}$|(140) | 2.36 (0.62) | 0.33 (0.17) |
| SN 2008Q† | 1.25 (0.08)|$\phantom{^{\rm k}}$| | −0.012 (0.031)|$\phantom{^{\rm k}}$| | HV|$\phantom{^{\rm i}}$| | 11.09 (0.10)|$\phantom{^{\rm h}}$| | HVG|$^{{\rm j}\phantom{{\rm h}}}$| | 82.66 |$\phantom{0}$|(16.22)|$^{{\rm j}\phantom{{\rm h}}}$| | 11.64 (0.05)|$^{{\rm j}\phantom{{\rm h}}}$| | −2200 |$\phantom{0}$|(750) | 0.44 (0.22) | – |
| SN 2011by | 1.14 (0.03)|$\phantom{^{\rm k}}$| | −0.061 (0.032)|$\phantom{^{\rm k}}$| | N|$\phantom{^{\rm i}}$| | 10.35 (0.14)|$\phantom{^{\rm h}}$| | LVG|$\phantom{^{\rm hj}}$| | 52.83 |$\phantom{00}$|(8.76)|$\phantom{^{\rm hj}}$| | 10.40 (0.08)|$\phantom{^{\rm hj}}$| | −1450 |$\phantom{0}$|(170) | 0.66 (0.16) | 0.47 (0.41) |
†Object is part of the low-extinction sample (see the text for details).
aValues taken from Ganeshalingam et al. (2010).
bClassification based on the velocity of the Si ii λ6355 line near maximum brightness (Wang et al. 2009). ‘HV’ = high velocity; ‘N’ = normal. Taken from Silverman et al. (2012a).
cVelocity of the Si ii λ6355 feature within 8 d of maximum brightness. Taken from Silverman et al. (2012a) unless otherwise noted.
dClassification based on the velocity gradient of the Si ii λ6355 line (Benetti et al. 2005). ‘HVG’ = high velocity gradient; ‘LVG’ = low velocity gradient; ‘FAINT’ = faint/underluminous. Taken from Silverman et al. (2012a) unless otherwise noted.
eChange in velocity with time, near maximum brightness (i.e. the velocity gradient). Taken from Silverman et al. (2012a) unless otherwise noted.
fVelocity of the Si ii λ6355 feature extrapolated to t = 0 d based on the velocity gradient. Taken from Silverman et al. (2012a) unless otherwise noted.
gAverage nebular velocity of the [Fe ii] λ7155 and [Ni ii] λ7378 features for all late-time spectra of a given object. The uncertainty is the average difference between the velocity of the two features.
hSi ii λ6355 velocity, Benetti type, velocity gradient and v0 measured from data presented by Matheson et al. (2008).
iClassification scheme only applies to spectroscopically normal SNe Ia.
jBenetti type, velocity gradient and v0 measured from BSNIP data as well as data presented by Blondin et al. (2012).
The second column of Table 2 gives the decline rate of the light curve, Δm15(B), and the third column shows the observed B − V colour of the SN at B-band maximum brightness, (B − V)max, both taken from Ganeshalingam et al. (2010). Also displayed in the table is the velocity of the Si ii λ6355 feature within 8 d of maximum brightness (fifth column) and a classification based on that velocity of either normal velocity or high velocity (fourth column; e.g. Wang et al. 2009). The rate of decrease of the expansion velocity, also known as the velocity gradient (|$\dot{v}$|, seventh column), and the velocity of the Si ii λ6355 feature extrapolated to t = 0 d using |$\dot{v}$| (v0, eighth column) are also shown in Table 2 along with a classification based on |$\dot{v}$| (sixth column; e.g. Benetti et al. 2005). The tenth (eleventh) column of the table is the equivalent width (EW) of narrow Na i D (Ca ii H&K) absorption from the host galaxy of each SN (see Section 4.3.1 for more information on these measurements). Objects listed with a ‘dagger’ are part of the low-extinction sample (see Section 4.3.2). Note that while most of the measurements come directly from Silverman et al. (2012a), some of the near-maximum-light Si ii λ6355 velocities were measured from data presented by Matheson et al. (2008) and Blondin et al. (2012).
The range of nebular velocities calculated in this study is approximately ±2900 km s−1, similar to the range found in previous work (Maeda et al. 2010a; Blondin et al. 2012). A comparison of the nebular velocities of the six SNe Ia that are found in the current sample as well as previous studies shows that the values calculated herein are consistent with previous work, with average absolute differences of a few hundred km s−1 and no detectable bias (Maeda et al. 2010a, 2011; Blondin et al. 2012). The average uncertainty of vneb (which is half the difference between the individual velocities of the [Fe ii] λ7155 and [Ni ii] λ7378 features) is ∼490 km s−1, slightly larger than the typical uncertainty in the measurements of Maeda et al. (2010a).
4 ANALYSIS
4.1 [Fe iii] λ4701
The FWHM of the [Fe iii] λ4701 feature has been seen to possibly be anticorrelated with Δm15(B) (Mazzali et al. 1998). In that work, both overluminous SN 1991T-like objects and underluminous SN 1991bg-like objects were found to follow the correlation. More recently, Blondin et al. (2012) found a similar result with a Pearson correlation coefficient of −0.71 for all of their late-time data, but when their two underluminous SNe Ia were removed it decreased to −0.17 (i.e. no correlation). This latter result was questioned, however, due to the fact that spectra at epochs earlier than 250–300 d past maximum brightness were used (Mazzali & Hachinger 2012).
Fig. 3 shows the FWHM measurements of the [Fe iii] λ4701 feature versus Δm15(B) from the BSNIP spectra, as well as previously published values for 18 SNe (Maeda et al. 2011; Blondin et al. 2012). The shape of each data point signifies its ‘Benetti type’ (based on |$\dot{v}$|): squares represent low velocity gradient (LVG) objects, triangles high velocity gradient (HVG) objects, stars FAINT objects and circles objects for which we are unable to determine a Benetti Type. The colour of each point represents its ‘Wang type’ (based on Si ii λ6355 velocity): blue is for normal-velocity objects, red is for HV objects and black is objects for which we are unable to determine a Wang type. Some of the outlying points are labelled with their object name.
![FWHM of [Fe iii] λ4701 versus Δm15(B) from BSNIP and 18 objects from Maeda et al. (2011) and Blondin et al. (2012). The squares represent the LVG objects, the triangles HVG objects, the stars FAINT objects and circles objects for which we are unable to determine a Benetti type. The blue points indicate normal-velocity objects, the red points HV objects and the black points objects for which we are unable to determine a Wang type. Some of the outlying points are labelled. Linear fits to the data are also displayed: all data (solid), after removing SN 1991bg (dashed) and after removing all six objects with Δm15(B) > 1.6 mag (dotted).](https://oup.silverchair-cdn.com/oup/backfile/Content_public/Journal/mnras/430/2/10.1093_mnras_sts674/2/m_sts674fig3.jpeg?Expires=1716409552&Signature=t~MQoR1Xp3mVQShXqBjDjlVKnY16WrY2nr1xzDI3W-F61Bv51fRrlJBtzRyOxd-wO-lipEwVsrmNmBFhbfPfCx4ZP5MRoOwQ3Yde1l-IRw59IxAQdWHAnw8Z-JdAGL~35Bw~RcPfb7tWfv1siowlByHkKOqzSzmmECMsJehBQATvYLe5IGPYJHkd44zCFBCXQAILEQBeEuzhEG1eJTFSdnwiWLTWdn7efl~kD-VwcoFCkUhFYbOXPfQuUH6gj7KUDS8p0M0UgZQIBbIQ246EK2jzho1HnnEMYEqNNiwlwdZoK19xCAq4DTJ9vSIEF9RIA05kxKBVLIQdCbWDpqu3LQ__&Key-Pair-Id=APKAIE5G5CRDK6RD3PGA)
FWHM of [Fe iii] λ4701 versus Δm15(B) from BSNIP and 18 objects from Maeda et al. (2011) and Blondin et al. (2012). The squares represent the LVG objects, the triangles HVG objects, the stars FAINT objects and circles objects for which we are unable to determine a Benetti type. The blue points indicate normal-velocity objects, the red points HV objects and the black points objects for which we are unable to determine a Wang type. Some of the outlying points are labelled. Linear fits to the data are also displayed: all data (solid), after removing SN 1991bg (dashed) and after removing all six objects with Δm15(B) > 1.6 mag (dotted).
As in previous studies (Mazzali et al. 1998; Blondin et al. 2012), the BSNIP data show that the FWHM of [Fe iii] λ4701 is anticorrelated with Δm15(B) (Pearson correlation coefficient of −0.66) and the linear fit to all of the data is shown as the solid line in Fig. 3. The slope of this line, −0.073 mag/(103 km s−1), is consistent with that of Blondin et al. (2012) but inconsistent with that of Mazzali et al. (1998), and the correlation is significant at the >3σ level. If we remove only the underluminous SN 1991bg, the linear fit is nearly unchanged (the dashed line in the figure) and the correlation weakens only slightly (Pearson coefficient of −0.61). If we instead remove the eight objects with Δm15(B) > 1.6 mag (i.e. all of the underluminous objects in the data set), the correlation effectively disappears (Pearson coefficient of −0.34) and the slope of the linear fit (the dotted line in Fig. 3) is consistent with 0 at the ∼2σ level.
The findings of Blondin et al. (2012) confirmed above have recently been questioned due to their use of spectra at epochs earlier than 250–300 d past maximum brightness (Mazzali & Hachinger 2012). To investigate this possibility, we performed a separate analysis of the FWHM of the [Fe iii] λ4701 feature versus Δm15(B) using only the oldest spectra from BSNIP, Maeda et al. (2011), and Blondin et al. (2012). There were 16 (8) objects with spectra obtained at t > 250 d (300 d) past maximum brightness, and only a modest anticorrelation was found for these data with a Pearson coefficient of −0.55 (−0.69). When removing the two (one) underluminous objects with Δm15(B) > 1.6 mag having spectra at these latest epochs, the possible correlation completely disappears. Thus, it seems that at all epochs the possible relationship between the FWHM of the [Fe iii] λ4701 feature and Δm15(B) is being driven almost completely by the most underluminous SNe Ia, perhaps indicating the existence of two groups of points rather than a linear correlation.
Regarding the velocity of the [Fe iii] λ4701 feature, Stritzinger et al. (2006) found no significant temporal change in their measurements, and Maeda et al. (2010a) state that the feature shows ‘virtually no Doppler shift’. However, later work from the latter group show blueshifts of 2000–4500 km s−1 for t < 200 d, with the velocity steadily approaching 0 for t > 200 d (Maeda et al. 2010b, 2011). This more recent result is also seen in the BSNIP data. In Fig. 4, all measured velocities of [Fe iii] λ4701 are plotted, with solid lines connecting multiple velocities of individual objects. Squares represent spectra for which we measured a nebular velocity, while crosses represent spectra for which we did not.
![All velocities of [Fe iii] λ4701 measured in this work. The solid lines connect multiple velocities of individual objects. The squares represent spectra for which we measured a nebular velocity; crosses represent spectra for which we did not.](https://oup.silverchair-cdn.com/oup/backfile/Content_public/Journal/mnras/430/2/10.1093_mnras_sts674/2/m_sts674fig4.jpeg?Expires=1716409552&Signature=t65oIalgcTHtgliDG6-bPaDKk5Y2vE~l64IJVZwRZ2mbf5z6DABiFhhuM4p1pWe2LcqkJS0emZLUt6kHcpIhUVJ1Oq~Y3P8Io5eyfT8IJVFFDgkWzfXMCZBmbf9L6~n9fffBTGHbudCi9ugLumvRyxgX9eupb30MEP6n7hYd3JdGZev5TPQaf122HshsB5FtFLqsCMkoct8AFphWKhhR0UYk-9S~kAUTxW9Rg553fNW8r7i08u37Vhu1machG5tGo7HMXqwGtwFM2f7wsi7YWpyC~zY4~Ge6NvmvylYhwF-EarMMTDo-~egYjRuhLLuUU12oo2EgJhRufkTvZUYxHg__&Key-Pair-Id=APKAIE5G5CRDK6RD3PGA)
All velocities of [Fe iii] λ4701 measured in this work. The solid lines connect multiple velocities of individual objects. The squares represent spectra for which we measured a nebular velocity; crosses represent spectra for which we did not.
The overall trend (which matches what was found by Maeda et al. 2010b) is clear: velocities are blueshifted typically by ∼2000–4000 km s−1 at t = 100 d and the amount of blueshift decreases approximately linearly with time. This temporal evolution is quite slow, however, with a typical change in velocity of only ∼10–20 km s−1 d−1. The velocity of the [Fe iii] λ4701 feature is uncorrelated with the nebular velocity and hence with the individual velocity of either [Fe ii] λ7155 or [Ni ii] λ7378. Furthermore, the [Fe iii] λ4701 velocity is also uncorrelated with the Si ii λ6355 velocity and |$\dot{v}$|.
4.2 [Fe ii] λ7155 and [Ni ii] λ7378
The individual velocities of the [Fe ii] λ7155 and [Ni ii] λ7378 features show a relatively large scatter at all epochs, which is reflected in the large range of calculated nebular velocities. The temporal velocity evolution of both features is even slower than that of the [Fe iii] λ4701 feature, with typical changes of a few km s−1 d−1.
Since the average of the velocities of [Fe ii] λ7155 and [Ni ii] λ7378 is used to calculate vneb, it is instructive to compare these two velocities with each other. The difference in these velocities has a relatively large scatter at all epochs, but we find no bias above or below zero velocity. The average absolute difference between the two velocities, however, is ∼900 km s−1, which is reflected in our vneb uncertainties discussed above. Despite this, the two velocities are highly correlated (Pearson coefficient of 0.84) and the difference between the two has a typical temporal evolution of <10 km s−1 d−1.
4.3 Nebular velocities
4.3.1 Spectral comparisons
Like the [Fe ii] λ7155 and [Ni ii] λ7378 velocities from which it is calculated, the nebular velocity does not change much with time (typical values being only a few km s−1 d−1, similar to what has been seen previously; e.g. Maeda et al. 2011). Furthermore, all four SNe Ia which have measured [Fe ii] λ7155 and [Ni ii] λ7378 velocities in multiple late-time spectra show no significant change in their nebular velocities with time (for 130 < t < 360 d). Thus, a single measurement of vneb appears to be sufficient to determine the typical nebular velocity of a given SN Ia.
Measurements of the velocity gradient were made for all objects with multiple near-maximum-brightness spectra in BSNIP, in Matheson et al. (2008) or in Blondin et al. (2012) (i.e. all SNe Ia listed in Table 2 except SNe 1993Z and 2003gs). The |$\dot{v}$| values calculated in this work are consistent at the 2σ level with those found in previous studies (Benetti et al. 2005; Maeda et al. 2010a). We also plot previously published |$\dot{v}$| and vneb values for 12 SNe Ia from Maeda et al. (2011) and Blondin et al. (2012).
Of the 25 objects with measured velocity gradients, 11 are LVG, 12 are HVG and 2 are FAINT, which is similar to the distribution of types found by Maeda et al. (2010a), though they have a slightly larger fraction of LVG objects. Fig. 5 presents these velocity-gradient measurements versus the nebular velocity; shapes and colours of the data points represent the Benetti and Wang types, respectively, as in Fig. 3. The vertical dashed line at 0 km s−1 is the demarcation between blueshifted (left) and redshifted (right) nebular velocities; the horizontal dashed line at 70 km s−1 d−1 is the demarcation between LVG (below) and HVG (above) objects.
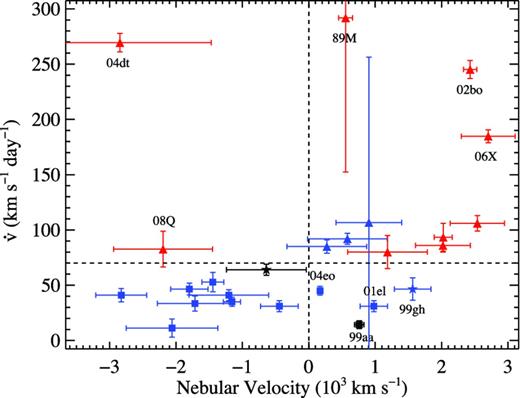
Nebular velocity versus velocity gradient. Shapes and colours of the data points are the same as in Fig. 3. The vertical dashed line at 0 km s−1 separates blueshifted (left) and redshifted (right) nebular velocities. The horizontal dashed line at 70 km s−1d−1 separates LVG (below) and HVG (above) objects.
Maeda et al. (2010a) found a correlation between vneb and |$\dot{v}$|, and the BSNIP data support this conclusion, with some caveats. The Pearson coefficient for all of the data in Fig. 5 is only 0.25 and the Spearman rank correlation coefficient is 0.39.2 However, SN 2004dt was found to be somewhat peculiar (showing evidence for high-velocity and clumpy ejecta at early times; e.g. Altavilla et al. 2007) and did not follow the relationship of Maeda et al. (2010a). Also, there are only two BSNIP spectra of SN 1989M and they were obtained just 1 d apart, thus the lever arm for the |$\dot{v}$| calculation is small and the accuracy of the measurement is small (hence the large error bars for that data point).
Removing SN 2004dt (SNe 2004dt and 1989M) yields a Pearson correlation coefficient of 0.51 (0.62) and a Spearman rank correlation coefficient of 0.56 (0.59). This indicates that the nebular velocity is correlated with the velocity gradient, with the significance of the correlation at the 2σ (3σ) level. If we ignore SN 2004dt, all HVG objects have redshifted nebular lines, except SN 2008Q which is extremely close to the LVG/HVG border. We also find that nearly 3/4 of all LVG objects have blueshifted nebular spectral features. A Kolmogorov–Smirnov (KS) test on the nebular velocities of LVG and HVG objects implies that they very likely come from different parent populations (p ≈ 0.016). When removing SN 2004dt, the difference is even stronger (p ≈ 0.007).
The near-maximum-brightness Si ii λ6355 velocity can also be compared to the nebular velocity for 14 of the SNe Ia in Table 2, as well as 15 SNe Ia from Maeda et al. (2011) and Blondin et al. (2012). We measure the Si ii λ6355 velocity only in BSNIP spectra within 8 d of maximum brightness.3 When multiple BSNIP spectra within 8 d of maximum exist for a given object, only the one closest to maximum brightness is used for the Si ii λ6355 velocity measurement. The near-maximum-light velocities are plotted against the nebular velocities in Fig. 6 with shapes and colours of data points the same as in Fig. 3; the vertical dashed line separates blueshifted (left) and redshifted (right) nebular velocities.
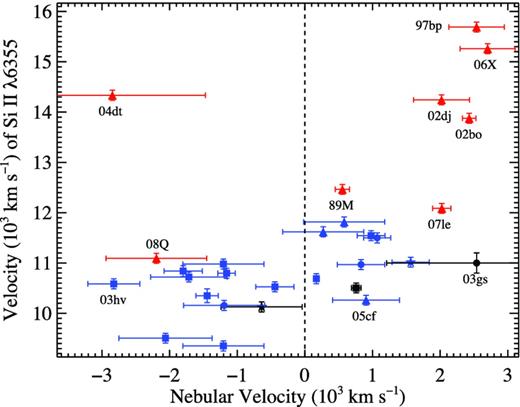
Nebular velocity versus Si ii λ6355 velocity. The shapes and colours of the data points are the same as in Fig. 3. Some of the outlying points are labelled. The vertical dashed line at 0 km s−1 separates blueshifted (left) and redshifted (right) nebular velocities.
A moderate correlation exists for all of the data presented in Fig. 6 (Pearson and Spearman coefficients are both 0.51). If SN 2004dt is again ignored, a strong correlation exists (Pearson coefficient of 0.70 and Spearman coefficient of 0.64). Most HV objects have redshifted emission lines at late time, but normal-velocity objects have both blueshifted and redshifted nebular features. A KS test of the nebular velocities indicates, however, that the HV and normal-velocity objects do come from different parent populations (p ≈ 0.021 for all of the data and p ≈ 0.009 when ignoring SN 2004dt).
The overall trend and even the location of each object in the parameter space (given the measurement uncertainties) is quite similar to Fig. 5. This is generally unsurprising given the results above involving the velocity gradient, since most (but not all) HV (normal-velocity) objects are also HVG (LVG) objects (table 2 of Wang et al. 2006; Silverman et al. 2012a). Furthermore, the Si ii λ6355 velocity at t = 0 d (i.e. v0) can be approximated from the velocity gradient and, as expected, these velocities at maximum brightness correlate in almost exactly the same manner as what is seen in Fig. 6.
To investigate whether late-time observations of SNe Ia are related to the amount of circumstellar interaction an SN Ia undergoes, Förster et al. (2012) measured the EW of narrow absorption from Na i D and Ca ii H&K in the host galaxies of SNe Ia and compared them to nebular velocities. Using 212 BSNIP spectra of the 15 objects listed in Table 2, we attempt to measure the EW of host-galaxy Na i D and Ca ii H&K absorption. Even in the relatively low-resolution spectra of the BSNIP sample, we are able to measure Na i D absorption in all 15 SNe Ia and Ca ii H&K absorption in 11 of them. The final EWs listed in the last two columns of Table 2 are the median of all EW measurements for each object (and the uncertainty is the standard deviation).
There are six objects in the current work that were also studied by Förster et al. (2012), and the EW measurements for all of these SNe Ia are consistent at the 2σ level. In contrast to previous work (Förster et al. 2012), the BSNIP data do not show a significant correlation between the EWs of Na i D and Ca ii H&K absorption. Förster et al. (2012) also found, at quite high significance, that objects with redshifted nebular velocities have larger EWs of Na i D and Ca ii H&K absorption. They interpret this result as indicating that these objects have stronger circumstellar interaction or larger amounts of circumstellar material, and thus they claim that nebular velocities are directly related to SN Ia environments.
The objects with redshifted vneb in BSNIP tend to have stronger absorption from Na i D and Ca ii H&K, but this is not always the case, and the difference between objects with blueshifted and redshifted nebular velocities is not significant. Therefore, we are unable to confirm the findings of Förster et al. (2012) that the environments of SNe Ia directly affect nebular velocities (or vice versa).
4.3.2 Photometric comparisons
As mentioned above, the photometric parameters used in this work can be found in Ganeshalingam et al. (2010). Of the 15 objects listed in Table 2, 14 have near-maximum-brightness light curves which allow for the measurement of Δm15(B). We also analyse 17 additional objects from Maeda et al. (2011) and Blondin et al. (2012). Most of them have 0.9 < Δm15(B) < 1.4 mag, which represents the range of ‘normal’ SNe Ia (e.g. Ganeshalingam et al. 2010). This range is denoted by the horizontal dashed lines in Fig. 7, where we plot vneb against Δm15(B) and have labelled the six objects that fall outside the normal range of Δm15(B) values.
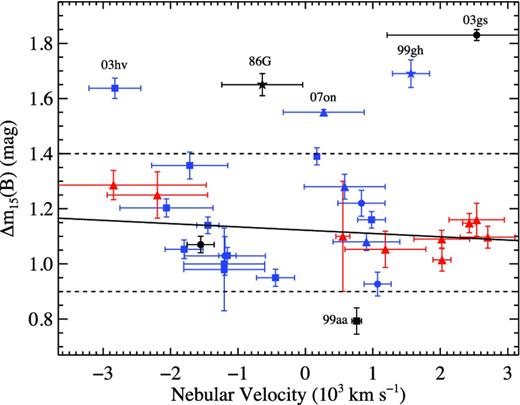
Nebular velocity versus Δm15(B). The shapes and colours of the data points are the same as in Fig. 3. The six objects with Δm15(B) values which fall outside the ‘normal’ range (0.9 < Δm15(B) < 1.4 mag, denoted by the horizontal dashed lines) are labelled. The solid line represents the linear fit to the data when ignoring these seven outliers.
When including all objects presented in the figure, the data are completely uncorrelated (Pearson correlation coefficient of −0.009), similar to what has been seen previously (Blondin et al. 2012). Even when the six outliers (SNe 1986G, 1999aa, 1999gh, 2003gs, 2003hv and 2007on) are ignored, there is still no significant evidence of a correlation between vneb and Δm15(B) (Pearson correlation coefficient of −0.16). The solid line in Fig. 7 represents the linear fit to the data when ignoring these six outliers. Furthermore, the slope of this linear fit is consistent with zero, and it is clear that for a given Δm15(B) there is a huge range of possible vneb values. This result, which matches that of previous studies (Maeda et al. 2010a; Blondin et al. 2012), is illustrated in Fig. 8, where the [Fe ii] λ7155 and [Ni ii] λ7378 features are plotted for three normal-luminosity objects all with Δm15(B) ≈ 1.1 mag. The solid vertical lines represent the nebular velocity for both features of each object while the dotted vertical lines denote the rest wavelengths of the two features. Despite their nearly identical light curves, these three objects show significantly different nebular velocities with a range spanning ∼4500 km s−1.
![The deredshifted [Fe ii] λ7155 and [Ni ii] λ7378 features of SNe 2006X, 1989M, and 1998bu, all of which have Δm15(B) ≈ 1.1 mag. The solid vertical lines represent the nebular velocity for both features of each object, while the dotted vertical lines represents the rest wavelengths of the two features.](https://oup.silverchair-cdn.com/oup/backfile/Content_public/Journal/mnras/430/2/10.1093_mnras_sts674/2/m_sts674fig8.jpeg?Expires=1716409552&Signature=DIJ0xQ1g-xt-2fpXNyguCL3dtz4lmyhlUF13dkBejlDd4biuV7ILrSFYNpAW9z0cfCEbBvCfrswqWLlxtSleJ1qwD3-OUu2eb0gPo4esAPtLVFFCJn7UZV9Vv97c9E4G2I30nd4ooJFLiM6zYcz0WljEm6DW3uLdz1S1YGiDQdiSHEod5vL6x3OwO~-Bcei-R7nwK2M2k7e8RmfE-1eagBjQXg3IJeEznxSyvNj6ETBgM8FyWV1dNgTmOpI~PnbJK6XVFMli9pdsvP5lGD24fqCazQARx2iqOHDNUW2NJl~bG7hrH~mPsygDZCheasuWL1AEjL-rd53clwb2tGaPgA__&Key-Pair-Id=APKAIE5G5CRDK6RD3PGA)
The deredshifted [Fe ii] λ7155 and [Ni ii] λ7378 features of SNe 2006X, 1989M, and 1998bu, all of which have Δm15(B) ≈ 1.1 mag. The solid vertical lines represent the nebular velocity for both features of each object, while the dotted vertical lines represents the rest wavelengths of the two features.
In Silverman et al. (2012b), (B − V)max was defined as the observed B − V colour of the SN at B-band maximum brightness. In Fig. 9, we plot vneb versus (B − V)max using this definition for the BSNIP data4 as well as 14 additional SNe Ia from Maeda et al. (2011) and Blondin et al. (2012). In this parameter space, there appears to be three outliers (labelled in Fig. 9). Two of these, SNe 1998bu and 2006X, are known to have substantial extinction from their host galaxies (e.g. Matheson et al. 2008; Wang et al. 2008). On the other hand, the third outlier (SN 2003gs) shows no evidence for significant host-galaxy extinction (Krisciunas et al. 2009).
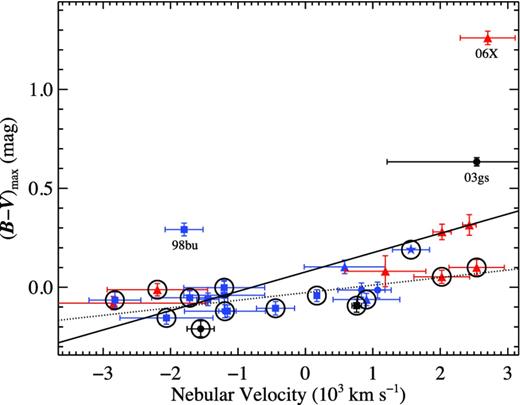
Nebular velocity versus observed (B − V)max. The shapes and colours of the data points are the same as in Fig. 3. Two of the labelled outliers (SNe 1998bu and 2006X) have significant reddening from their host galaxies, while the third labelled outlier (SN 2003gs) shows little host-galaxy reddening. The solid line represents the linear fit to all of the data. The circled points indicate objects in the low-extinction sample and the dotted line indicate the linear fit to this subset.
Utilizing all data in Fig. 9, vneb is found to be correlated (at the >3σ level) with (B − V)max (Pearson coefficient of 0.59), and the linear fit to these data is shown in the figure as the solid line. Blondin et al. (2012) found no correlation between vneb and intrinsicB − V colour at B-band maximum for their full sample or when removing the peculiar SN 2004dt. However, they see a correlation similar to ours (with Pearson correlation coefficient of 0.82) for objects with vneb > −2000 km s−1; note that most of the objects presented herein also have vneb > −2000 km s−1.
Since (B − V)max is an observed SN colour (and thus a mixture of intrinsic SN colour and reddening from the host galaxy), we also investigate possible correlations between vneb and (B − V)max for various low-extinction subsets of our sample. Simply removing SN 2006X or both SNe 2006X and 1998bu from the analysis (since they are known to have large host-galaxy extinction) increases the Pearson coefficient to 0.60 and 0.77, respectively (and both correlations are significant at the ∼3σ level). Concentrating only on objects with (B − V)max < 0.2 mag, we find a similarly strong correlation (Pearson coefficient of 0.64) again at the >3σ level.
On the other hand, a low-extinction sample was defined by Blondin et al. (2012), and no correlation between vneb and intrinsic (B − V)max was detected. In this work, we use similar criteria as Blondin et al. (2012) to define our low-extinction sample. An SN Ia is considered part of this sample if it resides in an E/S0 host galaxy, is found far (in projected distance) from a host galaxy of any type or has a low value of AV according to MLCS2k2 (Jha, Riess & Kirshner 2007). Objects in the low-extinction sample are marked with a ‘dagger’ in Table 2 and are circled in Fig. 9. In contrast to Blondin et al. (2012), we find a correlation between vneb and observed (B − V)max for the low-extinction sample (Pearson correlation coefficient of 0.63) at the ∼2.5σ level, and the linear fit to this subset of SNe Ia is plotted in Fig. 9 as a dotted line.
5 CONCLUSIONS
In this work, we have analysed late-time (t > 100 d) optical spectra of low-redshift (z < 0.1) SNe Ia which mostly come from the BSNIP data set (Silverman et al. 2012a). The lone exception is SN 2011by, and we present and analyse nine spectra of this object (two of which are at late times). After removing objects that do not follow the Phillips relation (Phillips 1993) and spectra that do not cover either of the wavelength ranges of interest (namely the [Fe iii] λ4701, [Fe ii] λ7155 and [Ni ii] λ7378 features), we are left with 34 SNe Ia with 60 spectra having t > 100 d. Of these, seven were studied by Maeda et al. (2010a), and those seven plus two more were studied by Blondin et al. (2012). We add to the BSNIP data nebular spectral feature measurements of 20 SNe Ia from previously published work (Maeda et al. 2011; Blondin et al. 2012). This sample represents the largest set of late-time SN Ia spectra ever analysed.
We attempted to measure the FWHM and velocity of the three nebular emission features mentioned above and are able to measure the [Fe iii] λ4701 line in all late-time data discussed in this work. On the other hand, we are only able to calculate velocities of the [Fe ii] λ7155 and [Ni ii] λ7378 features in 22 spectra of 15 SNe Ia. To successfully measure these features, it seems that the SN Ia should be spectroscopically normal, the spectrum should have S/N ≳ 20 pixel−1 and the spectrum should be older than ∼160 d past maximum brightness. Following Maeda et al. (2010a), we calculate vneb from the mean of the individual velocities of the [Fe ii] λ7155 and [Ni ii] λ7378 features.
The FWHM of [Fe iii] λ4701 is anticorrelated with Δm15(B). However, if the six objects with Δm15(B) > 1.6 mag are removed, the correlation effectively disappears. The same results are found when using only spectra from 250 to 300 d past maximum brightness. Thus, this possible relationship seems to be driven solely by the most underluminous SNe Ia. This feature is blueshifted by ∼2000–4000 km s−1 at t = 100 d, and the amount of blueshift decreases approximately linearly with time. However, this temporal evolution is quite slow, with a typical change in velocity of only ∼10–20 km s−1 d−1.
The nebular velocity likewise does not change much with time (typical values are a few km s−1 d−1). Furthermore, the BSNIP data weakly support the finding of Maeda et al. (2010a) that vneb and |$\dot{v}$| are correlated. Nearly all HVG objects have redshifted nebular lines and most LVG objects have blueshifted nebular spectral features. A similar result is found when using the near-maximum-brightness velocity instead of the velocity gradient and assuming HV (normal-velocity) objects are also HVG (LVG) objects (which is a reasonable assumption, e.g. Silverman et al. 2012a). The data studied in this work also show no significant correlation between the EWs of Na i D or Ca ii H&K absorption and vneb; thus, we are unable to confirm previous claims that the environments of SNe Ia directly affect nebular velocities, or vice versa (Förster et al. 2012). No significant correlation is found between vneb and Δm15(B), and SNe Ia with nearly identical light curves can have a wide range of nebular velocities, spanning ∼4500 km s−1 in Fig. 8. Our data also indicate a correlation between observed (B − V)max and vneb.
Although the combined data set analysed in this work constitutes the largest late-time SN Ia spectral data set ever studied, it still contains only a handful of objects. The analysis herein could certainly be improved and extended by obtaining more nebular SN Ia spectra. While BSNIP (and the CfA, Blondin et al. 2012) has gathered, published and analysed their SN Ia spectral data, larger transient searches such as the Palomar Transient Factory (Law et al. 2009; Rau et al. 2009) and Pan-STARRS (Kaiser et al. 2002) will be able to add significantly to the number of late-time SN Ia spectra.
We would like to thank G. Canalizo, S. B. Cenko, K. Clubb, M. Cooper, A. Diamond-Stanic, E. Gates, K. Hiner, M. Kandrashoff, M. Lazarova, A. Miller, P. Nugent and the overall LAMP collaboration (Barth et al. 2011) for their help with the observations of SN 2011by. R. J. Foley and S. W. Jha discussed earlier drafts of this work with us, and the anonymous referee provided comments and suggestions that improved the manuscript. We are grateful to the staff at the Lick and Keck Observatories for their support. Some of the data utilized herein were obtained at the W. M. Keck Observatory, which is operated as a scientific partnership among the California Institute of Technology, the University of California and NASA; the observatory was made possible by the generous financial support of the W. M. Keck Foundation. We wish to recognize and acknowledge the very significant cultural role and reverence that the summit of Mauna Kea has always had within the indigenous Hawaiian community; we are most fortunate to have the opportunity to conduct observations from this mountain. This work is supported by NSF grants AST-0908886 and AST-1211916, DOE grants DE-FC02-06ER41453 (SciDAC) and DE-FG02-08ER41563, the TABASGO Foundation and the Christopher R. Redlich Fund. JMS is grateful to Marc J. Staley for a Graduate Fellowship. KAIT and its ongoing operation were made possible by donations from Sun Microsystems, Inc., the Hewlett-Packard Company, AutoScope Corporation, Lick Observatory, the NSF, the University of California, the Sylvia & Jim Katzman Foundation and the TABASGO Foundation. We dedicate this paper to Wallace L. W. Sargent (deceased 2012 October 29); the discovery of SN 1985F by Filippenko & Sargent (1985) sparked AVF's intense interest in supernovae and dramatically affected his career.
All of the BSNIP data, along with the SN 2011by data, will be made public on 2013 January 1 via the SuperNova DataBase (SNDB; Silverman et al. 2012a).
This is perhaps the more appropriate value to examine here since the relationship appears to be non-linear.
Spectra within 5 d of maximum brightness were used by Silverman et al. (2012a), but applying this constraint would remove three objects from the study of Si ii λ6355 velocity versus nebular velocity.
SNe 1989M and 1993Z do not have colour information available.
REFERENCES
APPENDIX A: OBSERVATIONS OF SN 2011by
SN 2011by was discovered by Jin & Gao (2011) on 2011 April 26.8 ut in NGC 3972 with J2000.0 coordinates α = 11h 55m|$45{.\!\!^{ {\mathrm {s}}}}56$|, δ = +55° 19′ 33| ${.\!\!\!\!\!\!^{\prime\prime}}$|8, and it was classified ∼1 d after discovery as a young SN Ia by Zhang, Zhou & Wang (2011). Immler & Russell (2011) detected X-ray emission coincident with SN 2011by ∼40 d after discovery using Swift/XRT, but the emission was found to be unassociated with the SN using Chandra observations taken ∼3 weeks later (Pooley 2011).
Broad-band BVRI photometry of SN 2011by was obtained using the 0.76 m Katzman Automatic Imaging Telescope (KAIT) at Lick Observatory (Li et al. 2000; Filippenko et al. 2001) and is shown in Fig. A1. The data were reduced using standard procedures, the details of which can be found in (Ganeshalingam et al. 2010). The optical light curves of SN 2011by indicate that it reached B-band maximum brightness on 2011 May 9.9 ut and that it had Δm15(B) = 1.14 ± 0.03 mag.
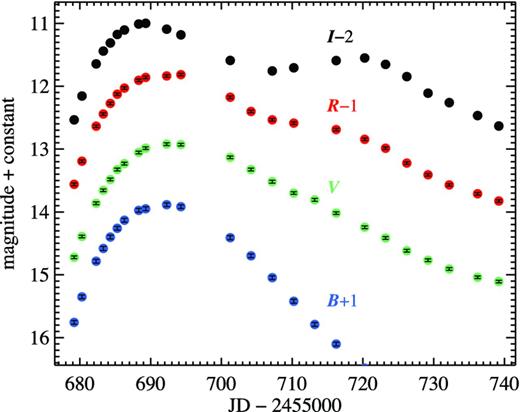
BVRI light curves of SN 2011by from KAIT.
We obtained six near-maximum-brightness spectra of SN 2011by using the Lick/Kast double spectrograph. They span ∼12 d before to ∼15 d after maximum brightness, as shown in the top panel of Fig. A2. In addition, we used Keck/LRIS to acquire two late-time spectra at 206 and 310 d past maximum (shown in the bottom panel of Fig. A2), the spectral feature measurements of which can be found at the end of Table 1. Details of all of our spectral observations of SN 2011by can be found in Table A1.
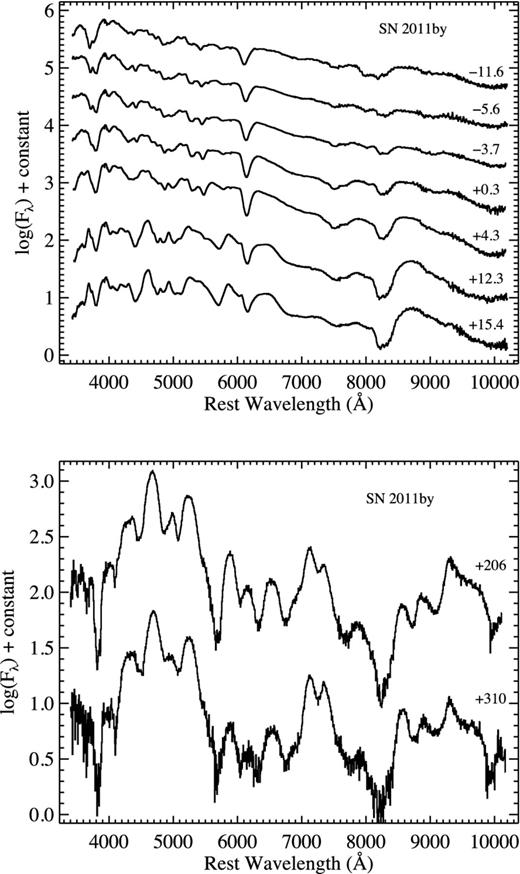
Near-maximum-brightness (top) and late-time (bottom) spectra of SN 2011by, labelled with age relative to the time of maximum brightness. The data have had their host-galaxy recession velocity removed and have been corrected for Galactic reddening.
Journal of spectroscopic observations of SN 2011by.
| ut date | Agea | Range (Å) | Airmassb | Exp (s) |
|---|---|---|---|---|
| 2011 April 28.2 | −11.6 | 3440–10 200 | 1.05 | 600 |
| 2011 May 4.2 | −5.6 | 3440–10 200 | 1.06 | 600 |
| 2011 May 6.2 | −3.7 | 3440–10 200 | 1.05 | 600 |
| 2011 May 10.2 | 0.3 | 3438–10 196 | 1.06 | 600 |
| 2011 May 14.2 | 4.3 | 3456–10 200 | 1.07 | 600 |
| 2011 May 22.3 | 12.3 | 3464–10 200 | 1.15 | 600 |
| 2011 May 25.3 | 15.4 | 3436–10 200 | 1.27 | 600 |
| 2011 December 2.6c | 206 | 3400–10 138 | 1.50 | 450 |
| 2012 March 15.5c | 310 | 3400–10 200 | 1.32 | 900 |
aRest-frame days relative to the date of B-band maximum brightness, 2011 May 9.9 (see Section 2.1).
bAirmass at midpoint of exposure.
Consistent with the light curves, the spectra indicate that this object is quite normal; the SuperNova IDentification code (Blondin & Tonry 2007), as implemented by Silverman et al. (2012a), was run on all of our spectra of SN 2011by and it is definitively classified as spectroscopically normal. As in Silverman et al. (2012a), we calculated the near-maximum-brightness velocity based on the minimum of the Si ii λ6355 absorption feature and find that it shows a ‘normal’ velocity near maximum brightness, as opposed to some SNe Ia which exhibit higher-than-average expansion velocities (e.g. Wang et al. 2009). Furthermore, since we have multiple spectra near maximum brightness, we can calculate the velocity gradient (e.g. Benetti et al. 2005); SN 2011by falls squarely in the LVG group.
Individual objects (some found by amateur astronomers and some by large-scale surveys) discovered in nearby galaxies soon after explosion will be invaluable resources for extending our understanding of SNe Ia. SN 2011by represents an exquisite case study for the current work. In recent years, there have been a handful of other nearby SNe Ia found soon after explosion (e.g. Nugent et al. 2011; Foley et al. 2012; Silverman et al. 2012b) that will also serve as excellent individual case studies once late-time spectra have been obtained and analysed.
