


Abstract
The observed Galactic rate of stellar mergers or the initiation of common envelope phases brighter than MV = −3 (MI = −4) is of the order of ∼0.5 (0.3) yr−1 with 90 per cent confidence statistical uncertainties of 0.24–1.1 (0.14–0.65) and factor of ∼2 systematic uncertainties. The (peak) luminosity function is roughly |$\text{d}N/\text{d} L \propto L^{-1.4\pm 0.3}$|, so the rates for events more luminous than V1309 Sco (MV ≃ −7 mag) or V838 Mon (MV ≃ −10 mag) are lower at r ∼ 0.1 and ∼0.03/year, respectively. The peak luminosity is a steep function of progenitor mass, L ∝ M2 − 3. This very roughly parallels the scaling of luminosity with mass on the main sequence, but the transients are ∼2000–4000 times more luminous at peak. Combining these, the mass function of the progenitors, dN/dM ∝ M−2.0 ± 0.8, is consistent with the initial mass function, albeit with broad uncertainties. These observational results are also broadly consistent with the estimates of binary population synthesis models. While extragalactic variability surveys can better define the rates and properties of the high-luminosity events, systematic, moderate depth (I ≳ 16 mag) surveys of the Galactic plane are needed to characterize the low-luminosity events. The existing Galactic samples are only ∼20 per cent complete, and Galactic surveys are (at best!) reaching a typical magnitude limit of ≲ 13 mag.
1 INTRODUCTION
In 2002 January, the transient V838 Mon was discovered (Brown et al. 2002) and then produced a series of dust echoes in the surrounding interstellar medium (ISM) that are some of the most iconic images produced by the Hubble Space Telescope (HST; Bond et al. 2003). In 2008 September, the transient V1309 Sco was discovered (Nakano et al. 2008), with spectacular evidence from OGLE light curves that the source was a binary merger (Tylenda et al. 2011). V4332 Sgr in 1994 February and OGLE 2002-BLG-360 in 2002 October appear to be similar events (Martini et al. 1999; Tylenda et al. 2013). CK Vul (Nova Vul 1670) has been proposed as a historical example (Kato 2003) and the 1943 nova V1148 Sgr may be another (Mayall 1949). The M31 RV (‘Red Variable’) and M85 OT2006-1 are possible extragalactic examples (Rich et al. 1989; Kulkarni et al. 2007, but see Pastorello et al. 2007; Thompson et al. 2009 for alternative interpretations of the M85 transient). Other lower luminosity extragalactic transients, such as SN 2008S and the 2008 transient in NGC 300, almost certainly belong to a different class of objects (see Prieto et al. 2008; Thompson et al. 2009; Kochanek 2011).
While there has been some argument for interpreting these events as an odd form of nova (e.g. Shara et al. 2010), the generally accepted interpretation is that they are stellar mergers or the dynamical phase of common envelope (CE) evolution as originally proposed by Soker & Tylenda (2003). The arguments in favour of gravitationally driven mergers over thermonuclear novae are laid out by Tylenda & Soker (2006), but this issue became moot with the direct observations of V1309 Sco as a merging binary (Tylenda et al. 2011). Stellar mergers are relatively gentle processes (e.g. Passy et al. 2012; Ricker & Taam 2012; Nandez, Ivanova & Lombardi 2014), producing only limited mass-loss and leaving a remnant with a vastly inflated envelope appearing as an M (or even L) type supergiant combined with dust formation (as first noted by Rich et al. (1989) for the M31 RV and Martini et al. (1999) for V4332 Sgr). In particular, the survival of the circumstellar dust surrounding OGLE 2002-BLG-360 (Tylenda et al. 2013) means that no fast, radiative shock was associated with the transient. For the SN 2008S class of transients (Thompson et al. 2009), almost all the circumstellar dust must be destroyed in the transient which requires an unobserved luminosity spike (∼1010 L⊙!) that can only be explained by a fast shock breaking out from the surface of the star (see Kochanek 2011).
Stellar mergers are not curiosities, but a powerful probe of binary evolution. Most stars are in binaries, and a non-trivial fraction are in triples or higher order systems (see e.g. the review by Duchene & Kraus 2013). As binary stars evolve, they frequently interact (e.g. recently, Sana et al. 2012 and de Mink et al. 2014 for massive stars) or are driven to interact by a tertiary (e.g. Fabrycky & Tremaine 2007; Thompson 2011; Shappee & Thompson 2013) leading to a CE phase and potentially a full merger. To somewhat simplify our language we will refer to both of these as mergers, although the ‘cores’ of the stars need not ultimately merge. These interactions are not only theoretically expected, but are also required to explain many classes of compact binaries or peculiar stars such as blue stragglers (e.g. Perets & Fabrycky (2009), Bailyn (1995) for globular clusters) and R Cor Bor stars (e.g. Webbink 1984). Recent studies of massive stars suggest that ∼10 per cent of massive stars are probably merger products (Sana et al. 2012; de Mink et al. 2014). Directly determining the rates of such events would be a powerful new constraint on models.
Despite the importance of making such measurements, there has been little discussion of the merger rates implied by the existing events. Soker & Tylenda (2006) argue from analogy to estimates of blue straggler formation that the Galactic rate should be once every 10–50 years. Ofek et al. (2008) mention in passing an estimated empirical lower limit of 0.019 year−1, which was used for an estimated discovery rate by the Palomar Transient Factory (PTF; Rau et al. 2009; Law et al. 2010). However, if the four Galactic events have a common origin, these estimates are low – with four events in 25 years, the rate of Galactic stellar mergers is >0.1 yr−1 even before making any corrections for completeness.
While there will be systematic uncertainties, in Section 2 we estimate the rates and luminosity function of these events based on the statistics of the Galactic events and then estimate the statistics for external galaxies. In Section 3, we examine the scaling of the event luminosities with estimates of the progenitor masses. In Section 4, we compare these observational results to estimates based on a binary population synthesis model. In Section 5, we discuss the implications of these results, the need for better variability surveys of the Galaxy, and the detectability of these events in other nearby galaxies.
2 THE RATE AND LUMINOSITY FUNCTION
Empirically, there have been four merger events in our galaxy over the last Δt = 25 yr, so the 90 per cent confidence limit on the rate r is 2.0 ≲ rCΔt ≲ 9.2, where C ≤ 1 is the completeness. This corresponds to having events every r−1 = 2.7 to 12.6(25/Δt)C−1 yr. While there will be many systematic uncertainties, we can estimate the completeness and the luminosity function of these transients.
To estimate the completeness we need f(M), the probability that a Galactic transient peaking at absolute magnitude M will be discovered given the effects of distance and extinction (but not sky coverage). In Adams et al. (2013), we made such estimates for the visibility of Galactic supernovae, and we simply adopt their models. Core-collapse supernovae (ccSNe) were assumed to be distributed following a standard Galactic thin disc model (TRILEGAL; Girardi et al. 2005) with a scaleheight of H = 95 pc, while thermonuclear Type Ia SN were half distributed in the thin disc (the ‘prompt component’) and half in the thick disc (the ‘delayed component’) with a scaleheight of H = 800 pc. The extinction along any site line was normalized to an empirical estimate of the extinction and then distributed to follow the thin disc density in that direction. Compared to other systematic problems, uncertainties in distances and the effects of inhomogeneities such as spiral arms are unimportant. We will refer to these two spatial distributions as the thin disc and the thick+thin disc distributions, where the practical difference is that the thick disc component suffers far less extinction than the thin disc component.
We only consider the ‘standard’ extinction model from Adams et al. (2013) using the Rayleigh–Jeans Color Excess (RJCE) extinction maps from Nidever, Zasowski & Majewski (2012) in the Galactic plane and reverting to a modified version (Bonifacio, Monai & Beers 2000) of the Schlegel, Finkbeiner & Davis (1998) maps where the RJCE estimates are unavailable. We considered several other extinction normalizations in Adams et al. (2013), but the differences are unimportant to our completeness corrections here because they only matter for high (E(B − V) > 1) extinctions. All the observed transients were very bright and only moderately extincted (see Table A1), so changes in the dust model normalizations have negligible effects on the rate estimate. In Adams et al. (2013), we found this was also true when estimating supernova rates based on the very bright historical supernovae seen in the Galaxy.
The observed transients all lie in or near the Galactic disc (see Table A1), so we view the thin disc model as more representative. We provide the thick+thin disc model primarily as a contrast. More realistically, the spatial distribution is mass dependent. The more massive progenitors (|$M \gtrsim 2\,\text{M}_{\odot }$|) must all be associated with the thin disc simply because they are young, while the lower mass systems will have scaleheights that increase with age, reaching a maximum comparable to the thick disc component. However, the differences even between the results for the two spatial distributions are not large given the other uncertainties, so a more complex model is presently unwarranted.
Figs 1 and 2 illustrate the resulting detection probabilities as a function of either apparent or absolute magnitude for the thin-disc spatial distribution. Fig. 1 shows that most of the candidates have similar peak apparent magnitudes, and that the fraction of events that will be this bright is a small fraction of all events with their absolute magnitudes. The exception is the one source found in a deep, modern survey, OGLE 2002-BLG-360. As the name indicates, however, the OGLE survey only covers a small region in the Galactic bulge. Note that we frequently abbreviate OGLE 2002-BLG-360 to OGLE-BLG-360 or just OGLE. Because this transient was found in a narrow, deep survey, we only compute the rates using the other three recent Galactic transients (V4332 Sgr, V838 Mon and V1309 Sco).
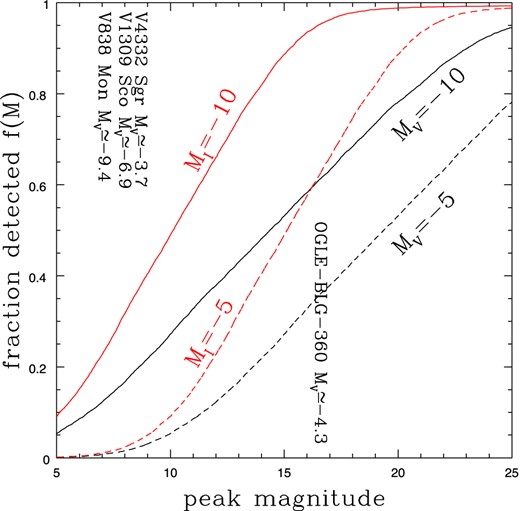
Detection probabilities f(M) for Galactic sources with absolute V (black) or I (red) magnitudes of −5 (lower, dashed) or −10 (upper, solid) as a function of apparent magnitude. The peak V-band magnitudes of the Galactic sources are marked. These estimates are for the thin disc spatial distribution.
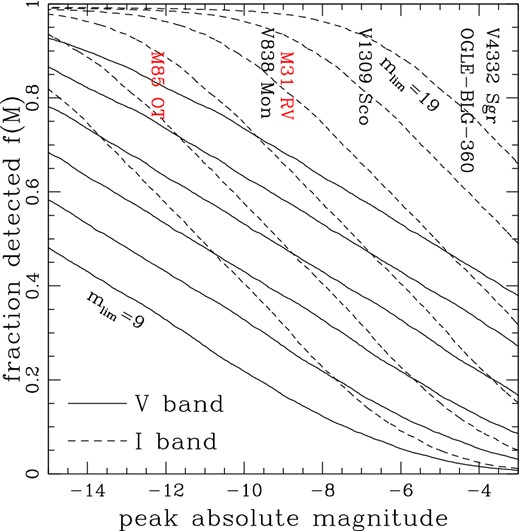
Detection probabilities f(M) for Galactic sources as a function of peak absolute V (solid) and I (dashed) magnitudes for limiting magnitudes of mlim = 9 (bottom), 11, 13, 15, 17 and 19 mag (top). The absolute V-band magnitudes of the sources at peak are marked, including the two extragalactic sources (red and lower). These estimates are for the thin disc spatial distribution.
Clearly the effective limiting magnitude of the searches for these sources is a key parameter in the completeness corrections. Fig. 2 illustrates this by showing the fraction of sources detected at a given absolute magnitude as a function of the limiting magnitude mlim. The completeness for events like V838 Mon, the most luminous Galactic event, is far higher than for events like V4332 Sgr. The absolute magnitude distribution of the observed events already shows evidence that fainter events are more common, which means that the actual luminosity function must be rising for fainter sources.
Observational Galactic rate estimates.
| Model | Band | mlim | Rate r | Completeness C | Slope x |
|---|---|---|---|---|---|
| (mag) | (yr−1) | dN/dL ∝ L−x | |||
| thin | V | 9 | 2.26 (0.67–7.00) | 0.04 (0.02–0.12) | 1.58 (1.13–2.10) |
| thin | V | 11 | 0.99 (0.36–2.40) | 0.11 (0.07–0.19) | 1.46 (1.15–1.79) |
| thin | V | 13 | 0.53 (0.22–1.10) | 0.21 (0.15–0.30) | 1.36 (1.10–1.66) |
| thin | I | 9 | 1.86 (0.47–6.50) | 0.05 (0.03–0.15) | 1.72 (1.28–2.20) |
| thin | I | 11 | 0.66 (0.27–1.40) | 0.17 (0.12–0.27) | 1.53 (1.25–1.86) |
| thin | I | 13 | 0.32 (0.14–0.63) | 0.35 (0.27–0.48) | 1.43 (1.16–1.74) |
| thick+thin | V | 9 | 0.44 (0.19–0.92) | 0.25 (0.18–0.38) | 1.39 (1.12–1.70) |
| thick+thin | V | 11 | 0.25 (0.11–0.52) | 0.44 (0.36–0.56) | 1.28 (1.01–1.58) |
| thick+thin | V | 13 | 0.18 (0.06–0.47) | 0.56 (0.48–0.69) | 1.26 (0.89–1.63) |
| thick+thin | I | 9 | 0.33 (0.14–0.66) | 0.34 (0.25–0.49) | 1.45 (1.17–1.78) |
| thick+thin | I | 11 | 0.17 (0.06–0.43) | 0.58 (0.49–0.76) | 1.35 (0.98–1.75) |
| thick+thin | I | 13 | 0.13 (0.04–0.40) | 0.73 (0.64–0.90) | 1.33 (0.86–1.84) |
Note: The thin disc spatial distribution has sources only in a thin disc with a scaleheight of H = 95 pc, while the thick+thin distribution puts half of the sources in a thick disc with a scaleheight of H = 800 pc (see Adams et al. 2013). The estimates assume an all-sky search in the V or I bands to a depth of mlim mag based on V4332 Sgr, V838 Mon and V1309 Sco but not OGLE-2002-BLG-360. The median rate r, completeness C and luminosity function slope x estimates are given along with their 90 per cent confidence ranges. The rates can be further rescaled as |$r \propto f_{\rm sky}^{-1} \Delta t^{-1}$| where we assumed that fraction fsky = 1 of the Galaxy is surveyed for a period of Δt = 25 yr.
We first fit the V-band luminosities, fixing the magnitude range to M0 = −3 and M1 = −14. The primary systematic uncertainty other than fsky is the limiting magnitude. As our standard model, we will use the thin disc spatial distribution and mlim = 13 mag to roughly match the pre-transient detection limits discussed in the appendix. This results in a model with x ≃ 1.4 ± 0.3, a median rate of r = 0.53 yr−1 (0.22 < r < 1.1) and a median completeness of C = 0.21 (0.15 < C < 0.30) where we report 90 per cent confidence limits. And, as noted earlier, the rate estimates can be rescaled as |$r \propto (25/\Delta t) f_{\rm sky}^{-1}$|.
If anything, however, Fig. 1 seems to suggest that mlim should actually be lower than 13 mag, which is plausible given that pre-transient detection limits will generally be an overestimate of the magnitude at which a transient will actually be identified. If we reduce the magnitude limit to mlim = 11 or 9 mag, the median rates increase to 0.99 yr−1 (0.36 < r < 2.4) or 2.3 yr−1 (0.67 < r < 7.0) and the median completenesses decrease to C = 0.11 (0.07 < C < 0.19) and C = 0.04 (0.02 < C < 0.12), respectively. The slope becomes somewhat shallower as we increase the magnitude limit, with x = 1.6 ± 0.5, 1.5 ± 0.3 and 1.4 ± 0.3 for mlim = 9, 11 and 13 mag. There is also a covariance between r and x for fixed mlim that steeper slopes allow higher total rates because more systems are intrinsically faint.
We obtain similar results if we use the I-band magnitudes after shifting the absolute magnitude range by the typical V − I colour to −4 < MI < −15. For limiting I-band magnitudes of mlim = 9, 11 and 13 mag, we find r = 1.9 (0.47 < r < 6.5), r = 0.66 (0.27 < r < 1.4), and r = 0.32 (0.14 < r < 0.63) yr−1, respectively. The slopes of x = 1.7 ± 0.5, 1.5 ± 0.3 and 1.4 ± 0.3 slowly become shallower with increasing mlim but are all consistent with a slope of x ≃ 3/2. The median completeness rises from C = 0.045 and 0.17–0.35, moderately higher than the V-band estimates.
Table 1 also provides the results using the thick+thin disc model of the source distribution. Since the little extincted thick disc population provides half of the event rate, the completenesses are now much higher, and the required rates are lower by factors of 2–3. As discussed earlier, we view the thin disc model as more representative of the observed distribution of sources and certainly of all the higher mass progenitors. Unfortunately, the likelihoods provide no useful discrimination between the models.
We adopt the thin disc model with mlim = 13 mag as our fiducial case largely because it lies roughly in the middle of the various estimates in Table 1. Thus, the rates for MV/MI < −3/−4 mag are 0.5/0.3 yr−1 with statistical uncertainties that are basically Poisson and systematic uncertainties of roughly a factor of 2. Events comparable to or brighter than V1309 Sco have a rate of r = 0.13 yr−1 (0.047 < r < 0.28 for MV = −7 mag) or r = 0.061 (0.020 < r < 0.15 for MI = −8 mag). Events comparable to or brighter than V838 Mon have a rate of r = 0.034 yr−1 (0.0082 < r < 0.12 for MV = −10 mag) or r = 0.016 (0.0028 < r < 0.057 for MI = −8 mag). Roughly speaking, a stellar merger occurs every few years, there is one as luminous as V1309 Sco once per decade and there is one as luminous as V838 Mon every 40 years. We would argue that if Δt is increased significantly from 25 years, than one should use a brighter magnitude limit mlim, rendering the results relatively insensitive to the choice of Δt. These integral rate estimates are shown in Fig. 3 and they can be converted to magnitude limited rates in the Galaxy using Fig. 2.
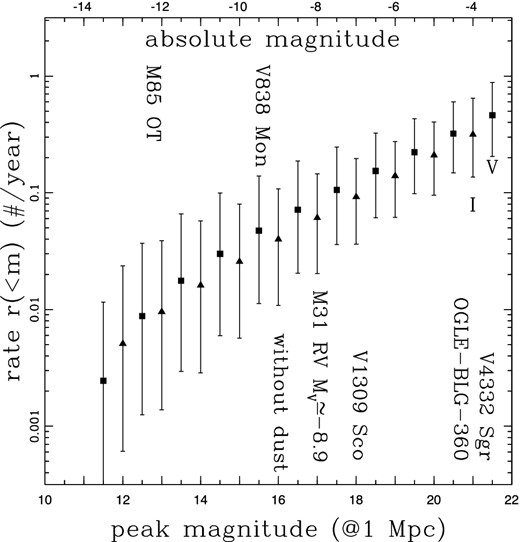
Integral event rates r(<m) as a function of peak absolute magnitude (upper scale) or at a distance of 1 Mpc (lower scale) roughly corresponding to M31 or M33. The V band (squares) and I band (triangle) rates are shown on a staggered grid averaged over the thin disc mlim = 13 mag MCMC models. The error bars symmetrically encompass 90 per cent of the trials and are strongly correlated. The apparent magnitudes of the M31 RV are shown with and without correcting for the estimated foreground extinction. The Galactic events and the M85 OT are shown at their estimated V-band absolute magnitudes.
Fig. 3 also shows the apparent magnitudes the transients would have at a distance of 1 Mpc, roughly matching the distances to M31 or M33. The V-band properties of the M31 RV and the M85 OT are shown for comparison. No extinction is included in these rate estimates. The apparent magnitudes must be shifted to include any applicable foreground extinction from either our Galaxy or any host galaxy. Assuming M31 is a twin of our Galaxy, the rate of events like the M31 RV is intermediate to events like V1309 Sco and V838 Mon, so roughly one every 20 years. In theory, these nearby galaxies should be ideal laboratories for better estimating merger rates because the extinction corrections become smaller and simpler.
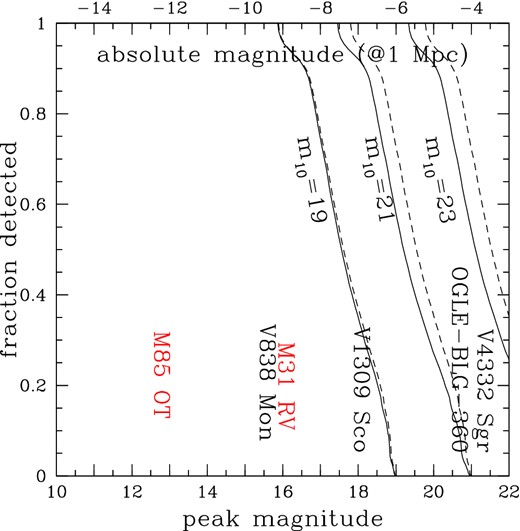
Estimated completeness as a function of apparent magnitude (lower axis) or converted to the absolute magnitude corresponding to a distance of 1 Mpc (upper axis) for a galaxy with the surface brightness profile of M31 and surveys with an empty field S/N = 10 at m10 = 19, 21 or 23 mag in either V (solid) or I (dashed) combined with a S/N = 10 detection threshold. PTF has m10 ≃ 20 mag, the POINT-AGAPE variability survey of M31 (An et al. 2004) had m10 ≃ 24 mag, and the LBT variability survey (Kochanek et al. 2008) has m10 ≃ 26 mag. The labels for the various transients are placed at their peak V-band absolute magnitude. For a galaxy at a different distance, the absolute magnitude scale should be shifted by the appropriate factor (e.g. at a distance of 10 Mpc, −10 shifts to −15).
Fig. 4 shows that it is relatively easy to detect events like V838 Mon or the M31 RV in nearby galaxies and the completeness for events like V1309 Sco will be reasonably high. PTF, for example, tries to survey M31 on a nightly basis, with an empty field S/N = 5 at 21 mag (Law et al. 2010), which would correspond to m10 ≃ 20 mag if we factor in its poorer image quality. At this depth, it is easy to detect the luminous but rarer events like V838 Mon or the M31 RV, possible to detect events like V1309 Sco, but far too shallow to detect the common events like V4332 Sgr. This is further complicated by the large numbers of other variable stars with similar luminosities to these faint transients (see e.g. the M31 variability survey by An et al. 2004).
For more distant galaxies, we simply shift the absolute magnitude scale at the top of Fig. 4 to the right. So if a survey like PTF begins to have severe completeness problems at MV ≃ −7 mag at a distance of 1 Mpc, the limit is roughly MV ≃ −9 mag at 3 Mpc (e.g. M81) and MV ≃ −12 mag at 10 Mpc. Substantially deeper surveys are needed to detect the more common but fainter events. None the less, for a luminosity function declining as L−x, the number of events out to distance d grows as d5 − 2x ∼ d2 for our estimate of x ≃ 3/2, giving a survey like PTF considerable sensitivity to the bright end of the luminosity function (objects like the M 85-OT; Kulkarni et al. 2007).
3 SCALINGS WITH MASS
The four Galactic objects also have progenitor mass estimates, and Fig. 5 shows the absolute magnitudes of the progenitors and the transient peaks as a function of mass. We assigned a mass corresponding to the geometric mean of the estimates discussed in the appendix and use the logarithmic spread of the masses around this central value or a factor of two as the nominal error on the mass. We simply assign 0.3 mag as a nominal error in the magnitudes, as this will be dominated by systematic uncertainties in distances and extinction. Despite these various limitations, there appear to be broad correlations of these magnitudes with mass. For the progenitors, they must exist because the mass estimates are derived from the inferred luminosities. OGLE 2002-BLG-360 stands out because it must be an evolved star given the assumed distance, and because the rapidly changing colour and multiple peaks of the transient lead to the estimated V- and I-band absolute magnitude peaks coming from different epochs (see Tylenda et al. 2013).
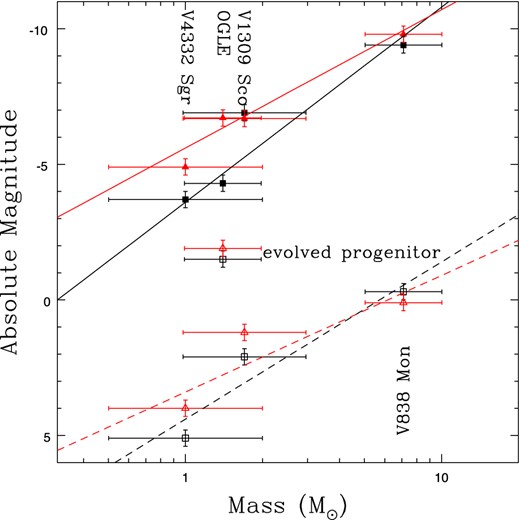
Absolute magnitudes of the progenitors (open symbols) and transient peaks (filled symbols) in the V (squares) and I (triangles) bands as a function of the progenitor mass estimates. The best power-law fits are also shown. The progenitor fits exclude OGLE-2002-BLG-360 because it must be an evolved star given its assumed distance. The V-band peak of OGLE-2002-BLG-360 may also be modestly underestimated (see the appendix). The M85 OT2006-1 would not follow these trends since Ofek et al. (2008) estimate it must have |$M<7 \,\text{M}_{\odot }$| while the transient peaked at MV ≃ −12 mag.
If we combine the luminosity function of the transients dN/dL ∝ L−x with the scaling of the transient luminosity with mass, L ∝ Ma, then the mass function of the progenitors is dN/dM ∝ M−1 + a(1 − x). For our nominal values of x ≃ 1.4 ± 0.3 and a ≃ 2.5 ± 0.5 (where we are just splitting the difference between the V- and I-band slopes from equation 8), this implies a mass function of dN/dM ∝ M−2.0 ± 0.8, consistent with typical IMFs. Turning this around, matching the slope of a Salpeter IMF, dN/dM ∝ M−2.35, corresponds to x = 1.68 or 1.45 for a = 2 or 3.
4 BINARY POPULATION SYNTHESIS MODELS
Merger rates are implicit in any binary population synthesis model, but appear never to have been explicitly presented. Here, we use the startrack population synthesis code (Belczynski, Kalogera & Bulik 2002; Belczynski et al. 2008) using the parameter choices described in Dominik et al. (2012). This model employs energy balance for CE evolution with a physical estimate for the donor's binding energy, updated wind mass-loss prescriptions and a realistic mass spectrum for compact objects. We make the very specific assumption that all donors off the main sequence (MS) are allowed to survive CE (Belczynski et al. 2007 and Belczynski et al. 2010 discuss some alternative scenarios for Hertzsprung gap donors). The IMF is a three component broken power law with boundaries at MZAMS = 0.08, 0.5, 1.0 and 150 M⊙ and slopes of −1.3, −2.2 and −2.7 for the three mass ranges (Kroupa & Weidner 2003) and all results are for solar metallicity (|$Z=\text{Z}_{\odot }=0.02$|).
We assume a binary fraction of 50 per cent, so that 2/3 of all stars are in binaries. We use a flat mass ratio distribution, P(q) constant, with 0 < q = M2/M1 < 1 (e.g. Kobulnicky & Fryer 2007), a logarithmic distribution of binary separations P(a) ∝ 1/a (e.g. Abt 1983) ranging from where the primary just fills its Roche lobe up to |$10^5 \,\text{R}_{\odot }$|, and a thermal-equilibrium distribution of eccentricities Ξ(e) = 2e for 0 < e < 1 (Duquennoy & Mayor 1991). We then evolve primaries with masses from 0.3 to 150 M⊙ and secondaries with masses from 0.08 to 150 M⊙ assuming a constant star formation rate of 3.5 M⊙ yr−1 for a period of 10 Gyr. This implies a core-collapse supernova rate of 0.018 yr−1 that is compatible with other estimates (see Adams et al. 2013).
We classify the stars as MS stars, evolved stars (off the MS but retaining a hydrogen envelope), helium stars (no hydrogen envelope) and compact objects (white dwarf, neutron star or black hole). They are referred to as the donor and companion stars following the standard terminology in binary evolution models. For comparison to the observational mass estimates, we used the mass of the donor star, as it is almost always the more massive, unless the system is a nearly equal mass (q > 0.8) MS/MS binary, in which case we used the total mass. Because stellar luminosities are such strong functions of mass, the more massive star always dominates the luminosity except for the case of nearly equal mass MS/MS binaries.
Fig 6 shows the resulting Galactic rate estimates in both integral and differential forms for the overall population and divided into MS/MS binaries and systems with at least one evolved component (‘not MS/MS’). Table 2 breaks the rates down in more detail and by whether the stars ultimately merge. The total rate in this model is 0.2 yr−1, which is compatible with our observational estimates from Section 2. Of these, 70 per cent result in a final merger and 30 per cent leave a binary. Events with two MS stars (44 per cent) or a MS star and an evolved star (42 per cent) dominate the rates. Most of the remaining events are between compact objects and MS (5 per cent) or evolved (9 per cent) stars. Events with helium stars should be very rare.
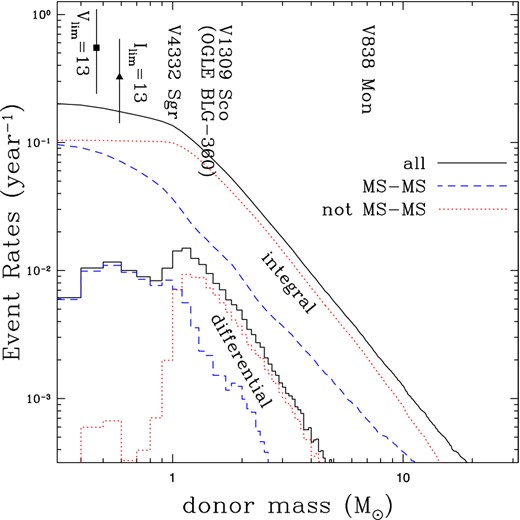
Binary population synthesis models of the differential (lower curves) and integral (upper curves) Galactic event rates for all (black solid), MS–MS (blue dashed) and not MS–MS (red dotted) binary progenitors. The filled square (filled triangle) shows the V-band (I-band) observational estimates for the Galactic merger rates assuming the thin disc mlim = 13 mag models. The labels for the four Galactic events are located at their nominal mass estimates. Three of the observed events are MS–MS and one, OGLE 2002-BLG-360, shown in parenthesis, is an MS-evolved event.
Theoretical Galactic CE rates.
| Donor/Companion | All CE | Mergers |
|---|---|---|
| MS/MS | 0.088 | 0.088 |
| MS/Evolved | 6.8 10−6 | 6.8 10−6 |
| MS/He star | 2.4 10−4 | 2.4 10−4 |
| Ms/Compact | 0.010 | 0.010 |
| Evolved/MS | 0.084 | 0.045 |
| Evolved/Evolved | 2.4 10−4 | 1.5 10−4 |
| Evolved/He star | 0.002 | 0.002 |
| Evolved/Compact | 0.018 | 0.016 |
| He star/any | 0.001 | 2.2 10−4 |
| TOTAL | 0.203 | 0.140 |
Note: Rates are in units of yr−1 for either all CE events (middle) or only the events predicted to end in a complete merger (right). Stars off the main sequence are divided into evolved stars with a hydrogen envelope and helium stars where the envelope has been lost. Compact objects include white dwarfs, neutron stars and black holes.
Interactions with evolved stars dominate at higher masses – high mass MS–MS events like V838 Mon should be the minority (20 per cent). Given the age of the Galaxy, MS events have to dominate the rates at low masses because the stars have not had time to undergo nuclear evolution. This does not mean that there are no mergers of low-mass stars because strong magnetic breaking associated with the deep convective envelopes of low-mass MS stars (Ivanova & Taam 2003), gravitational radiation, and tidal interactions can still lead to orbital decay and a CE event. The predicted rates peak for stars near 1–2 M⊙, just where we find V4332 Sgr, OGLE 2002-BLG-360 and V1309 Sco. Above M ∼ M⊙, the rate declines slightly steeper than the input IMF, roughly as M−3 instead of M−2.7. This is also broadly consistent with our inferences from the observed events in Section 3. The observed events are dominated by MS–MS events (three of four), but this is only mildly unlikely given the prediction that there are roughly equal numbers of each type. In a more detailed model of the spatial distribution, the MS–MS events are likely to be more visible because they will have higher average scaleheights and less extinction than MS–evolved star mergers.
5 DISCUSSION
Much of binary evolution depends on the rate at which stars merge or enter into CE phases. It appears likely that a significant fraction of stars must do so, in which case the rate of stellar mergers in the Galaxy must be quite high. If the class of objects encompassing V4332 Sgr, V838 Mon, OGLE 2002-BLG-360 and V1309 Sco are examples of such events, as seems almost certain following the direct observations of the merger of V1309 Sco (Tylenda et al. 2011), then the observed rate of such mergers is also high. Using the model we developed in Adams et al. (2013) to estimate the visibility of supernovae in the galaxy, we can correct the observed rate for completeness to find that the rate of mergers brighter than MV = −3 mag (MI = −4 mag) is roughly one every 2–3 years, albeit with significant uncertainties associated with the definition of the ‘survey’ conditions under which they were found. That all the transients found outside the OGLE survey are very bright (mI < 7 mag) at peak, while the one found by the OGLE bulge survey is over an order of magnitude fainter, confirms that there must be many fainter events elsewhere in the Galaxy.
The luminosity function of the transients is roughly dN/dL ∝ L−3/2, so there are intrinsically many more low-luminosity events like V4432 Sgr than high luminosity events like V838 Mon or V1309 Sco. The rate of these bright events is roughly one every 10–50 years, which roughly corresponds to crude rate estimates by Soker & Tylenda (2006) and Ofek et al. (2008). As emphasized by Kulkarni et al. (2007), the distinctive post-peak evolution of these transients to being extremely cold M/L class supergiants combined with dust formation provides a good means of recognizing these events. Some care will be required because the SN 2008S class of transients are also lower luminosity than typical supernovae and form dust (see Prieto et al. 2008; Thompson et al. 2009; Kochanek 2011). While these transients become very red, it appears to be solely due to dust absorption – a cold stellar photosphere has never been observed.
In the Galaxy, finding more examples is simply limited by the lack of complete, deeper variability surveys of the Galactic plane. I-band (or even V-band) variability surveys of the Galaxy that were complete even to mlim ≃ 16 mag would represent a significant improvement over the depth of the searches implied by the existing events (see Fig. 2). Considerable progress would be made if ASAS-SN (Shappee et al. 2014), ATLAS (Tonry 2011) or PTF (Rau et al. 2009; Law et al. 2010) systematically surveyed large fractions of the Galactic plane. LSST, unfortunately, will not emphasize variability surveys of the Galactic plane (see the critique by Gould 2013). At the moment, the best surveys for Galactic events are being carried out by Gaia (e.g. Eyer et al. 2011) and OGLE-IV (Pietrukowicz et al. 2013). A great advantage of many of the Galactic events is that it will be possible to characterize the progenitor stars.
There is no simple way to characterize existing variability surveys of nearby galaxies like M31. In a simple model for the completeness (see Fig. 4), a survey like PTF with m10 ≃ 20 mag should be able to find events like V838 Mon, the M31 RV transient, and V1309 Sco, but not significantly fainter transients like OGLE 2002-BLG-360 or V4332 Sgr. Thus, while the overall rate in M31 is probably comparable with that of the Galaxy, the rate of mergers detectable by PTF is roughly one per decade. By surveying many galaxies, PTF can have a significant rate of more luminous events (e.g. Rau et al. 2009) but this assumes that the luminosity function extends to MV ∼ −12 mag or brighter.
Deeper variability surveys like the POINT-AGAPE microlensing survey of M31 (m10 ≃ 24 mag; An et al. 2004) or our variability survey of nearby galaxies with the Large Binocular Telescope (m10 ≃ 26 mag; Kochanek et al. 2008) can find significantly fainter events. The difficulty for these faint events will be that crowding in an external galaxy will make it difficult to separate merger events from other red variable sources. In the Galaxy, this is relatively straight forward because no sources other than novae show such dramatic increases in flux, but this depends on having a large dynamic range. Archival HST photometry may supply this in some cases, and the peculiar properties of the transients may be sufficient to distinguish mergers from other sources of variability (Kulkarni et al. 2007). In any case, if these rate estimates are correct, our LBT survey must already contain several merger events and their remnants.
Even with so few examples, we can already identify several interesting correlations. First, the luminosity function of the transients is roughly dN/dL ∝ L−1.4 ± 0.3. Secondly, the peak luminosities increase rapidly with the progenitor mass, with L ∝ M2 − 3. This means that the transient peaks roughly track the MS luminosity of the progenitors but are 2000–4000 times brighter. Essentially, the photosphere seems to expand by a huge factor (∼50–100) but the photospheric temperature cannot drop by a huge factor, so to zeroth order the transient peak is simply the MS luminosity multiplied by a large number. Thirdly, the mass function of the merger progenitors is dN/dM ∝ M−2.0 ± 0.8, consistent with typical IMFs.
When we compare these to startrack binary population synthesis models (Belczynski et al. 2002, 2008) simply using the parameter choices from Dominik et al. (2012), we find remarkably good agreement between the observations and the predictions. In particular, the predicted rate of 0.2 yr−1 is high and the progenitor mass function declines roughly like the IMF. The models also predict that the rates peak at roughly M ∼ M⊙ with higher mass events dominated by systems that include at least one evolved star and lower mass events dominated by mergers of MS stars. The rates are dominated by MS–MS (44 per cent), MS–evolved (42 per cent), evolved–compact (9 per cent) and MS–compact (5 per cent) events with negligible contributions from other possibilities. Of those entering a CE phase, 70 per cent are predicted to merge. The rates in a massive early-type galaxy (a stellar mass of 1011 M⊙ at an age of 10 Gyr) should be similar (0.12 MS–MS and 0.10 MS–evolved events per year) but concentrated at lower masses (fainter transients) than for a galaxy with ongoing star formation.
There are many uncertainties in these theoretical estimates. Some of the major ones are uncertainties in the initial orbital distributions, star formation histories, stellar models and the expansion rates of stars, magnetic braking and tidal interaction models, and the development of dynamical instabilities during Roche lobe overflow leading into a CE event. For example, the orbital period distributions found by Sana et al. (2012) would have more close binaries, and hence more CE events for high mass stars than in our models. Overall, roughly one in five binaries in our models go through a CE interaction, corresponding to 2/15 of all stars and 1/10 of stellar systems. If we allowed all stars to be in binaries and all stars to undergo a CE event, we get a maximum possible Galactic rate of ∼1–2 CE events per year that could not be exceeded without carefully tuning the Galactic star formation history. Future observations to better measure the rates of these events, their progenitor mass functions and the evolutionary states of the progenitors will be a powerful constraint on many of these uncertainties.
We would like to thank N. Ivanova as the organizer of the conference ‘Stellar Tango in the Rockies’, conversations with M. Cantiello and J. Staff at the conference, and our referee, R. Tylenda. We also had valuable discussions with A. Gould, E. Ofek, O. Pejcha, M. Pinsonneault, K.Z. Stanek and T. Thompson. KB acknowledges support from a Polish Science Foundation ‘Master2013’ Subsidy, Polish NCN grant SONATA BIS 2, NASA Grant Number NNX09AV06A and NSF Grant Number HRD 1242090 awarded to the Center for Gravitational Wave Astronomy at U.T. Brownsville .
REFERENCES
APPENDIX A: SUMMARY OF OBJECTS
Here, we provide short summaries of the properties of the objects as reported in Table A1. We start with the Galactic transients ordered by date and then the two extragalactic candidates. Most of these events were found by amateurs (V3332 Sgr, V838 Mon and V1309 Sco) or serendipitously (M31 RV). OGLE-2002-BLG-360 was found as part of the OGLE microlensing survey (see Tylenda et al. 2013 for its history) and the M85 transient was found a part of the PTF survey, which is partly motivated by searching for stellar mergers (Rau et al. 2009).
V4332 Sgr (February 1994) was discovered by Hayashi, Yamamoto & Hirosawa (1994) at V ≃ 8.4 mag with no estimate of prior magnitude limits. The transient peaked at V ≃ 8.5 and I ≃ 6.9 mag and has an estimated foreground extinction of E(B − V) ≃ 0.3 mag (Martini et al. 1999). The distance is uncertain, but Tylenda et al. (2005a) argue for d ≃ 1.8 kpc where it would be a G/K MS disc star, implying masses ∼1 M⊙ with V ≃ 17.3 mag and I ≃ 15.8 mag. We do not consider the alternate possibility, that the more massive star was an evolved giant, and note that an evolved system would have to lie very far from the Galactic plane given its Galactic latitude (b = −9| $_{.}^{\circ}$|4).
V838 Mon (January 2002) was discovered by Brown et al. (2002) at a (photographic) magnitude of ∼10 mag with a limiting depth for the closest prior observation of ∼12 mag. It reached peak magnitudes of V ≃ 7.0 mag and Ic ≃ 5.5 mag (Munari et al. 2002). Light echoes (Bond et al. 2003) enabled an accurate determination of the distance to be d ≃ 6.1 ± 0.6 kpc (Sparks et al. 2008). Several lines of evidence lead to an estimated foreground extinction of E(B − V) ∼ 0.7–0.9 mag (e.g. Munari et al. 2005; Tylenda, Soker & Szczerba 2005b). The more luminous component of the merger was probably a 5–10 M⊙ B star (Tylenda et al. 2005b) and there is no direct constraint on the secondary. From this study, we adopt I = 15.8 and estimate V = 17.3 mag. As expected for such a young star, V838 Mon lies in the Galactic plane.
OGLE-2002-BLG-360 (2002 October) was initially considered a long duration microlensing event and then later realized to be a likely stellar merger (Tylenda et al. 2013). The OGLE trigger occurred at I ≃ 15.5 mag, as the object brightened from a baseline at I ≃ 16 mag, and then peaked at V ∼ 16.5 and I ∼ 11.3 mag, making it much redder near peak than most of the other merger candidates. In fact, the V-band and I-band peaks occur at different epochs. Tylenda et al. (2011) adopt a foreground extinction of E(B − V) ≃ 1 mag and place the event in the Galactic bulge at d = 8.2 kpc in the absence of any direct constraints. They also found that the progenitor showed a significant mid-IR excess which, combined with its red colour, implied the presence of τV ∼ 3 of circumstellar dust in addition to the foreground component. We treat this source as if it has a total extinction of E(B − V) ≃ 2 mag. Tylenda et al. (2013) model the progenitor as a L ≃ 300 L⊙ K giant with V = 19.3 mag and I = 16.1 mag, which would correspond to a relatively low mass 1–2 M⊙ evolved star. Primarily due to extinction, the peak V magnitude may be modestly underestimated, but we also note that the light curve is not well sampled.
V1309 Scorpii (2008 September) was independently discovered by Nishiyama & Kabashima at (unfiltered) 9.5 mag with prior upper limits of 12.8 mag, and by Sun et al. at 10.5 mag with prior upper limits of 13.5 mag (Nakano et al. 2008). The event peaked at V ≃ 8 mag and I ≃ 7 mag (see Mason et al. 2010, Tylenda et al. 2011). Mason et al. (2010) pointed out that the properties of the transient were very similar to those of V838 Mon. In this case, pre-explosion light curves clearly show that the transient was caused by a stellar merger, probably two K giants with a total mass of 1–3 M⊙ at a distance of 3.0 ± 0.7 kpc with V = 17.0 mag and I = 14.9 mag (Tylenda et al. 2011). This mass range seems to be consistent with theoretical examinations of the binary evolution (Stȩpień 2011; Nandez et al. 2014, Pejcha 2014). Extinction estimates range from 0.6 ≲ E(B − V) ≲ 1.0 mag (Mason et al. 2010; Tylenda et al. 2011). Given the estimated distance and its Galactic coordinates, this event is also associated with the Galactic disc.
M31 RV (‘Red Variable’) was found by Rich et al. (1989) in 1988 September as a new source with i ∼ 14.9 and g ∼ 16.9 mag. With additional data by Mould et al. (1990), Bryan & Royer (1992) and Tomaney & Shafter (1992), the transient peak was near R ≃ 16 and B ≃ 18 mag followed by dust formation and a rapid fading. Rich et al. (1989) estimated E(B − V) ≃ 0.3 mag and the distance is d ≃ 1 Mpc. Using Te ≃ 4500 K, typical of these transients at peak, we converted these peak magnitudes to V ≃ 17.0 and I ≃ 15.5 mag.
M85 OT2006-1 (2006 January) peaked at R ≃ 19.0 and I ≃ 18.5 mag (Kulkarni et al. 2007) with and estimated foreground extinction of E(B − V) ≃ 0.1–0.2. Based on the absence of the progenitor in archival HST data, Ofek et al. (2008) argue that the progenitor must have M < 7 M⊙ and suggest M ∼ 2 M⊙. Again using Te ≃ 4500 K, we converted the R magnitude to V ≃ 19.7 mag.
Properties of merger candidates.
| Object | Peak mag | Dist | E(B − V) | Peak abs mag | Progenitor | Mass | |||
|---|---|---|---|---|---|---|---|---|---|
| V | I | (kpc Mpc−1) | (mag) | MV | MI | MV | MI | M⊙ | |
| V4332 Sag | 8.5 | 6.9 | 1.8 | 0.30 | −3.7 | −4.9 | 5.1 | 4.0 | 1 |
| V838 Mon | 7.0 | 5.5 | 6.1 | 0.80 | −9.4 | −9.8 | −0.3 | 0.1 | 5 − 10 |
| OGLE -BLG-360 | 16.5 | 11.3 | 8.2 | 2.00 | −4.3 | −6.7 | −1.5 | −1.9 | 1 − 2 |
| V1309 Sco | 8.0 | 7.0 | 3.0 | 0.80 | −6.9 | −6.7 | 2.1 | 1.2 | 1 − 3 |
| M31 RV | 17.0 | 15.5 | 1.0 | 0.30 | −8.9 | −10.0 | – | ||
| M85 OT | 19.7 | 18.5 | 17.8 | 0.20 | −12.2 | −13.1 | <7 | ||
Note: The appendix provides a more detailed discussion, parameter ranges and references for each object. The distances are in kpc (Mpc) for the Galactic (extragalactic) objects. We have included the estimated circumstellar extinction for OGLE-2002-BLG-360 in the estimate of E(B − V). Due to extinction and light-curve sampling, the peak V magnitude of this event is more uncertain that the other table entries.
