


Abstract
Summary: We present here Blast2GO (B2G), a research tool designed with the main purpose of enabling Gene Ontology (GO) based data mining on sequence data for which no GO annotation is yet available. B2G joints in one application GO annotation based on similarity searches with statistical analysis and highlighted visualization on directed acyclic graphs. This tool offers a suitable platform for functional genomics research in non-model species. B2G is an intuitive and interactive desktop application that allows monitoring and comprehension of the whole annotation and analysis process.
Availability: Blast2GO is freely available via Java Web Start at http://www.blast2go.de
Supplementary material: http://www.blast2go.de -> Evaluation
Contact: aconesa@ivia.es; stefang@fis.upv.es
INTRODUCTION
One of the most important aspects in mining genomics data is to associate individual sequences and related expression information with biological function. Automatic functional annotation is an effective approach to solve this problem. Functional annotation allows categorization of genes in functional classes, which can be very useful to understand the physiological meaning of large amounts of genes and to assess functional differences between subgroups of sequences. The Gene Ontology (GO) developed at the GO Consortium (Ashburner et al., 2000) provides a suitable framework for this kind of analysis, due to the wide scope of biology covered and its directed acyclic graph (DAG) structure that enables visualization in the context of biological dependences. Different development teams have released software to analyze sequences by the use of GO. A variety of desktop and web applications are available to electronically assign GO terms to unknown sequences based on similarity (Martin et al., 2004; Groth et al., 2004; Khan et al., 2003; Zehetner, 2003) or to analyze genomic data in the context of gene annotation (Al-Shahrour et al., 2004; Doniger et al., 2003). However, when trying to perform GO-based analysis in poorly characterized organisms we encountered a number of drawbacks. In general, these tools are either not designed for high-throughput sequence annotation, are limited in their mining and visualization capabilities, or accept only gene or probe identifiers as input data, making them restrictive to annotated sequences already deposited in public databases. In order to provide a suitable solution to these limitations we have developed Blast2GO (B2G), a universal GO annotation, visualization and statistics framework that brings advanced functional analysis to the genomics research of non-model species. B2G has been design to (1) allow automatic and high throughput sequence annotation and (2) integrate functionality for annotation-based data mining. Briefly, B2G uses BLAST (Altschul et al., 1990) to find homologs to fasta formatted input sequences. The program extracts GO terms to each obtained hit by mapping to existent annotation associations. An annotation rule finally assigns GO terms to the query sequence. Annotation and functional analysis can be visualized in a graph form reconstructing the GO relationships and color-highlighting the most relevant areas (Fig. 1). B2G was conceived to be an attractive tool for research environments where genetic and/or computational resources are limited and where much work is still done in an explorative fashion. B2G is a user-friendly, easy to distribute and low maintenance tool. It allows monitoring and interaction at different steps of the analysis, and emphasizes visualization as an important component of knowledge acquisition. B2G is a Java application made available by Java Web Start. It is platform independent and has no further requirements than an Internet connection.
OBTAINING GO TERMS
The first step in B2G is to find sequences similar to a query set by Blast searching. Homology search can either be done at public databases (e.g. NCBI nr and est using QBlast) or custom databases (e.g. GO annotated sequence sets and single species DBs) when a local www-Blast installation is available. Blast expectation values (E-value) and hit number thresholds are provided to retrieve significant results. To avoid the danger of annotation by short matches with low E-values, an additional filter can be set to the minimal alignment length (hsp-length). Annotation, however, will ultimately be based on sequence similarity levels since similarity percentages are independent on database size and more intuitive than E-values.
In order to retrieve GO terms associated with the obtained hits, a quite straight forward mapping is made. By using Blast hit gene identifiers (gi) and gene accessions B2G retrieves all GO annotations for the hit sequences, together with their evidence codes (EC). ECs can be interpreted as an index of the trustworthiness of the GO annotation. At the end of the mapping processes, for each query sequence, a set of candidate annotations from different hits of diverse similarity levels and various annotation sources is gathered.
ANNOTATION ASSIGNMENT
Annotation is performed by applying an annotation rule (AR) to the obtained ontologies. The rule seeks to find the most specific annotations with a certain level of reliability. This process is adjustable in specificity and stringency.
STATISTICS
Once GO annotation is available through B2G (uploading an existing annotation file is also supported), the application offers the possibility of direct statistical analysis on gene function information. A common analysis is the statistical assessment of GO term enrichments in a group of interesting genes when compared with a reference group. This functionality was introduced in B2G by integrating Gossip (Blüthgen et al., 2004). Gossip computes Fisher's Exact Test applying robust FDR (false discovery rate) correction for multiple testing and returns a list of significant GO terms ranked by their corrected or one-test P-values. Furthermore B2G offers various statistical charts summarizing the results obtained at blasting, mapping or annotation. Bar or pie charts of similarity/E-value distributions, EC distributions and annotation statistics (GOs/Seqs) can be generated, saved and printed.
VISUALIZATION
Visualization is an important aspect in B2G. For each sequence, the progress in the annotation process and the final annotation step are visualized on the main application table by successive color changes. This allows the researcher to readily spot sequences that failed the initial annotation process and, if desired, modify annotation parameters for those. Furthermore, the joined biological meaning of a set of sequences can be visualized on the GO DAG by color-intensity highlighting of the most relevant nodes in a combined sequence graph. Those nodes are identified by computing a node score that takes into account the number of sequences converging at one node and penalizes by the distance to the node where each sequence was annotated. Alternatively, when an enrichment analysis is available, graph color highlighting by statistical results will show the GO-term specificity of the query subset.
VALIDATION
The performance of Blast2GO has been tested using a dataset for which annotation and functional information was available. The methodology and results of this evaluation are given as supplementary material and are available at the B2G site. Our results show that Blast2GO reaches an annotation accuracy of 65–70%, which is commonly reported in automatic GO annotation methods (Martin et al., 2004; Khan et al., 2003). More interestingly, this evaluation shows that the tool is successful in extracting relevant functional features of these sequences based on the use of the predicted annotation.
CONCLUSIONS
By joining annotation to function analysis B2G provides a powerful data mining tool ideally suited to support genomic research in non-model species. Its species-independent character and different data input fronts makes it a valuable mining resource for potentially any organism. B2G combines high-throughput analysis, statistical evaluation and biology framed visualization with a high degree of user interaction. Further developments of Blast2GO will include extension to multiple annotation types and novel statistical analysis tools.
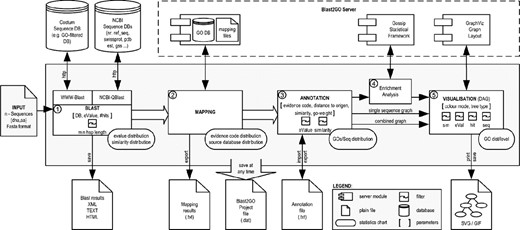
Application overview. The figure shows schematically a typical run of B2G. Used symbols are described in the embedded legend. Numbered circles denote the major application steps. From the left to the right these are (1) Blasting: a group of selected sequences is blasted against either the NCBI or custom databases, (2) Mapping: GO terms are mapped on the blast results using annotation files provided by the GO Consortium that are downloaded on a monthly basis at the Blast2GO server, (3) Annotation: sequences are annotated using an annotation rule that takes parameters provided by the user, (4) Statistical analysis: optionally, analysis of GO term distribution differences between groups of sequences can be performed and (5) Visualization: annotation and statistics results can be visualized on the GO DAG. At each of these steps, different charts are available to evaluate the progress of the analysis and data can be saved and exported in different formats.
†The authors wish it to be known that, in their opinion, the first two authors should be regarded as joint First Authors.
The authors thank Dr Timothy Williams for fruitful discussions and comments on the software and Nils Bluethgen for kindly providing the Gossip software and supporting integration in B2G. This work has been funded by MCyT (GEN 2001 - 4885-C05-03) and eTumour Project (FP6-2002-LIFESCIHEALTH 503094). The authors thank the INBIOMED G03/160 research thematic network financed by FIS of the Instituto de Salud Carlos III.
Conflict of Interest: none declared.
REFERENCES
Al-Shahrour, F., et al.
Blüthgen, N., Brand, K., Cajavec, B., Swat, M., Herzel, H., Beule, D.
Doniger, S., et al.
Groth, D., et al.
Martin, D., et al.

