

Abstract
In the field of sustainable energy storage systems, zinc-ion batteries (ZIB) employing aqueous electrolytes have emerged as viable successors to the widely used lithium-ion batteries, attributed to their cost-effectiveness, environmental friendliness, and intrinsic safety features. Despite these advantages, the performance of ZIBs is significantly hindered by the scarcity of suitable cathode materials, positioning manganese zinc oxide (ZnMn2O4) as a potential solution. In this study, we describe the ZnMn2O4 (ZMO) compound focusing on its properties variations during Zn extraction and potential battery applications. For the sake of comparison, we also analyze the same properties of the LiMn2O4 in its tetragonal phase (TLMO), for the first time, motivated by a recent discovery that the substitution of Zn ions by Li in ZMO forms isostructural TLMO compound at room temperature. The study was conducted within the density functional theory (DFT) framework, where the structural, electronic, magnetic, electrochemical, and spectroscopic properties of ZMO and TLMO are investigated under various conditions. Although both systems crystallize in tetragonal structures, they demonstrate distinct electronic and magnetic properties due to different oxidation states of the Mn. Computationally optimized lattice parameters align closely with experimental values. The TLMO exhibits a narrower band gap compared to ZMO, indicating enhanced electrical conductivity. In addition, TLMO presented a lower diffusion energy barrier than ZMO, indicating better ionic conductivity. To evaluate the potential application of these materials in battery technologies, we further explored their volume changes during charging/discharging cycles, simulating Zn or Li ions extraction. TLMO underwent a significant volume contraction of 5.8% upon complete Li removal, while ZMO experienced a more pronounced contraction of 12.5% with full Zn removal. By adjusting ion extraction levels, it is possible to reduce these contractions, thereby approaching more viable battery applications. Voltage profiles, constructed from DFT-based simulation results, unveiled an average voltage of 4.05 V for TLMO, closely matching experimental values. Furthermore, spectroscopy results provide insights into the electronic transitions and validate the computational findings, consolidating our understanding of the intrinsic properties of ZMO and TLMO.
Export citation and abstract BibTeX RIS

Original content from this work may be used under the terms of the Creative Commons Attribution 4.0 license. Any further distribution of this work must maintain attribution to the author(s) and the title of the work, journal citation and DOI.
1. Introduction
Lithium-ion batteries (LIBs) are extensively employed in various electronic applications owing to their high energy density, ease of mobility, and prolonged cycle life. However, the substantial demand for lithium metal and its limited availability raise concerns about its impact on the sustainable development of large-scale applications. This issue underscores the need to search for viable alternatives to LIBs. Sodium-ion batteries (SIBs) are being considered as one such alternative, and numerous sodium-based cathode materials are under development, with a particular focus on layered oxides [1–3]. Another promising alternative is zinc-ion batteries (ZIBs) utilizing aqueous electrolytes. ZIBs offer several advantages over LIBs, including cost-effectiveness, high specific capacity, environmental compatibility, and safety. However, the lack of suitable cathode materials for the charge/discharge cycle has largely hindered its applications [4, 5].
Manganese zinc oxide (ZnMn2O4, ZMO) has emerged as a viable candidate for cathode material in aqueous ZIBs [6–8]. This choice is attributed to its environmentally friendly characteristics, low cost, easy synthesis, and high theoretical specific capacity (223.73 mAh g−1). Nonetheless, experimental investigations have revealed that the ideal structure of ZMO spinel is inappropriate for Zn insertion/extraction due to the strong electrostatic repulsion between Zn2+ ion and the crystalline structure of the cathode material, resulting in low ionic conductivity. To overcome this problem, several experimental procedures are being carried out on the ideal structure, such as manganese vacancy, oxygen vacancy, morphology alteration, and doping [5, 6, 8–12].
Some experimental work combined with theoretical calculations attempted to improve the ZMO electrical and ionic conductivity. Shao et al [10], for instance, conducted experimental Fe and K doping and co-doping in ZMO, subsequently employing density functional theory (DFT) to validate the improvement in electrical conductivity, analyzing the material band gap before and after doping. However, it is worth noting that these simulations appear to lack refinement for several reasons: (1) the calculations were performed under ferromagnetic (FM) conditions, inconsistent with experimental results [13]; (2) the exchange and correlation effects were described only by the GGA-PBE functional [14], which is not ideal, as it is well known that it underestimates the band gap of insulators and semiconductors; (3) the simulations of doped and co-doped ZMO were conducted on a conventional cell, containing only 28 atoms, potentially leading to strong interactions among the impurity and its images. These factors significantly impact the band gap value and, consequently, the assessment of the material's electrical conductivity. Notably, in a recent collaborative experimental/theoretical study co-authored by Yang et al [11], ZMO was doped with S, and again similar procedures, lacking refinement, as those previously described in premises (1), (2), and (3) were repeated.
Islam et al [9] carried out an experimental investigation of Mn-vacancy in ZMO and analyzed its electrochemical performance. The authors used the DFT + U methodology [15–17] (U = 3.9 eV for Mn-3d states) to analyze how Mn deficiency improves the material's electrical conductivity. However, these calculations were carried out upon FM arrangement of the Mn moments, in disagreement with the experimental findings. Furthermore, the Mn-vacancy was simulated without using the supercell scheme, leading to dubious results. Chen et al [12] experimentally doped ZMO with Fe, Co, and Mg, simultaneously, employed DFT-based calculations to elucidate why Fe-doping exhibited superior zinc storage properties compared to Mg- and Co-doping. The authors performed the simulations using only the GGA-PBE functional to describe the exchange and correlation effects and, in addition, the calculations were conducted assuming FM order of the Mn moments. Zhang et al [5] conducted experimental investigations on the electrochemical properties of oxygen-vacancy in ZMO and then used DFT + U (with U = 3.0 eV for Mn- states) to describe the electronic and ionic conductivity of the material, also under FM alignment.
The aforementioned studies aimed to simulate the electrical and ionic conductivity of ZMO. Nevertheless, it is important to recognize that these properties strongly depend on the conditions and premises of the simulations. As evident from previous theoretical works, the simulations lack refinement. This is partly because all cited works are primarily experimental, with computational simulations serving as supplementary ingredients, often discussed briefly within the articles. Neglecting the effects of strongly correlated on-site electrons on the Mn- states, employing incorrect magnetic ordering, and utilizing small cells to simulate defects and impurities, can directly influence the assessment of the electronic properties and, consequently, the material electrical and ionic conductivities.
An understanding of the structural, electrochemical, and spectroscopic properties of ZMO is essential for improving the charge/discharge cycle. The first goal of the present study is to gain deeper insights into these ZMO properties and to elucidate the fundamental physics that governs them. Specifically, the aim is to analyze the structural, electronic, magnetic, electrochemical, and spectroscopic properties of ZMO in its stoichiometric structure. Furthermore, we conduct ab-initio calculations to explore, for the first time, how these properties evolve during battery charging, i.e. extracting Zn2+ ion from the ZMO structure.
Notably, the ionic radii of Zn2+ (0.74 Å) and Li+ (0.76 Å) are nearly identical. Previous experimental findings have demonstrated that during cycling, the replacement of Zn2+ by Li+ in the tetragonal structure of ZnMn2O4 leads to the formation of a tetragonal phase of LiMn2O4 (TLMO) at room temperature [18]. The authors showed that TLMO, as an electrode, exhibits mixed behavior of pseudocapacitor and battery in aqueous electrolytes. This discovery is particularly intriguing as the majority of research has been focused on investigating the cubic phase of LiMn2O4 (CLMO) as an electrode, with limited attention given to the TLMO phase. Abdollahifar et al [18] analyzed several properties of TLMO, such as specific capacity and capacity retention, but numerous other properties of this material remain inadequately explored. In the literature, it is known that subjecting LiMn2O4 to non-hydrostatic pressure results in a CLMO to TLMO phase transition at approximately 0.4 GPa [19]. However, the TLMO phase formation via ionic substitution is for the first time described.
All these facts inspired us to define the second objective of the present study, which is a mapping of the TLMO properties that have not been reported so far. Accordingly, we performed calculations for this compound by ionic replacement of Zn2+ by Li+ in the stoichiometric tetragonal structure of ZMO (SG  , #141). Subsequently, we provide a first-of-its-kind exploration of structural, electronic, magnetic, electrochemical, and spectroscopic properties of the optimized TLMO fully lithiated, partially lithiated, and fully delithiated. Additionally, we compare these properties with those of the ZMO, providing an evaluation of the behavior of two isostructural cathode materials, one Zn-based and the other Li-based, under the battery charging process.
It worth noting that, compared to the other electrodes (for details see tables S1 and S2 of the supplementary information—SI), the TLMO presents a very desirable electrochemical performance. The ZMO and its derivatives, despite not having the same performance as TLMO, present superior or similar performance to other electrodes. In addition to the electrochemical performance of the electrode, it is important to analyze other characteristics, such as price, environmental compatibility, and manufacturing ethics. A detailed discussion of the advantages of using Mn oxide-based cathodes can be found in the SI.
Previous experimental work [7, 18] has analyzed specific capacity; retention of specific capacity after tens, hundreds, or thousands of cycles; columbic efficiency; voltage; and redox processes to characterize TLMO and ZMO as promising materials to be used as cathodes in LIBs and ZIBs, respectively. However, several properties of these materials still need to be analyzed and understood before these compounds could be applied on the industrial battery scale. For example, the structural and electronic behavior during Li or Zn extraction, the formation of stable intermediate phases during Li or Zn extraction, in addition to electric and ionic conductivity, are fundamental factors that contribute to the good electrochemical performance of the cathode. These properties are for the first time correctly predicted and analyzed by us in this work, thus assisting and guiding future experimental work. In addition to these theoretical predictions, we successfully reproduced some of the existing experimental properties, such as the redox process, band gap width and nature, and voltage, which shows that our theoretical prediction results are very well described.
2. Methodology and calculation details
The computational simulations were carried out using the all-electron spin-polarized full-potential linearized augmented plane wave (FP-LAPW) method [20], implemented in the WIEN2k computational package [21], within the framework of the DFT [22, 23]. Convergence in total energy was achieved using a  parameter, which defines the number of plane waves that describe the electronic wave functions in the interstitial region.
  is the smallest radius of atomic spheres, these were chosen to be
  (Mn) = 1.89,
  (O) = 1.62,
  (Zn) = 1.90, and
  (Li) = 1.61 atomic units (a.u.). The valence settings used were Li:
 , Zn: 3p63d104s2, Mn:
 , and O:
 . Calculations were performed with a 24 K-points mesh in the irreducible part of the Brillouin zone, according to the Monkhorst–Pack scheme [24]. The exchange-correlation effects were treated by the generalized gradient approximation (GGA), within Perdew–Burke–Ernzerhof parametrization (PBE) [14] plus the Hubbard-
 potential [15–17] to describe in a mean-field approximation the electronic correlation among the Mn-
 electrons. The
  value that best described the experimental properties (band gap) was 6.0 eV. Other
  used values and the theoretical and experimental band gaps comparison can be found in table S3 of the SI. In the literature, only the ZMO experimental band gap value is available [25–27], making it a complex task to determine the most appropriate
  value that accurately describes the properties of TLMO. However, we can observe in table S3 and figure S1 that the TLMO electronic structure changes only smoothly with the
  values variation, so we chose to maintain the same value determined for the ZMO compound (6.0 eV).
The aforementioned computational parameters were chosen in order to efficiently reproduce the properties of the compounds calculated in this work. The only parameter able to change the cathodic properties of materials is the U value, since if we increase the values of  or K-points the change in total energies are insignificant. We present, as an example, in table S4 (SI), how some cathodic properties of the ZMO vary with the chosen U value.
The calculations were carried out in both ferromagnetic (FM) and antiferromagnetic (AFM) ordering. Our findings revealed that, for ZMO, the AFM structure exhibits a total energy that is 0.26 eV lower than that of the FM structure, aligning with experimental observations [13]. To illustrate the significant influence of magnetic ordering on the electrical conductivity of the material, we present the band gap values in table S5, calculated using AFM and FM ordering. Notably, even when employing the same  values, calculations conducted under the FM alignment present significantly narrower band gap values compared to those performed under the AFM ordering. This finding suggests that the previous studies, referenced in the introduction, which simulated the ZMO in FM configuration may not accurately describe the material's true electrical conductivity. On the other hand, for TLMO, the FM structure is 0.05 eV more energetically favorable than the AFM one. Therefore, we decided on performing all calculations using the AFM ordering for ZMO and the FM one for TLMO. All calculations were carried out considering conventional cells with 28 atoms.
The average open circuit voltage was calculated based on the following two formulas:


where  ,
,  ,
,  , and
, and  are the compounds DFT total energy (with
  ),
),  are the energy of the Li or Zn standard ground state, i.e. the DFT total energy of metallic bcc Li or hcp Zn, per atom, and
  is the number of transferred electrons.
During Li extraction from the TLMO or Zn extraction from the ZMO, the formation energy of a  or
or  phase was calculated using


where ![$E\,\left[ {{\text{L}}{{\text{i}}_x}{\text{M}}{{\text{n}}_2}{{\text{O}}_4}} \right],\,E\left[ {{\text{LiM}}{{\text{n}}_2}{{\text{O}}_4}} \right],\,E\left[ {{\text{Z}}{{\text{n}}_x}{\text{M}}{{\text{n}}_2}{{\text{O}}_4}} \right],\,{\text{and}}\,E\left[ {{\text{ZnM}}{{\text{n}}_2}{{\text{O}}_4}} \right]$](https://content.cld.iop.org/journals/2515-7655/6/2/025025/revision2/jpenergyad39dcieqn30.gif) are the compounds DFT total energies, while
are the compounds DFT total energies, while ![$E\left[ {{\text{M}}{{\text{n}}_2}{{\text{O}}_4}} \right]$](https://content.cld.iop.org/journals/2515-7655/6/2/025025/revision2/jpenergyad39dcieqn31.gif) in (3) and (4) equations are the optimized total energies of the TLMO fully delithiated and of the ZMO which all Zn atoms where extracted, respectively. The theoretical specific capacity of the ZMO and TLMO can be calculated by
in (3) and (4) equations are the optimized total energies of the TLMO fully delithiated and of the ZMO which all Zn atoms where extracted, respectively. The theoretical specific capacity of the ZMO and TLMO can be calculated by

where F is the Faraday constant and  is the electrode molar mass.
The ionic diffusion was calculated with the Cambridge sequential total energy package (CASTEP) plane-wave code [28], using OTFG (on-the-fly generated) ultrasoft pseudopotentials [29]. The exchange-correlation effects were treated by the GGA, within PBE parametrization [14]. For these calculations, supercells with 112 atoms (2 × 2 × 1) were constructed for both ZMO and TLMO. A cutoff energy of 500 eV was considered for the plane wave basis set and the irreducible part of the Brillouin zone was sampled by a 18 K-points mesh, following the Monkhorst-Pack scheme. The Zn- , Li-
, Li- , Mn-
, Mn- , and O-
 were taken as valence electrons. The same
  eV for the Mn-
 states were used, and the diffusion energy barriers were obtained by applying a full linear and quadratic synchronous transit (LST/QST) transition state (TS) search algorithm in CASTEP [30].
3. Results and discussion
3.1. ZMO and TLMO without Zn or Li deficiency
Under ambient conditions, ZMO crystallizes in a tetragonal structure with space group  Mn3+ ions are in octahedral sites (Wyckoff atomic position 8d) while Zn2+ ions are in tetrahedral sites (4a), as shown in figure S2. After replacing Zn by Li in the ZMO structure, the formed TLMO structure also remains tetragonal. Thus, Li ions are in tetrahedral sites (4a) while Mn ions are in octahedral sites (8d). The TLMO compound is a mixed oxide in which Mn is in both +3 and +4 oxidation states: 50% of them are formed by active Jahn-Teller ions (Mn3+) and 50% formed by non-active Jahn-Teller ions (Mn4+), as schematically depicted in figure S2. This mixed configuration is also observed for the cubic and orthorhombic phases [31, 32].
After the structural optimization step, where the atomic positions were relaxed and lattice parameters were optimized, the electronic structures of TLMO and ZMO were obtained. Table 1 shows the results of the lattice parameters, Mn oxidation states, magnetic moments, and band gap calculations for the stoichiometric configurations. The lattice parameters are in very good agreement with the available experimental data. The Mn3+ ion has four unpaired  electrons while the Mn4+ has three unpaired
  electrons, therefore the magnetic moment of Mn3+ should be larger than the magnetic moment of the Mn4+ ion, as obtained by our calculations. The ZMO experimental band gap is very well described using
  eV. To the best of our knowledge no experimental results regarding the band gaps of TLMO have been reported before. The TLMO exhibits a band gap of 0.89 eV and the ZMO a band gap of 1.83 eV. Therefore, TLMO has a higher ability to create electron-hole pairs under sunlight exposition than ZMO.
Table 1. Theoretical lattice parameters, Mn oxidation states, magnetic moments  , and band gaps of TLMO (tetragonal phase of LiMn2O4) and ZMO (ZnMn2O4) compounds. Available experimental data are also shown.
 ( ( ) ) |
 ( ( ) ) | Mn oxidation state |
 ( ( ) ) | gap (eV) | |
|---|---|---|---|---|---|
| Theor. | |||||
| ZMO | 5.82 | 9.33 | Mn3+ | 3.67 | 1.83 |
| TLMO | 5.77 | 9.08 | Mn3+ | 3.64 | 0.89 |
| Mn4+ | 3.00 | ||||
| Expt. | |||||
| ZMO | 5.72 [33] | 9.23 [33] |
 4 [13] 4 [13] | 1.86 [25–27] | |
| TLMO | — | — | — | — |
The TLMO and ZMO partial densities of states (PDOS) are shown in figure 1. The TLMO has two types of Mn ions in its structure (Mn3+ and Mn4+) while ZMO has only one (Mn3+). The crystals tetragonal symmetry splits the  states of the Mn3+ ion and the electronic configuration is given by
  ,
,  ,
,  ,
,  while in the Mn4+ ion the electronic configuration is given by
  +
+  ,
,  +
+  .
.
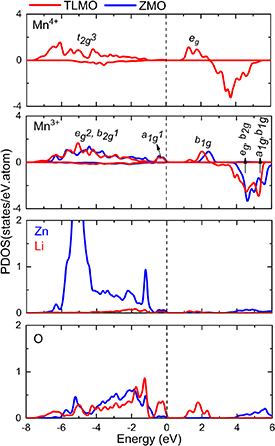
Figure 1. Partial density of states (PDOS) of TLMO (tetragonal phase of LiMn2O4) and ZMO (ZnMn2O4). The dashed lines indicate the Fermi level.
Download figure:
Standard image High-resolution image3.2. ZMO and TLMO with Zn or Li deficiency
To investigate the alterations in ZMO and TLMO properties resulting from Li or Zn extraction, we constructed various structures with different concentrations of lithium or zinc ( and
and  ,
,  ). Subsequently, we analyzed several material properties, including changes in volume, formation energy of intermediate phases, voltaic profile, redox processes, and electronic and ionic conductivity. Firstly, we analyzed how the lattice parameters and consequently the volume of the TLMO and ZMO behave during Li or Zn extraction. In the computational screening of electrode material, we consistently seek those that present the smallest possible volume change during the extraction/insertion of Li or Zn. Materials with zero or close to zero expansion/contraction during cycling have been widely studied for application in solid-state batteries [34, 35]. Figure S3 shows the variations of the lattice and volume parameters of the compounds throughout the Li or Zn extraction process. TLMO experienced a volume contraction of 5.8%, upon the complete removal of Li, which is an acceptable value to be applied as a cathode material in LIBs with soluble electrolytes. However, despite this minor contraction, TLMO could not be considered viable for use in solid-state batteries, where the electrolytes are solid and the tension (contraction/expansion) during cycling could potentially damage the battery. In turn, ZMO suffered a volume contraction of 12.5% when all Zn was removed. The host matrix is expected to undergo a more significant change in volume during the insertion/extraction of divalent ions compared to monovalent ions, as obtained by us in the case of Zn and Li in ZMO and TLMO, respectively.
Several strategies exist to mitigate changes in volume during battery cycling [34, 35]. One approach involves not extracting all the Li or Zn ions during the battery charging process. For instance, when only 75% of the Zn ions are extracted from the ZMO structure, the volume contracted by 9.6%, and with only 50% of Zn ions extraction, the contraction was 6.4%. In the case of the TLMO structure, extracting 75% of the Li ions resulted in a 4.8% volume contraction, while extracting 50% of the Li ions resulted in a 4.0% contraction. It should be noted that experimentally, not all Zn or Li ions are extracted from their respective host matrices. This is the reason why the theoretical specific capacity is higher than the experimental one. For example, experimentally only 0.8 Li per formula unit is extracted from the LMO cubic phase (80%), which corresponds to a specific capacity of  mAh g−1, whereas the theoretical specific capacity is estimated to be
  mAh g−1 with all lithium extracted.
After detailing the structural properties during battery charging, we shifted our focus to analyzing the voltage. To calculate the voltage, we only need to perform three independent first-principles calculations for each material, as described by equations (1) and (2). This approach implies that the average voltage of a material, TLMO for instance, can be straightforwardly derived from the results of DFT calculations performed on LiMn2O4, Mn2O4 (optimized TLMO fully delithiated), and metallic bcc lithium. Provided that the stable intermediate phases are known as a function of Li concentration, it is possible to employ them to compute a piecewise approximation of the voltage curve. However, the real challenge lies in determining which phases are thermodynamically stable during battery charging and what are their respective crystalline structures. The relevant quantity to determine the stable intermediate phases is the formation energy ( ), which is calculated in relation to the reference materials energies, as detailed in equations (3) and (4). For the sake of illustration, during delithiation process in TLMO, the formation energy of a
  phase is calculated from its total energy and the reference materials energies of
  and
and  . The formation energy for all
  phases, which are stable in comparison to the reference phases, lie on the lower convex hull in a plot of
  versus composition
  [36–38].
Ab initio calculations are not suitable for describing the stable intermediate phases that are formed during battery charging/discharging, due to the extensive number of possible lithium/vacancy orderings, preventing the energy evaluation of all configurations [37]. Generally, the intermediate phases are obtained by the cluster expansion technique [38–40]. However, as the conventional TLMO and ZMO cells have only four Li ions and four Zn ions, respectively, we accepted the challenge of verifying whether any intermediate phase is formed and what are the configuration of their crystalline structures.
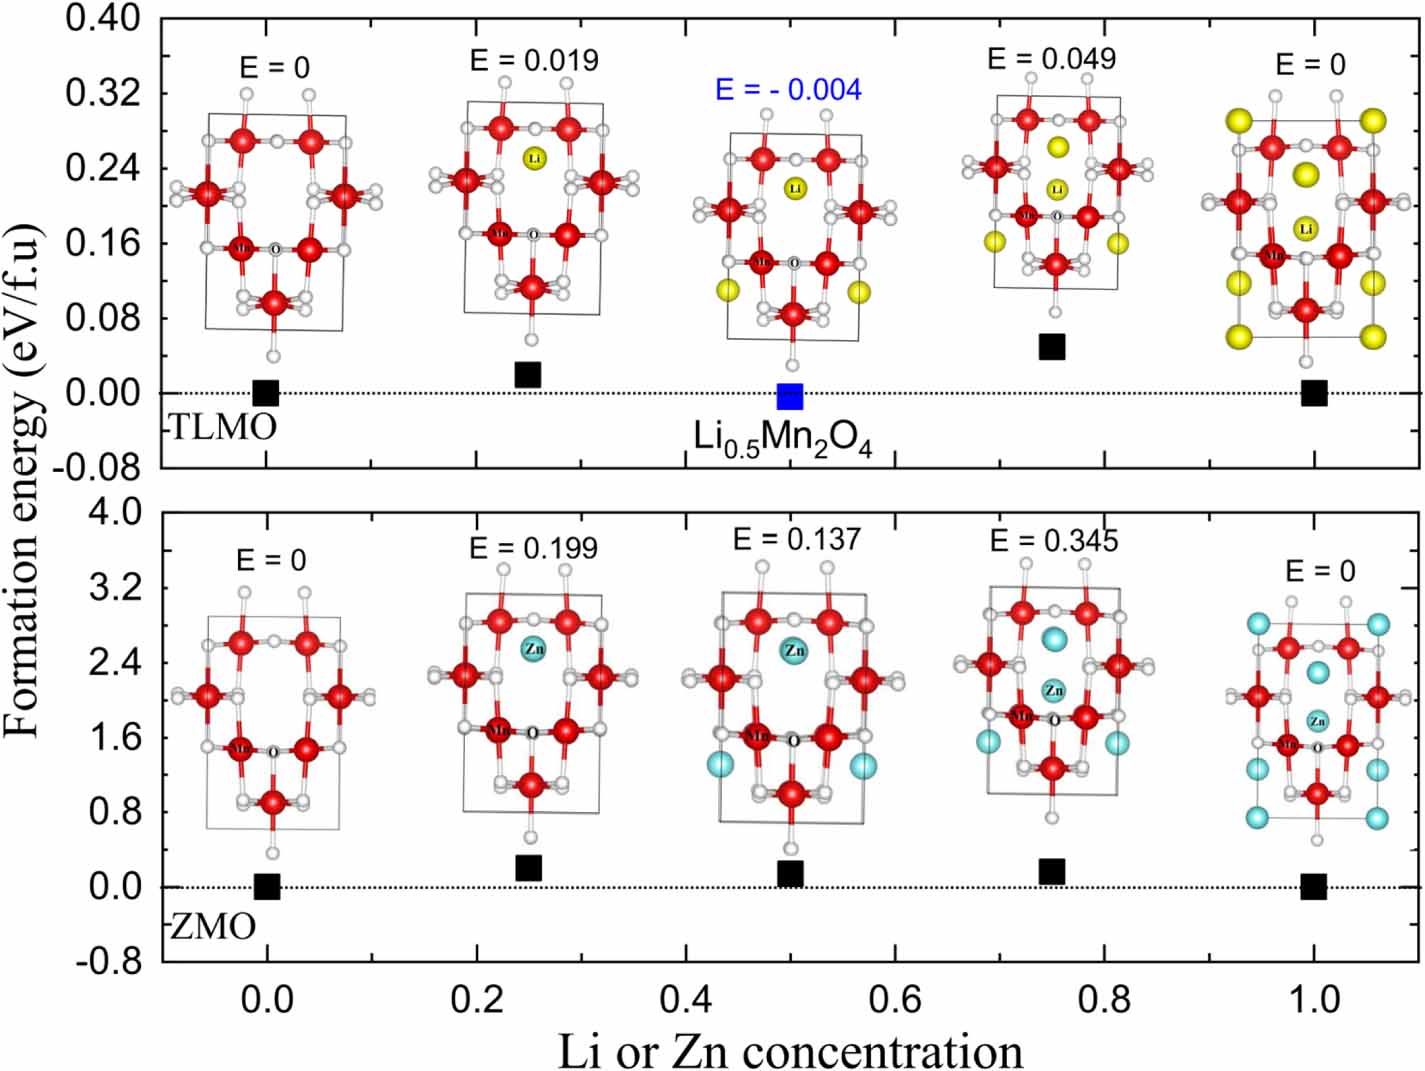
Figure 2 shows the results of the formation energies as a function of Li or Zn concentration. Among all configurations, the structures that correspond to the lowest energies in the DFT calculations are shown. The results for the ZMO formation energies show that no intermediate phases are formed during Zn extraction, since the energies are all above 0 eV. On the other hand, TLMO presents a stable intermediate phase at  (
( ). This is the only phase that lies on the lower convex hull of
  versus composition
  . A zoom of the convex hull can be observed in figure S4, where one can better perceive the formation of the intermediate phase. The TLMO follows the same pattern presented by the cubic and orthorhombic structures [41, 42], that is, a single stable intermediate phase is observed for
  . It is worth mentioning, however, that other solid phases can be formed at Li or Zn concentrations not considered by us. To analyze the intermediate phases formation for every possible concentration we would have to consider a supercell with more than 100 Li or Zn ions in the structure, which is an impractical task to be realized by DFT simulations.
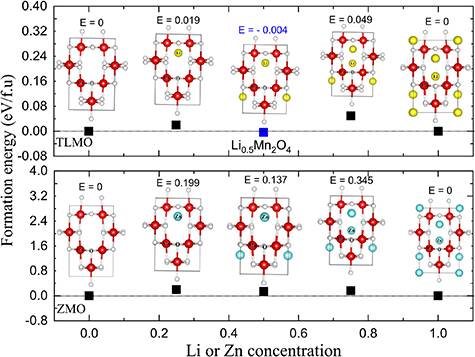
Figure 2. Formation energies of the ZMO and TLMO compounds as a function of Zn or Li concentration.
Download figure:
Standard image High-resolution imageOnce the convex hull construction is available, a piecewise voltage profile can be obtained from equations (1) and (2). The voltaic profile obtained for  is shown in figure S5. The TLMO presented a potential window of 4.05–4.06 V and an average voltage of 4.05 V. There is no experimental average voltage for the tetragonal phase of the LMO, however, voltage is not expected to change significantly with phase. In our previous work, we showed that the average voltages of the cubic phase and the orthorhombic phase of LMO are practically the same [42]. In this way, we can use the experimental average voltage value of the cubic phase (4.1 V) [43, 44] to compare with our current results. Thus, the average voltage calculated by us agrees with the experimental data very well. The TLMO voltage step value corresponded to 10 mV, being lower than the steps applied for the orthorhombic (92 mV) and cubic (80 mV) phases [42]. The experimental value of the cubic phase voltage step corresponds to 100 mV [43, 44]. The average voltage for ZMO, in turn, does not exhibit a voltage step, since we did not find any stable intermediate phases for
  concentrations. The ZMO calculated charge voltage was
  V, which is overestimated when compared to the experimental value of about
  V [8]. The TLMO and ZMO obtained theoretical specific capacity values are, respectively,
  and 224 mAh g−1.
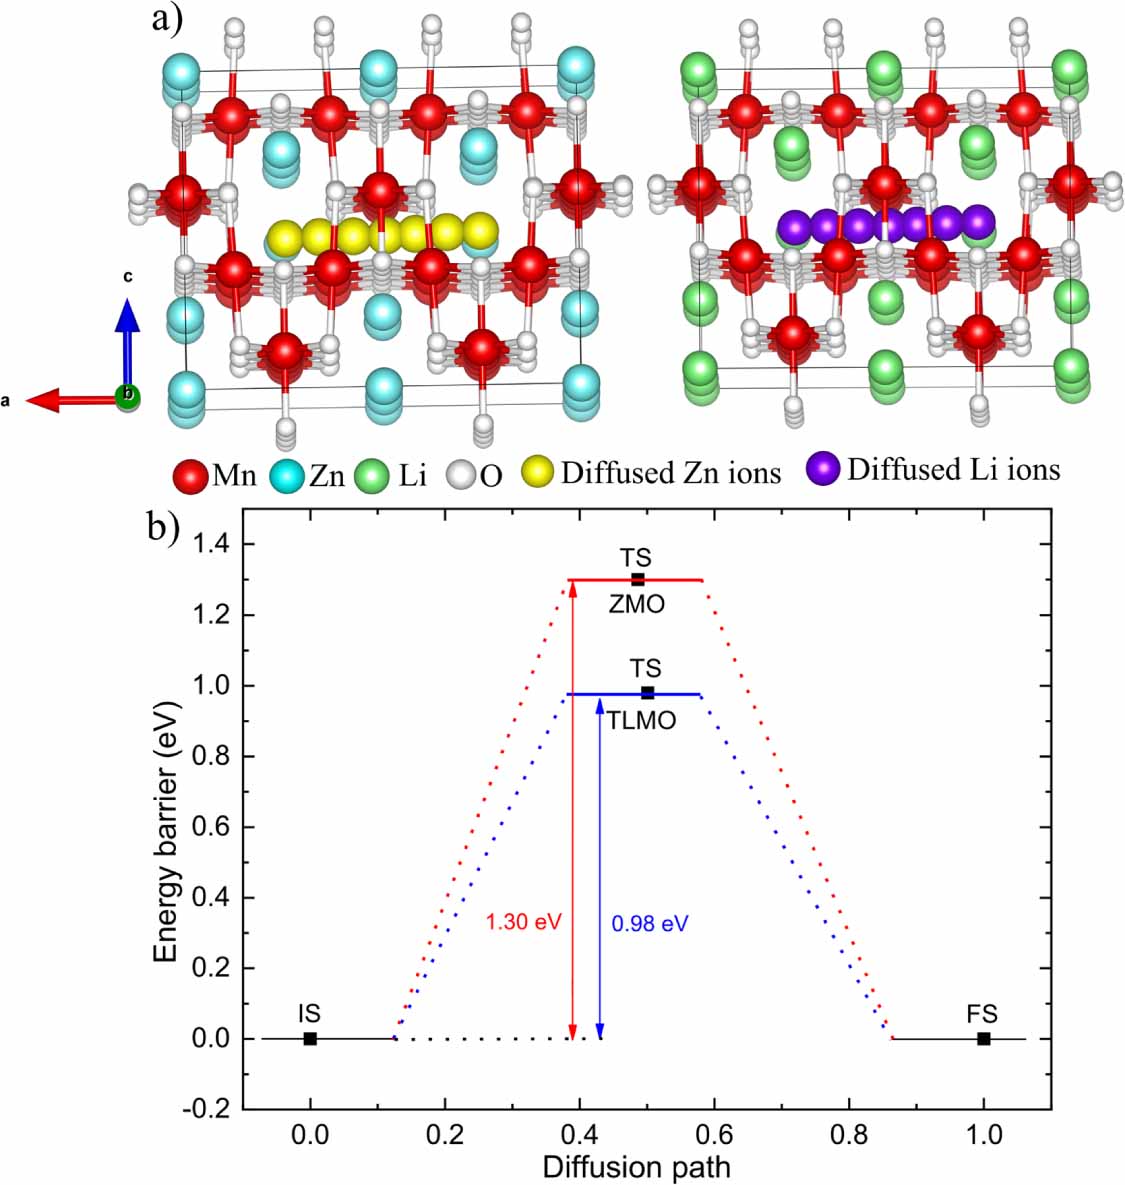
The ionic mobility of Zn2+ or Li+ ions at the cathode is another important factor affecting electrochemical performance. Figure 3(a) shows the diffusion paths of Zn2+ and Li+ ions in the ZMO and TLMO structures, respectively, and figure 3(b)) shows the results of energy barriers for Zn and Li diffusion. During the ionic diffusion, all host atoms in ZMO and TLMO were held fixed, and the energy of each step was calculated separately in the diffusion path. The diffusion barrier height was calculated as the energy difference between the TS and initial state (IS) (barrier of one reactant) [45, 46]. The ZMO and TLMO structure was completely relaxed before diffusion barrier calculations. The energy barrier for Zn2+ diffusion in the ZMO was 1.30 eV, while for Li+ diffusion in the TLMO structure it was 0.98 eV. The lower value of the energy barrier for Li was already expected since monovalent ions are better diffused, i.e. suffer less electrostatic repulsion than the divalent ions. Therefore, our results show that the TLMO presents better ionic conductivity compared to ZMO.
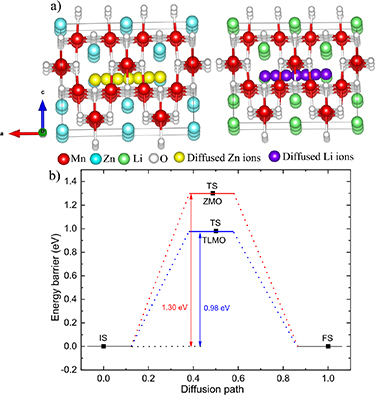
Figure 3. (a) Zn+2 diffusion pathway in ZMO (left) and Li+ diffusion pathway in TLMO (right). (b) Energy barrier for Zn and Li diffusion. IS, TS, and FS are the initial state, transition state, and final state, respectively.
Download figure:
Standard image High-resolution imageThe PDOS modifications occurring during the extraction of Zn or Li, from ZMO and TLMO, respectively, are illustrated in figure S6. We chose to present only the Mn- PDOS, since Mn is the only ion that participates in the redox process. The shapes of the eg, b2g, a1g, b1g (Mn3+), and eg, t2g (Mn4+) predominant orbitals, during Li or Zn extraction, remained similar to those corresponding to
  concentration. Small changes are expected in electrical conductivity due to variations of the band gap width in both materials. Due to a much narrower bandgap, it is expected that TLMO exhibits better electrical conductivity than ZMO.
One way to visualize the Mn redox processes, during the extraction of Li or Zn from the respective materials, is to separately analyze the evolution of the density of states of each Mn ion, as a function of the concentration variation of the extracted ions. Another simpler way is to analyze the magnetic moment of each Mn. As already discussed previously, the Mn3+ ion has four unpaired valence electrons ( ) while Mn4+ has three (
 ), therefore the magnetic moment of the Mn3+ ion should be larger than the one of the Mn4+. Accordingly, the oxidation states of the Mn ions may be identified by analyzing their magnetic moments. Following this line of reasoning, the Mn ions average oxidation state, at each concentration of Li or Zn, can be obtained to describe the redox processes. Tables S6 and S7 (SI) show the results of the oxidation process from Mn3+ to Mn4+ for
  and
and  during battery charging. For instance, for the TLMO,
  , there are 4 Mn3+ ions and 4 Mn4+ in the supercell: Mn average oxidation state = Mn3.5+. However, during the delithiation process, some Mn3+ ions are oxidized to Mn4+. At
  , i.e. for
  there are 3 Mn3+ ions and 5 Mn4+ in the supercell: Mn average oxidation state = Mn3.62+, while at
  there are 2 Mn3+ ions and 6 Mn4+, leading to an average oxidation state = Mn3.75+, and at
  there are only 1 Mn3+ ion and 7 Mn4+ in the supercell: Mn average oxidation state = Mn3.87+. Finally, for the fully delithiated TLMO, at
  only Mn4+ ions are found in the material, confirming the Mn total oxidation state from Mn3+ to Mn4+. ZMO follows the same trend of the oxidation process. The difference is that at
  , i.e. for
  , only Mn3+ ions exist in the material structure. During the Zn extraction process, some Mn3+ are oxidized to Mn4+. At
  there are 6 Mn3+ ions and 2 Mn4+, leading to an average oxidation state = Mn3.25+, whereas at
  there are 4 Mn3+ ions and 4 Mn4+ in the supercell: average oxidation state = Mn3.5+, and at
  there are 2 Mn3+ ions and 6 Mn4+, giving rise to an average oxidation state = Mn3.75+. Lastly, at
  only Mn4+ ions are found in the host matrix.
Describing the redox process by analyzing the magnetic moments is very useful in the case of simple host structures such as TLMO and ZMO. However, many cathode materials that are actually investigated have complicated compositions, such as  (NCM),
  (NCA),
  (
( ,
,  , NFA),
  (NATM), and
  (NFM). In this case, the analysis of which of these ions participate in the redox process during battery charging/discharging is a complicated task and, therefore, requires a more precise technique.
X-ray absorption spectroscopy (XAS) is a powerful experimental technique for detailed information on the electronic structure and its connection to oxidation state and crystalline environment, and hence is an ideal tool for mapping the redox process in battery materials. The XAS spectrum can be separated into x-ray absorption near-edge structure (XANES) and extended x-ray absorption fine structure (EXAFS) spectroscopy. The local atomic environment around the absorbing redox ion can be determined by EXAFS, while XANES can be used to identify the valence state [47, 48]. Computer simulations have become a very effective method for visualizing XANES spectra. Currently, ab initio calculations are being used to describe the redox process of various cathode materials [47, 49–51]. In particular, the WIEN2k code has been used to calculate the transition metal K-edge XANES spectrum with high precision [47, 49, 51]. From the analysis of this edge, it is possible to characterize the redox process (oxidation/reduction) and the changes in the electronic properties of the material during battery charge/discharge.
In the present work, we used the WIEN2k code to calculate the Mn K-edge XANES spectrum during battery charging. The theoretical spectrum, calculated for the  concentration of Li or Zn, in the respective TLMO and ZMO compounds, is shown in figure 4(a)). In all calculations, the core-hole effect was taken into account, that is, one electron was removed from the 1 s orbital of the Mn ion and placed at the bottom of the conduction band that approximately corresponds to the final state of the x-ray absorption process. These calculations were performed in a supercell containing 112 atoms (2 × 2 × 1). Except for the pre-edge, which includes electric dipole-forbidden transition of a 1 s electron to an unoccupied 3d orbital, the Mn K-edge XANES spectrum was generated by dipole-allowed transitions from the 1 s electron of Mn to the empty bands above the Fermi energy. The peaks above the pre-edge region are attributed to the dipole-allowed
  transition. Both the pre-edge region and the other main peaks of the Mn K-edge spectrum in the TLMO are shifted to higher energies when compared to the Mn K-edge spectrum in the ZMO. This is because the average valence of Mn in TLMO is 3.5+ while the average valence in ZMO is 3+. The higher the valence, the more shifted towards higher energies the spectrum will be.

Figure 4. (a) Theoretical Mn K-edge XANES spectra and the Mn- orbital PDOS for TLMO and ZMO. (b) Calculated Mn K-edge XANES spectra at Li or Zn concentrations of
  . (c) Comparison of the experimental Mn K-edge XANES spectra and the calculated ones for
  .
.
Download figure:
Standard image High-resolution image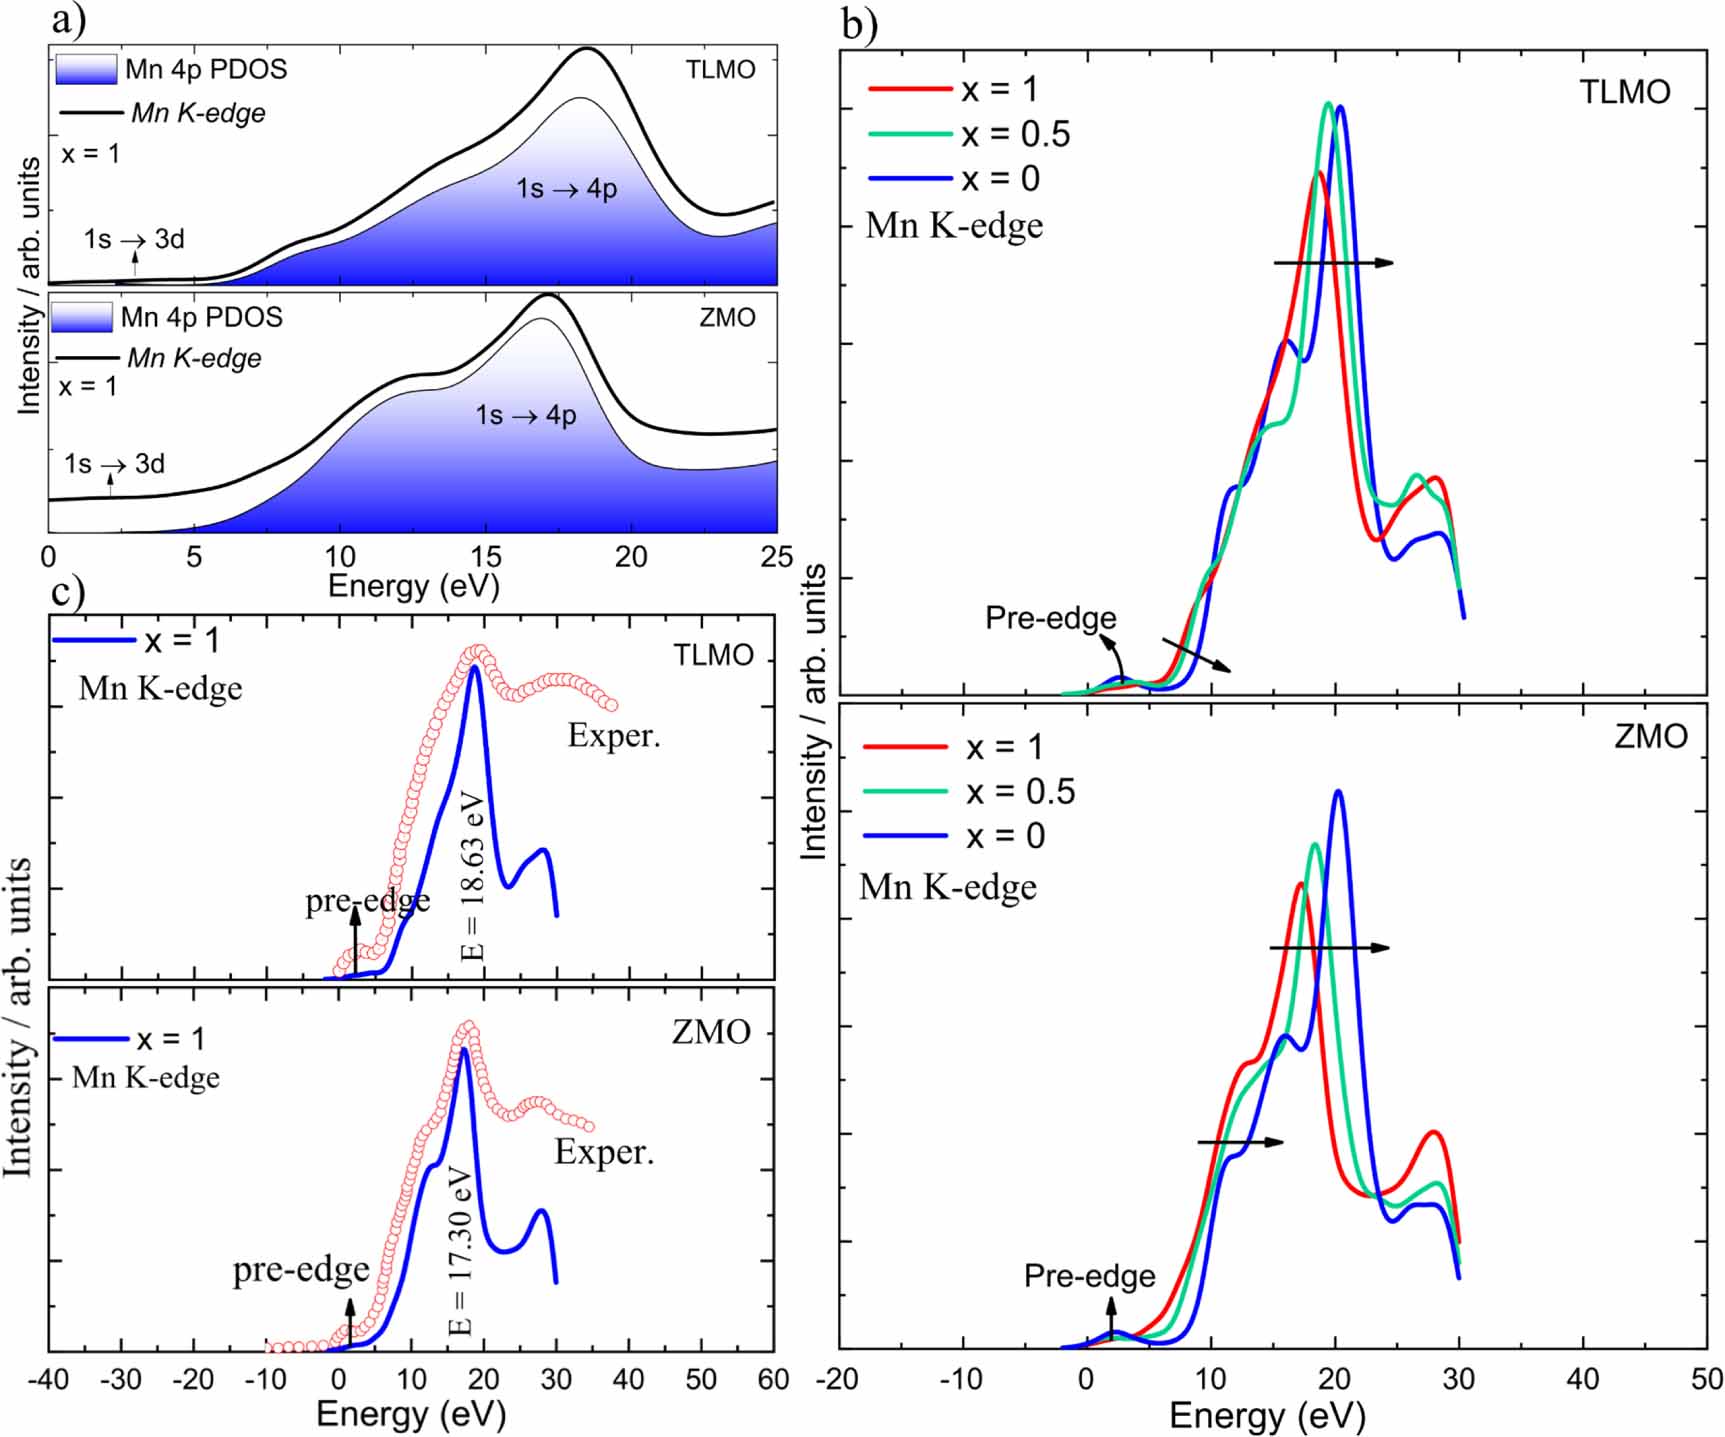
The theoretical Mn K-edge XANES spectra for TLMO and ZMO, calculated for the concentrations of Li or Zn at  , are illustrated in figure 4(b)). In general, the spectra are similar, both being shifted to higher energies during the extraction of Li or Zn due to the increase of the Mn oxidation state. The absorption edge shift indicates that the amount of Mn4+ ions increase as Li or Zn is extracted. This means that Mn3+ ions are being oxidized to Mn4+, precisely as it was predicted by analyzing the oxidation process via the magnetic moment of Mn. Mn4+ are more strongly bonded to the oxygen atoms and require more energy to be excited and this fact causes the shift of the absorption edge to higher energies.
To show that the results presented here accurately describe the Mn K-edge XANES spectra, we compare in figure 4(c) the obtained results for the  concentration with experimental data available in the literature [18]. As the XANES spectra determined by WIEN2k are calculated for a much lower energy range than that considered in the experiment [47, 49, 51], we have two options: to adjust the experimental energy range to the theoretical one or to adjust the theoretical energy range to the experimental one, and we chose the first option. Despite this adjustment, the band shapes must be equivalent if the theoretical results provide a good representation of the experimental data. Figure 4(c) shows that our results for the Mn K-edge XANES spectra align well with the experimental ones for
  . All main peaks determined theoretically are in concordance with those observed experimentally. This fact demonstrates that the electronic structures of the materials have been accurately calculated.
4. Discussion and conclusions
We performed a first principles investigation within the DFT framework to elucidate significant aspects of the structural, electronic, magnetic, electrochemical, and spectroscopic properties of ZnMn2O4 (ZMO) and LiMn2O4 (TLMO) compounds as cathode active materials for Zn-ion and Li-ion batteries, respectively. We find that the theoretical results are in good agreement with available experimental data and that they offer predictive insights where experimental results are not available. Particularly, the optimized lattice parameters of ZMO and TLMO, correspondingly without Zn or Li deficiency, are fully consistent with experimental data. Furthermore, the values found for the band gap width and Mn ions magnetic moments, for both materials, corroborate with the experimental data. Additionally, our results confirm that the ZMO most stable magnetic ordering is the AFM alignment, in agreement with experimental findings. We also discovered that the TLMO ground state presents FM ordering and that its band gap width is narrower than that of ZMO, indicating that TLMO has better electrical conductivity than ZMO.
Additionally, regarding the alterations in ZMO and TLMO properties resulting from the gradual extraction of Zn or Li extraction, respectively, the ZMO volume contraction was greater than that of the TLMO one during the battery charging simulation. We were also able to infer that not extracting all the Zn or Li ions, from the corresponding host materials, is an excellent manner to improve the materials' structural properties during cycling. Formation energy calculations showed that a TLMO stable intermediate phase is formed at  . In turn, no ZMO stable intermediate phase was formed at all Zn concentrations considered. The redox processes were correctly described by three distinct analyses: electronic density of states, Mn ions magnetic moments, and core x-ray spectroscopy. These analyses correctly described the Mn oxidation states during the Zn or Li extraction from the ZMO and TLMO compounds, respectively. The experimental Mn K-edge XANES in ZMO and TLMO at
  are well reproduced by the calculations described here. TLMO presented a lower energy barrier for diffusion than ZMO. In our theoretical analysis, it is evident that TLMO has advantages over ZMO for use as an active cathode material since it presents smaller volume contraction during battery charging, better electrical conductivity, and better ionic conductivity. We hope that our theoretical insights will stimulate further research and lead to experimental studies that can confirm or refine our predictions.
Acknowledgments
H M P, L V C A, A B K and O M S acknowledge support from FAPESP (Project 2022/10095-8); ABK and OMS acknowledge FAPESPA; L V C A, H M P, A B K, M V L and O M S acknowledge support from CNPq and CAPES, Brazil. A B K acknowledges the INCT of Materials Informatics, and the INCT of Spintronics and Advanced Magnetic Nanostructures. O E acknowledge support from the Wallenberg Initiative Materials Science (WISE) funded by the Knut and Alice Wallenberg Foundation as well as the Swedish Research Council (VR), the European Research Council (854843-FASTCORR), eSSENCE and STandUP. The calculations were performed at the computational facilities of the CENAPAD-UNICAMP/LNCC-Santos Dumont (Brazil). O E and C M A acknowledges support from the Knut och Alice Wallenberg (KAW) foundation, the Swedish Research Council (VR), the Foundation for Strategic Research (SSF), the Swedish energy agency (Energimyndigheten), eSSENCE, STandUP for energy, and the ERC (synergy Grant FASTCORR).
Data availability statement
All data that support the findings of this study are included within the article (and any supplementary files).
Conflict of interest
The authors declare no conflicts of interest.
Supplementary information Here we present detailed results of the first principles calculations of the ZnMn2O4 and LiMn2O4 compounds. Also, we provide Tables comparing the efficiencies of ZnMn2O4 and LiMn2O4 with other materials.(4.4 MB DOCX)