

Abstract
We study the coherence properties of continuum generation in YAG crystals seeded by 180 fs pulses at 1035 nm when the driving beam exhibits small fluctuations of the spatial phase. The relative stability of the continuum spectral phase is first assessed as a function of the driver wavefront aberrations. Furthermore, we evidence and quantify a coupling mechanism between these fluctuations and the spectral phase of the continuum. The coupling coefficients increase with the spectral broadening and are also unexpectedly large (up to tens of rad/rad at  750 nm). Experimental evidence supports that longitudinal shifts of the position of the filament within the crystal are responsible for such strong effects.
Export citation and abstract BibTeX RIS

Original content from this work may be used under the terms of the Creative Commons Attribution 4.0 license. Any further distribution of this work must maintain attribution to the author(s) and the title of the work, journal citation and DOI.
1. Introduction
Third-generation femtosecond sources rely on three-wave mixing processes, such as optical parametric amplification and frequency difference generation (DFG). They enable to deliver short optical pulses with few-cycle pulse duration, high-average power, tunability, and, often, shot-to-shot reproducible electric field i.e. a stabilized carrier-envelope phase (CEP) [1]. This property is particularly sought after to drive the generation of isolated attosecond pulses through high harmonic generation [2]. Most often, CEP stability arises from a difference-frequency stage pumped and seeded by pulses sharing common phase fluctuations [3]. Among the demonstrated schemes is the frequency DFG between frequency components within a single ultra-broadband pulse (intra-pulse DFG) or between two pulses at different wavelengths (inter-pulse DFG). In the latter case, the two driving pulses are usually derived from the pump laser, one having been spectrally broadened and spectrally filtered. The most widely used broadening mechanism is the filamentation of sub-picosecond pulses at 1030 nm in bulk crystals, such as YAG [4], resulting in a white light generation (WLG). The implicit assumption is made that the broadening process do not add any stochastic contribution to the CEP noise. To date, even if the most stable systems based on self-seeded DFG report CEP noises as low as several tens of mrad rms [5, 6], the origin of the remaining CEP noise remains an open question. As this noise is essentially shot to shot, the broadening stage is likely to be a major contributor, given its high level of nonlinearity and the potential contribution of induced plasma [7]. It is therefore essential to characterize the intrapulse coherence of supercontinua generated by filamentation.
In a recent study, we have proposed a variant of the Bellini–Hänsch interferometer, coined as double white-light interferometer, to experimentally characterize the intrapulse coherence of a supercontinuum [8]. Complementing the few previous studies, these measurements were quantitative and frequency-resolved [9, 10]. We showed that (i) the WLG does indeed add stochastic spectral phase noise, (ii) the noise level depends on the input pulse energy as well as on the length and position of the nonlinear crystal, even if both stable and coherent WLG can be achieved on a lenient range of parameters, (iii) intensity-to-phase coupling coefficients depend on the WLG operating range. The proposed setup is thus an excellent tool for studying the decoherence resulting from the alteration or fluctuation of various experimental parameters crucial to WLG.
The work presented here builds upon this previous study and focuses on the contribution of spatial aberrations of the driver optical wavefront to the intrapulse coherence. As filamentation is intensity-dependent and happens at the ionization threshold, the spatial phase of the pump beam is expected to have a direct impact on WLG [11]. In addition, high-power and/or high-energy lasers tend to exhibit drifts or fluctuations of their wavefront under the effect of thermal and/or nonlinear phenomena either in power amplifiers or during beam transport. To date, only the spatial properties of WLGs driven by spatially structured beams have been studied [12, 13]. Yet, fluctuations or drifts of the wavefront could alter the intra-pulse coherence as much as pulse-to-pulse energy fluctuations.
In order to address this question, the former double white-light interferometer is modified by the addition of a phase-only spatial light modulator (SLM) in the test arm of the interferometer. The effects of low-spatial-frequency wavefront distortions on the intra-pulse coherence of the subsequent WLG are then studied. Specifically, we assess how the phase noise of the supercontinuum is affected by (i) a constant amount of spatial phase and (ii) spatial phase increments to mimic wavefront fluctuations of weak amplitude. From the latter, we extract spatial-to-spectral phase coupling coefficients for various optical wavefront aberrations. In order to interpret the high transfer coefficients, we provide experimental evidence of a longitudinal shift in the starting point of the filament inside the crystal.
The paper is organized as follows. Section 2 presents the experimental setup. Sections 3 and 4 are dedicated to the spatial phase study. Section 5 provides quantification of the filament displacement as a function of beam focusing conditions.
2. Experimental methods
The experimental setup, a Mach–Zehnder interferometer featuring WLG in each arm, is schemed in figure 1. The pump laser is a regenerative CPA system (Pharos, light conversion) delivering pulses at  1035 nm with a pulse duration of
  180 fs FWHM. The beam diameter is collimated to 4.5 mm (1/e2), with a beam quality corresponding to M2 = 1.1. For these experiments, the repetition rate is set at 1 kHz and
  9 uJ are sampled from the available
  1 mJ of pulse energy. The interferometer is composed of two arms, a reference arm and a test arm. Each arm includes a f = 150 mm focusing lens (NA 0.015 [11]), a 6 mm-long uncoated YAG crystal and a f = 50 mm achromatic collimating lens. The generated supercontinuum typically extends between 600 nm and 1500 nm. The relative group delay between the test and reference arms can be adjusted via a reflective delay line and the temporal offset is set to
  . The beams are then recombined and focused on a 450–1100 nm Silicon spectrometer (resolution of 0.26 nm, integration time of 1.1 ms) for the short-wavelength range and a 1000–2500 nm InGaAs spectrometer (resolution of 3.27 nm, integration time of 1 ms) for the long-wavelength range.
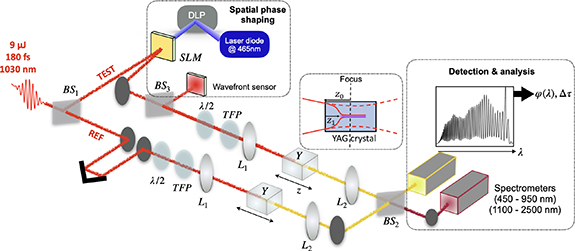
Figure 1. Diagram of the interferometer. REF and TEST refer to the reference arm and the test arm, respectively. BS1: 1030 nm 50/50 beam splitter, BS2: low GDD 600–1500 nm 50/50 beam splitter, BS3 1030 nm beam sampler, L1: focusing lens f = 150 mm, L2: achromat focusing lens f = 50 mm, Y: YAG crystal, TFP : thin film polarizer. The spatial phase shaping module includes the SLM (spatial light modulator), the DLP (digital light processing chip) to program the SLM and a wavefront sensor. A zoom on the filament generation in the YAG crystal is shown as an insert. z0 refers to the distance between focal plane and front face of the YAG crystal. z1 refers to the distance between front face of the YAG crystal and starting point of the filament. Two spectrometers are used to monitor the spectral interferogram over the full bandwidth.
Download figure:
Standard image High-resolution imageA discrete Hilbert transform [14] of each spectrogram provides the spectral phase difference,  , between the reference arm and the test arm. The slope of
  is the temporal offset between the WL pulses,
  , fixed as
  for balanced WLG in both arms. In the considered spectral range, the relative phase stability is assessed for all the newly generated wavelengths by retrieving the standard deviation of the phase of the spectral fringes over 1000 single shot consecutive spectra. The standard deviation of the phase at each wavelength,
  , is then used as a metric to assess the intrapulse coherence [8]. Without crystals, the typical measured standard deviation is 5 mrad at 1030 nm, which provides a ground floor for the phase noise measurement. For balanced WLG in both arms, the rms phase deviation is
  70 mrad, which is an expected increase due to the addition of nonlinearity. In our previous study, the intrapulse coherence was simultaneously measured for spectral ranges on both sides of the pump wavelength, i.e. short and long wavelength range, and it was found that phase fluctuations were similar, or weaker in the long-wavelength range. Consequently, the coherence study is restricted to the short wavelength range.
Various parameters can be tuned in the test arm. As in our previous publication, pulse energy and focusing conditions can be detuned with respect to the balanced situation, thanks to a waveplate-polarizer couple and a translation stage to move the YAG crystal relatively to the focus. Furthermore, to test the influence of the spatial phase, the test arm includes a home-made spatial phase modulator (SLM). The SLM modifies the wavefront by exploiting the thermotropic character of a birefringent thick nematic liquid crystal layer. Specific details on the SLM design and performances can be found elsewhere [15, 16] and enough is to say that the temperature of the device is locally addressed through absorption of an amplitude-shaped blue laser diode (writing beam). As the birefringence of the liquid crystal layer depends on the temperature [17], the amplitude shaping of the blue writing beam is converted into spatial phase shaping of the reading beam. A digital light processing chip (DLP, DLP® LightCrafter™ E2010-LC - PCBA) ensures amplitude shaping of the writing beam. The SLM plane is then relay-imaged on a Shack–Hartmann wavefront sensor (HASO4, Imagine-optic) so as to measure the introduced spatial phase, with 0.01 λ resolution.
The Zernike polynomials are commonly used to describe the low spatial-frequency wavefront distortions, as the first polynomials correspond to the principal aberrations occurring in optical systems [18]. High-power pump lasers may exhibit divergence modifications due to thermal lens fluctuations (focus), residual astigmatism, coma, trefoil and/or spherical aberration. Applied wavefront defects are then chosen among the second, third, and fourth order Zernike polynomials. Figure 2 shows a gallery of the experimental wavefronts. Each of them is composed of several optical aberrations, but presents a dominant one, labeled as follows : focus (i), coma (ii), trefoil (iii) and spherical aberration (iv). Following the degree of the associated Zernike polynom, focus is a second-order aberration, coma and trefoil are thir-order and spherical aberration is fourth-order.
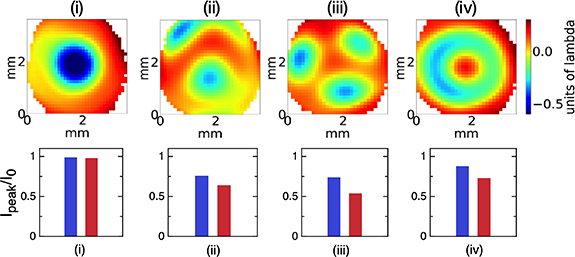
Figure 2. Top: Shack–Hartmann measurements of the spatial phase induced by the SLM in the four considered configurations. Bottom: relative peak intensity calculated for the extreme values of the applied phase variation for measurement range I (see text, blue (resp. red) bars correspond to the minimum (resp. maximum) applied phase).
Download figure:
Standard image High-resolution image3. Phase noise for a stable wavefront defect
The first objective is to assess the (de)coherence of the WLG as a function of the type of wavefront defect. A programmable amount of spatial phase is added in the test arm, prior to the focusing lens. The shape of the wavefront is kept constant during the measurement (i.e. same Zernike polynomial) but the peak to valley (PtV) of the spatial phase is varied. For each configuration ((i)–(iv)), the PtV is scanned within the range I specified in table 1, typically from 0.2 λ to 0.6 λ.
Table 1. Correspondence between SLM configuration (figure 2), dominant aberration and applied spatial phase variation (PtV, range I, see text). The relative peak intensity is calculated for the extreme values of this phase variation.
| SLM configuration | (i) | (ii) | (iii) | (iv) |
|---|---|---|---|---|
| Dominant defect | Focus | Coma | Trefoil | Spherical |
| PtV range I (unit of λ) | 0.12–0.35 | 0.27–0.58 | 0.44–0.62 | 0.39–0.61 |
 (PtV range I) (PtV range I) | 0.99I0–0.98I0 | 0.76I0–0.64I0 | 0.74I0–0.54I0 | 0.88I0–0.73I0 |
To assess the degradation of the focal spot due to imperfect wavefront by comparison with a flat spatial phase, we calculate the peak intensity with and without spatial phase degradation. We define :


where  is the beam Gaussian amplitude,
  is the spatial phase, and FT the Fourier Transform. I0 is the initial peak intensity (i.e. without spatial phase) and
  the modified peak intensity. The calculated relative peak intensity is reported in table 1 and figure 2.
For the specific case of a simple focus defect, the peak intensity remains nearly unchanged since it is calculated based on the optimal focus. In practical terms, this corresponds to a shift of the focal point in the YAG crystal along the propagation direction. However, for other aberrations, although applied wavefront degradations are kept moderate so as to preserve the filamentation process, they still cause significant alteration in the pump peak intensity at the focal point.
The experimental protocol stands as follows. The parameters of WLG (seed energy and crystal position) are optimized for an average value of the introduced spatial phase amount, in the middle of the measurement range I. The spatial phase is then incremented from the lowest to the highest PtV value, with a dozen of steps. For each spatial phase setting, a series of single-shot spectra is acquired and the relative spectral phase is extracted. The shot-to-shot phase fluctuations at 750 nm are then analyzed and a noise figure is computed.
Figure 3(a) shows the raw phase at 750 nm with no wavefront defect and wavefront defect (configuration (iv), PtV = 0.6 λ) applied. The rms phase deviation is, respectively, 73 mrad and 42 mrad. Figure 3(b) shows the measured stabilities obtained for the entire measurement range I, for all aberrations. For focus (i) and spherical aberration (iv), the phase noise remains close to the nominal value, i.e. with no phase defect. Coma (ii) and trefoil (iii) are slightly higher than σ0, about 20% higher, which is still very low. As a preliminary conclusion, we found that the phase noise of the WLG is not significantly modified by wavefront aberrations of low order and moderate amplitude. This indicates that WLG remains deterministic and does not introduce additional stochastic phase noise for this level of spatial aberrations.
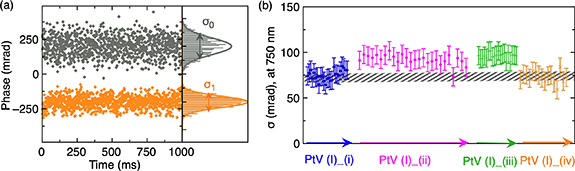
Figure 3. (a) Raw phase measured at 750 nm without (grey) and with (orange) applied spatial phase on the SLM (configuration (iv), PtV = 0.6 λ) with associated standard deviation (respectively σ0 = 73 mrad and σ1 = 43 mrad). (b) Rms phase deviation at 750 nm for the measurement range I for all aberrations. The hatched area is the reference value σ0.
Download figure:
Standard image High-resolution image4. Spatial-to-spectral phase coupling
This result has motivated the second part of the study, which focuses not on the phase noise (i.e. standard deviation) but on the phase drift (i.e. average value) as a function of the defect order and amplitude. The aim is to simulate low-amplitude spatial phase fluctuations, which are likely to occur in high-power lasers wavefronts, and to estimate the resulting phase shift. To quantify the strength of the phase drift with the amplitude of the phase defect, we compute the spatial-to-spectral coupling coefficient  , defined as the derivative of the spectral phase with respect to the applied PtV:
ϕ is the measured spectral phase, while φ is the introduced spatial phase amount. For the following, λ0 = 750 nm, which is approximately the average wavelength of the spectrum generated in the visible range during the process.
The experimental protocol is as follows. Over a 10 s measurement, the amplitude of the phase defect is incremented every 350 ms using the DLP to modulate the flux of the blue writing beam. The PtV spatial phase excursion is displayed in table 2 (range II). It can be noted that the scanning range is much smaller than in the previous experiment: this range was chosen to insure the spectral phase never jumps by more than π between two successive increments, to allow the phase retrieval algorithm to unwrap the phase correctly. Over this measurement range, the far-field beam profile of the pump shows barely noticeable modifications (figure 4(d)). The spatial phase increments are below the phase resolution of the HASO4 and a direct measurement of the wavefront throughout the experiment would not yield a precise value of the induced spatial phase. To circumvent this resolution issue, the wavefront is measured only at the extrema of the measurement range II and we rely on the linearity of the SLM to interpolate the intermediate values. Even if the phase of the SLM has been shown to be strictly proportional to the optical power of the blue writing beam in our experimental range, we note that the increments of the latter are not exactly equal. This is because the DLP unit is not able to vary continuously the optical flux for such low steps.
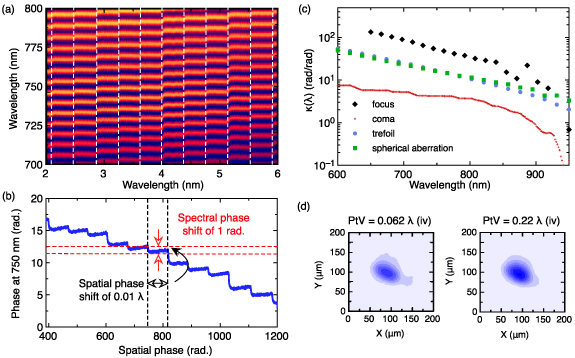
Figure 4. (a) Spectrogram zoomed around 750 nm for aberration (iv). The vertical dashed white lines represent an increment in spatial phase (see text). (b) Extracted phase at 750 nm from figure (a). (c) Measured spatial-to-spectral phase coupling coefficient  (in log-scale) for the four studied aberrations as a function of wavelength. d: Far-field pump profile at the extrema of the measurement range II for aberration (iv).
Download figure:
Standard image High-resolution imageTable 2. Correspondence between SLM configuration (figure 2), dominant aberration and applied spatial phase variation (PtV, range II, see text).
| SLM configuration | (i) | (ii) | (iii) | (iv) |
|---|---|---|---|---|
| Dominant defect | Focus | Coma | Trefoil | Spherical |
| PtV range II (unit of λ) | 0.019–0.058 | 0.05–0.15 | 0.029–0.25 | 0.062–0.22 |
Figure 4(a) shows the experimental spectrogram, zoomed between 700 nm and 800 nm, for aberration (iv). This spectrogram shows 12 increments for a total spatial phase excursion close to 900 mrad. The spatial phase spans from 390 mrad (0.062 λ) to 1300 mrad (0.22 λ) with increments around  70 mrad (0.01 λ), indicated by the vertical black dotted lines. The phase shift is clearly visible at each increment. Figure 4(b) shows the extracted spectral phase value at 750 nm over this whole range. The total excursion of the spectral phase is more than 15 rad. For each step of
  70 mrad of spatial phase, the spectral phase is increased by
  1 rad. The ratio of these two quantities is the spatial-phase-to-spectral-phase coupling coefficient
  . In this case, κ = 16 at 750 nm for aberration (iv), meaning that a wavefront perturbation by the order of magnitude of the HASO resolution disturbs the spectral phase by 1 rad. This magnitude of fluctuations is highly detrimental to any subsequent phase-sensitive process such as temporal compression or CEP stabilization.
Figure 4(c) shows  for the four aberrations. As observed in our previous study [8], the spectral phase of the lower wavelengths is more sensitive to spatial phase fluctuations. Focus (i) is the lowest order aberration (second order) and has the largest transfer coefficients : κ > 50 at 750 nm. Trefoil (iii) and spherical (iv) have similar coefficient values despite spherical being a fourth order aberration and trefoil being a third order aberration. It indicates that the transfer coefficient tends to decrease with the order of the aberration, except for coma (ii), which is also a third order aberration, but shows the smallest κ value (more than ten times lower than focus).
As discussed in the next section, we interpret these results as evidence that the filament is generated at different longitudinal positions in the crystal, depending on the driver wavefront [19].
5. Discussion
A first explanation to the high values of  measured in the previous section could be based on phase-amplitude coupling mechanism, induced by changes in peak power due to modifications of spatial phase. However, the latter are very small, and the transfer coefficient values reported by [8, 10] (a few hundreds of mrad per
 of input power) do not explain the observed large phase shifts.
To provide a physical explanation, we have then performed an additional experimental study. This study consists in monitoring the relative delay between the WL pulses,  , as a function of focusing conditions (i.e. position of the YAG crystal), for the two spectral ranges. The position of the crystal relatively to the focus is defined by z0, shown in figure 1. z0 = 0 mm corresponds to the front face of the YAG crystal being at the focal position. The evolution of
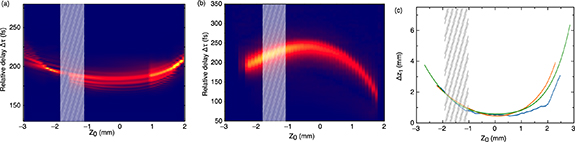
  with z0 is plotted in figures 5(a) and (b). The delay dependencies have an opposite behavior in both wavelength ranges. In the short-wavelength range, it decreases with position and reaches a minimum before increasing whereas it increases and reaches a maximum before decreasing in the long-wavelength range. The extremum is reached for a crystal position of z0 = 0 mm.
Figure 5. Moving the YAG crystal from  mm to
mm to  3 mm. (a) and (b) Delay between the two arms in the (a) short-wavelength range and (b) long-wavelength range. The hatched are indicates the working point for WLG. (c) Calculation of the z1 position as a function of the z0 position from the delay curve in the (blue) short-wavelength range and (orange) long-wavelength range. Simulation of the z1 position as a function of the z0 position using ABCD matrix formalism (green curve).
Download figure:
Standard image High-resolution image
The shape of the delay curves can be explained by the variation of the starting point of the filament (Kerr focus z1, defined in figure 1) in the YAG crystal. The group delay in YAG is higher in the visible than at the driving wavelength and lower in the infrared than at the driving wavelength so displacement of this point can cause such a delay shift. The moving of the starting point of the filament,  , can be simply calculated from the delay variation by dividing the delay by the difference in group index between the driving laser (
 ) and the considered wavelength range (
 ):
):

c is the speed of light. The group delay in YAG at the driving wavelength is  fs mm−1. Taking 700 nm and 1400 nm as the central wavelengths for both wavelengths ranges gives the following respective group delays
  fs mm−1 and
  fs mm−1. The calculation of the Kerr focal in the crystal (z1) deduced from the experimental delay curves is shown in figure 5(c). The retrieved starting point of the filament is similar in both wavelength ranges.
On the other hand, the starting point of the filament can be simulated using a simple numerical model based on ABCD matrices. The YAG crystal is considered as a second lens and the combined focus position is simulated. The focal length of the YAG crystal can be defined in multiple ways [20]. The choice here was to follow the derivation done by Marburger in 1975 in [21]. The focal length of the Kerr medium is then:
where a is the beam radius, P is the peak power and  is the critical power. Simulating the
  position as a function of z0 gives the results shown in figure 5(c). The simulated value of
  and the value retrieved through the experiment have a perfect qualitative agreement and the order of magnitude is the same. The model fits well despite its simplicity and the fact that material dispersion is ignored and the group index of the YAG is kept constant even though the spectral shape may change.
As was reported before, the input face of the YAG crystal placed slightly before the focal point of the driving pulse favors the generation of a broad and flat spectrum in the visible [8, 11, 19]. In practice, the working point for WLG is, here,  mm. In this area, the phase-shift calculated at 750 nm from figure 5 is as high as 1.5 rad. per 1 µm shift in crystal position.
From these measurements, we can draw several conclusions. (i) The retrieval of the relative delay between the generated WL pulses is a simple experimental mean to determine the variation of the starting point of the filament inside the crystal [19]. (ii) More importantly, we have shown that the filament moves significantly in the crystal, depending on the focusing conditions. Thus, any modification of the driving beam at the focal point results in a large phase shift, due to the propagation difference in the crystal.
These findings shed light on the influence of the driving beam's spatial phase on the phase stability of the WLG process. Let's consider the focus case (i). It is obvious that a change in wavefront curvature modifies the focusing position in the crystal, and thus changes the z1 value as reported in figure 5. A simple geometrical optics calculation can be used to estimate the focal point shift introduced by the SLM phase variation (configuration (i)). An optical path difference variation of 19 nm and 58 nm across a 4 mm diameter beam corresponds to an equivalent focal length of around 840 m and 280 m respectively. This is enough to shift the focus longitudinally by several tens of µm, which is perfectly compatible with the measured phase shift.
Calculation of focus shift by several µm were reported for spherical aberration [22], that is one order of magnitude lower than focus, and is in good agreement with the κ ratio measured in configurations (i) and (iv). We can assume that the same phenomenon occurs for the other aberrations: the best focus moves as a function of the associated phase, all the more for a low order of spatial phase.
To summarize, even small spatial phase variations lead to a change in focusing conditions, which in turn shifts the filament's starting point (figure 5(c)). A significant phase shift is then undergone by the WL pulse, simply due to the variation in the filament's propagation length in the crystal. We therefore consider that, although wavefront fluctuations are not necessarily deleterious to the filamentation mechanism itself, they do have a significant impact on the spectral phase, and hence on any subsequent application requiring shot-to-shot stabilization of this phase (compression, intra-pulse DFG, CEP stabilization, waveform synthesis) [23].
6. Conclusion
To conclude, a double white-light interferometer, a variant of the Bellini–Hänsch interferometer, has enabled to quantify how wavefront distortions of the pump laser affect the conditions of WLG by filamentation in YAG crystals ( 180 fs,
  1035 nm). This was achieved by quantifying the stochastic fluctuations of the spectral phase of the newly generated wavelengths. Two distinct experiments were conducted in this work. The first ones quantifies the intrapulse coherence (i.e. phase noise) of the WLG as a function of the wavefront aberration. We found that a distorted wavefront has little to no effect on the intrapulse coherence of the generated WL. The second experiment assesses the drift of the spectral phase as a function of the amplitude and order of spatial aberrations. We found that this drift is significant and we measured the spatial-to-spectral phase coupling coefficients as a function of wavelength. The order of magnitude of theses coefficients demonstrates that shot-to-shot wavefront variations well below the dynamic of wavefront sensors may lead to radian-scale variations of the spectral phase. These findings are supported by an additional experimental dataset, indicating that the filament moves significantly in the crystal, depending on the focusing conditions. Thus, any modification of the driving beam at the focal point results in a large phase shift, due to the propagation difference in the crystal. In the context of WLG-based CEP-stable sources, our results suggest that unresolved shot-to-shot fluctuations of the wavefront may induce a loss of intrapulse coherence and eventually contribute to the CEP noise in self-seeded DFG stages. Spectral phase fluctuations may also affect ulterior pulse compression. Although WLG conditions are different, similar qualitative behavior can be expected from the WLG stage in f-to-2f interferometers and wavefront fluctuations could also add an additional significant CEP measurement noise. Similar qualitative behavior can also be expected from filamentation in gas. These conclusions highly motivate the development of single-shot, high repetition rate and high-dynamic-range wavefront sensors.
Data availability statement
The data cannot be made publicly available upon publication because the cost of preparing, depositing and hosting the data would be prohibitive within the terms of this research project. The data that support the findings of this study are available upon reasonable request from the authors.
Funding
We acknowledge financial support from the Agence Nationale de la Recherche France (Grant ANR-19-CE30-0006-01 UNLOC), the European Regional Development Fund (OPTIMAL) and from the European Union's Horizon 2020 research and innovation program under the Marie Skłodowska-Curie Grant Agreement No. 860553.
Conflict of interest
The authors declare no conflicts of interest.