


Abstract
In order to promote the precise governance of air pollution in the Yellow River Basin(YRB), it is of great significance to reveal the spatio-temporal patterns of urban air pollution in the basin and its spatial mismatch characteristics with air pollutant emissions. Based on spatial autocorrelation model and spatial mismatch model, this paper selected air pollution-related monitoring data from 69 cities in YRB from 2015 to 2020 as samples, and used ArcGIS, Stata, GeoDa and other softwares to analyze the spatio-temporal patterns of urban air pollution and its spatial mismatch characteristics with air pollutant emissions in YRB. The results showed that: (1) Temporally, the average annual Air Quality Index (AQI) values of cities in YRB ranged from 78.22 to 97.08 in 2015–2020, among which, the average annual AQI values of cities in the upper, middle and lower reaches of the basin decreased from 79.86, 89.23 and 122.14 in 2015 to 66.87,82.98 and 98.43 in 2020. (2) Spatially, there were obvious spatial differences in urban air pollution in YRB, and the AQI was roughly distributed in a geographical gradient of upper reaches < middle reaches < lower reaches, and there were significant spatial correlations in urban air pollution, mainly showing 'high-high' and 'low-low' aggregating characteristics. Among them, the lower reaches of YRB had formed a concentrated 'high pollution zone'. (3) There was an obvious spatial mismatch between urban air pollution and air pollutant emissions in YRB, among which the spatial mismatch was obvious in cities such as Wuhai, Zibo, Shizuishan, Yangquan, Taiyuan, Datong, Jiyuan, Kaifeng, Puyang and Xi'an. (4) To improve the overall situation of air pollution in the cities of YRB, this paper proposed that the geographical gradient difference of air pollution in the upper, middle and lower reaches of YRB needs to be fully considered, following the principle of 'focused treatment, gradual progress, enhanced prevention', and according to the spatial mismatch characteristics of urban air pollution and air pollutant emissions, it is necessary to build a 'differentiated' governance strategy system for urban air pollution in the basin, which is 'tailored to local conditions and categorized measures'.
Export citation and abstract BibTeX RIS

Original content from this work may be used under the terms of the Creative Commons Attribution 4.0 licence. Any further distribution of this work must maintain attribution to the author(s) and the title of the work, journal citation and DOI.
1. Introduction
Along with the rapid development of China's market economy, the level of urbanisation and industrialisation in China has been increasing, however, at the same time a series of environmental pollution problems have emerged, among which air pollution is particularly prominent (Han 2018). According to the 2018 China Climate Bulletin published by the China Meteorological Administration, there were five widespread and persistent air pollution processes in China in 2018, with the North China Plain and Fenwei Plain being the most severe. According to the Ministry of Ecology and Environment's notification of the ambient air quality status of 168 key cities monitoring air pollution nationwide in 2020, YRB occupied 16 of the bottom 20 cities in the national air quality ranking, with six cities in the basin, including Anyang, Taiyuan, Linfen, Zibo, Hebi and Jiaozuo, ranking in the bottom 10 respectively, making the air pollution situation in the basin extremely serious. Regional air pollution is not only directly related to its air pollutant emissions, but also influenced by wind speed, wind direction and topography, with strong spatial and temporal heterogeneity, strong spatial interaction and negative externalities (Li et al 2013), which makes cross-regional collaborative governance an inevitable choice for regional air pollution governance. At the same time, the spatial and temporal characteristics of regional air pollution could also lead to 'free-rider behaviour' in the process of collaborative air pollution governance (Yang and Gabor 2019), especially the 'one-size-fits-all' cross-regional collaborative governance mechanism is difficult to stimulate collaborative motivation and reach collaborative action, and it is difficult to form a regular and sustainable cross-regional collaborative governance (Jing et al 2019), which may ultimately lead to a 'collective action dilemma' in air pollution governance (Ambec and Coria 2018, Liu and Lei 2018). Therefore, it is important to reveal the spatio-temporal heterogeneity of air pollution in YRB and the source and destination regions of urban air pollutants in the basin to clarify the main responsibilities of each local government, build a 'differentiated' system of cross-regional collaborative air pollution governance measures, and realise a regular and sustainable cross-regional collaborative governance of air pollution in the basin.
Currently, research closely related to this study is focused on the following areas:(1) research on the emission intensity and spatio-temporal distribution characteristics of air pollutants. Currently, scholars mostly use air pollutant emission inventory to quantify the emission contributions of different sources in the region. For example, Ma et al (2021) used the Multi-resolution Emission Inventory for China(MEIC) model published by Tsinghua University in China to quantify the emissions of air pollutants from different sources such as industry, residential, transportation and agriculture in Lanzhou City, Gansu Province; Sha et al (2019) used two emission inventories, MEIC and GlobEmission, to study the emission intensity of SO2 and NO2 and their spatial distribution characteristics in the Yangtze River Delta region of China.(2) Research on cross-regional transport of air pollutants. At present, scholars mainly use air quality models such as CMAQ and WRF-Chem and air mass trajectory models such as FLEXPART and HYSPLIT to simulate the cross-regional transport processes of atmospheric pollutants, so as to distinguish the contributions of local emission sources and external transport sources to urban air pollution and identify potential source areas of regional air pollution (Liao et al 2017, Zhao et al 2020a, Gu et al 2021). For example, Lv et al (2015) used the CMAQ model system to simulate air pollution in the Pearl River Delta and found that the long-distance transport of air pollutants from Fujian Province and Jiangxi Province has a significant impact on air quality in the Pearl River Delta region; Wang et al (2008) used a quantitative simulation study with the HYSPLIT model to find that external inputs have a significant impact on urban PM2.5 concentrations in the northern Yangtze River Delta region of China, while PM2.5 pollution in the south-central Yangtze River Delta region is mainly influenced by local pollutant emissions. Currently, air quality models and air mass trajectory models have become important tools for quantitatively identifying potential source areas of urban air pollutants, however, the high reliance of the models on refined emission inventory data, and meteorological data also limits their wider application. (3) Research on the effect of spatial mismatch. In 1968, Kain proposed the Spatial Mismatch Hypothesis, whose main idea is to reveal the spatially asymmetrical and non-synergistic state of one element of the system in relation to another, to reveal the spatial differences between residential and employment opportunities for disadvantaged groups in urban development in the context of urban spatial reconfiguration. It has since been gradually applied to various academic fields such as tourism, sociology and geography. For example, a study of the spatial mismatch between urban tourism resources and the level of tourism economic development had been studied in the field of tourism (Zhang and Shi 2015, Yang et al 2021). Existing studies have shown that urban air quality is not simply linearly related to urban air pollution emissions because urban air pollution may be influenced by both local emission sources and external transmission sources (Li et al 2013), and there may be a 'spatial mismatch' between urban air pollutant emissions and their air quality, i.e. a place with low air pollutant emission intensity but serious air pollution or a place with high air pollutant emission intensity but no significant deterioration in air quality (Zhang et al 2019). Therefore, this paper argues that the use of spatial mismatch theory to analyse the spatial mismatch characteristics between urban air pollutant emissions and air pollution will be a new attempt to determine the source and destination regions of urban air pollutants.
In 2019, China's General Secretary Xi Jinping proposed at the symposium on ecological protection and high-quality development of YRB to elevate the ecological protection and high-quality development of YRB to a national strategy and atmospheric pollution in the key cities of YRB is a growing issue of concern to scholars, for example, Wang et al (2020) conducted a study on the characteristics of urban PM2.5 components and their pollution sources in Zhengzhou City, Henan Province; Chang et al (2020) investigated the daily variation characteristics of atmospheric PM1.0 pollution in Lanzhou City, Gansu Province. Currently, the scale and content of research on air pollution in YRB is deepening. For example, Zhang et al (2022) and Huang et al (2019) studied the characteristics of atmospheric PM2.5 concentrations in urban agglomerations in the Guanzhong Plain urban agglomeration and Fenwei Plain urban agglomeration in the Yellow River Basin, respectively, using methods such as spatial autocorrelation analysis and traditional statistical analysis; other scholars used spatial regression models to study the effects of natural factors such as precipitation, topography and vegetation and social factors such as industrial structure, technological innovation and population structure on SO2 and PM2.5 in the air of cities in the basin (Li and Han 2022, Teng et al 2021).
A review of the literature reveals that the existing research findings have deepened people's understanding of the formation and impact of air pollution in YRB and enriched the methodological system for the governance of its air pollution problems, providing crucial support for promoting ecological protection and high-quality development in YRB. However, the following limitations still exist in the research on air pollution in YRB: (1) Existing studies have mostly focused on urban agglomerations, specific provinces or cities in YRB, while fewer studies have been conducted on urban air pollution in the nine provinces of the entire YRB. (2) Scholars have mostly studied air pollution in YRB in terms of the causes and influencing factors of urban air pollution, while studies on the spatio-temporal heterogeneity of air pollution in cities in the basin are still rare, especially studies on the spatial mismatch between urban air pollution and air pollutant emissions. YRB is an important densely populated and industry-bearing area in northern China, and with the increase of urbanisation and industrialisation in the basin, it is worth exploring how the high-density population layout and high-intensity resource development will contribute to the evolution of urban air pollution in the basin. At the same time, it is also necessary to reveal the spatial variation characteristics of urban air pollution in YRB, which is an objective need to implement the national strategic initiative of 'taking full account of the differences of the upper, middle and lower reaches of the river' and 'to work together to protect and harness the YRB'. Likewise, it is also an essential basis for determining the contributions of local emission sources and external transmission sources to urban air pollution and for the establishment and improvement of a cross-regional collaborative air pollution governance mechanism by 'tailoring and classifying' policies. In view of the above, the main research objectives of this paper include: (1) taking 69 cities in the nine provinces of YRB as the research objects, and based on the air quality status monitoring data (AQI) of each city from 2015 to 2020, using traditional statistical methods and spatial autocorrelation models, to carry out the analysis of the spatial and temporal patterns of air pollution in cities of the basin; (2) introducing the 'spatial mismatch theory' (Kain 1968), constructing a spatial mismatch index model of urban air pollution and its air pollutant emissions in YRB, carrying out research on the spatial mismatch characteristics of urban air pollution in the basin, and expecting to provide a scientific basis for the construction of a joint prevention and control mechanism for cross-regional air pollution governance and for improving the effectiveness of air pollution governance in the cities of the basin.
2. Study area and methodology
2.1. Study area
YRB is located between 32°N-42°N and 95°E-120°E, and is a typical arid, semi-arid and semi-humid climate zone in China. The total area of the basin is about 793,000 km2, and the basin spans a long distance from east to west, with a total length of about 5,464 km, spanning four geomorphological units from west to east, including the Qinghai-Tibet Plateau, Inner Mongolia Plateau, Loess Plateau and North China Plain, with significant ups and downs in terrain. YRB constitutes an important ecological protective barrier in China, as well as an important economic corridor in China, which is rich in coal, oil, natural gas and non-ferrous metals. However, due to historical and natural conditions, the basin has a fragile ecological environment and a serious ecological security situation, and the air pollution situation in the basin has also become an essential factor limiting the improvement of its people's well-being. In this paper, with reference to the natural watershed boundaries delineated by the Yellow River Conservancy Commission of the Ministry of Water Resources of China, and based on the natural boundaries of YRB, while considering the relationship between regional economic and social development and the basin, 69 municipal administrative units in nine provinces of the basin are selected for the study, and with reference to the criteria for dividing the cities in the upper, middle and lower reaches of YRB as set out in the Flood Control Plan for the basin approved by the State Council in 2008, they are divided into three regions in the upper reaches, middle reaches and lower reaches (figure 1, table 1) to analyse the spatial characteristics of air pollution in YRB.
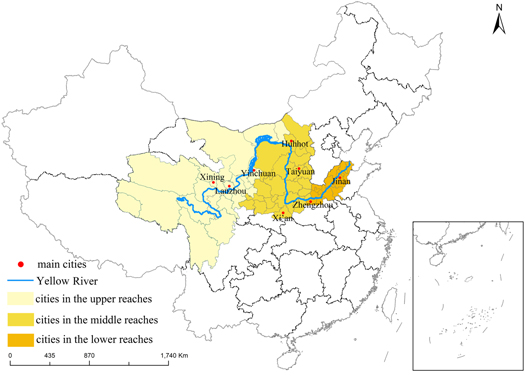
Figure 1. Map of the study area.
Download figure:
Standard image High-resolution imageTable 1. Division of prefecture-level cities in the upper, middle and lower reaches of YRB.
| Basin Delineation | Major prefecture-level cities |
|---|---|
| upper reaches (25) | Yushu, Guoluo, Haibei, Huangnan, Xining, Haidong, Haixi, Hainan, Gannan, Linxia, Wuwei, Lanzhou, Dingxi, Baiyin, Aba, Ganzi, Guyuan, Wuzhong, Zhongwei, Yinchuan, Shizuishan, Wuhai, Alxa League, Bayan Nur, Baotou |
| middle reaches (29) | Qingyang, Pingliang, Tianshui, Erdos, Hohhot, Ulanqab, Yulin, Tongchuan, Weinan, Yan'an, Xi'an, Baoji, Shangluo, Shuozhou, Xinzhou, Taiyuan, Changzhi, Jincheng, Yangquan, Jinzhong, Lvliang, Linfen, Yuncheng, Datong, Jiyuan, Sanmenxia, Jiaozuo, Luoyang |
| lower reaches (15) | Puyang, Hebi, Anyang, Zhengzhou, Kaifeng, Xinxiang, Heze, Jining, Liaocheng, Tai'an, Dezhou, Jinan, Zibo, Binzhou, Dongying |
2.2. Methodology
2.2.1. Spatial correlation analysis model
(1) Global spatial autocorrelation analysis
According to Tobler's First Law of Geography (Tobler 1970), neighbouring spatial things or phenomena are correlated, and the closer the distance the stronger the correlation (Anselin et al 2004). In this paper, we use the global Moran's I to measure the spatial autocorrelation of air pollution in YRB, which is calculated as

where n is the number of spatial units in the basin, i.e. the 69 prefecture-level cities;  is the spatial unit weight matrix, which is used to represent the spatial adjacency feature, i.e. if there is a shared boundary line between the spatial locations i and j , i.e.
  otherwise 0;
  and
and  are the attribute values at the spatial locations i and j, respectively;
  is the mean value of the attribute values; Moran's I takes the value range from −1 to 1, if I >0, it means that the study objects are spatially, I > 0 means that the objects are positively correlated in space, i.e. similar attribute values tend to be spatially aggregated, I = 0 means that the objects are spatially uncorrelated, and I < 0 means that they are negatively correlated, i.e. similar attribute values tend to be spatially discrete. The global Moran's I is usually tested for significance using the Z-test, calculated as

where  and
and  are the mathematical expectation and variance of I respectively.
(2) Local spatial autocorrelation analysis
Global Moran's I, as an important measure of spatial correlation, can measure the structural patterns and aggregating mode of regional spatial variables as a whole, but cannot identify the spatial aggregating characteristics of individual spatial units in the case of spatial heterogeneity. Local spatial autocorrelation is used to describe the degree of similarity between a spatial unit and its neighbours, and can indicates the extent to which each local spatial unit follows the global general trend, revealing how spatial dependence varies with spatial location. A common metric for local spatial autocorrelation is the local Moran's I, which is calculated as

Where n is the number of spatial units;  and
and  are the attribute values of two points on the space;
  is the average of the attribute values of all sample points in the study area;
  is the spatial neighbourhood eigenvalue of the spatial statistical unit, i.e. the spatial weighting matrix; Moran's I > 0 means that spatial unit i has positive spatial autocorrelation with the attribute values of neighbouring spatial units and is locally spatially aggregated; Moran's I < 0 means that spatial unit i has negative spatial autocorrelation with the attribute values of neighbouring spatial units and is locally spatially discrete. The results of the local Moran's I are generally characterised by Moran scatter plots and Local indicators of Spatial association (LISA) plots. The Z-test for the local Moran's I is calculated as

where  and
and  are the mathematical expectation and variance of
  respectively.
2.2.2. Spatial mismatch model
Currently, air quality models and air mass trajectory models have become the main methods for quantifying the contributions of local emission sources and external transmission sources to urban air pollution and identifying potential source areas for air pollution. This paper introduces the 'spatial mismatch theory' to construct a spatial mismatch index model of urban air pollutant emissions and air pollution, to analyse the 'spatial mismatch' state of urban air pollutant emissions and air quality, and then determine the source or destination regions of urban air pollutants. Compared to air quality models and air mass trajectory models, spatial mismatch index models do not need to consider the specific emission contributions of specific local or external sources and the complex transport processes of pollutants, making the data more accessible and the quantification process simpler. In addition, the spatial mismatch index model can determine the dominant source regions of urban air pollution (local or external input sources) through the spatial mismatch of urban air pollutant emissions and air pollution characteristics, which can provide a reference for determining the responsibility of cross-regional collaborative air pollution governance and constructing regional air pollution 'differentiated' collaborative governance measures.
The spatial mismatch index model constructed in this paper is as follows,


where SMI is the basin spatial mismatch index, which characterizes the overall level of spatial mismatch between air pollutant emissions and air pollution conditions in the basin;  is the spatial mismatch index of the city i, which characterizes the spatial mismatch between air pollutant emissions and air pollution conditions in different cities; P is the basin air pollutant emissions per unit area ( t/km2 ); n is the number of prefecture-level cities in the basin;
  is the city i air pollutant emissions per unit area (t/km2); A is the average AQI value of the whole basin;
  is the AQI of the city i (AQI is the air quality index, the higher the AQI, the more serious the air pollution; on the contrary, the better the air quality). The larger the SMI is, the more significant the spatial mismatch between urban air pollutant emissions and air pollution levels. This paper draws on previous research Lau 2011, Zhao and Cheng (2020b) to classify cities in the basin into high mismatch zones (SMI > 0.5), medium mismatch zones (0.3 < SMI ≤ 0.5) and low mismatch (SMI ≤ 0.3) zones according to the magnitude of the mismatch index.
This paper attempts to characterise the spatial mismatch between urban air pollution and local air pollutant emission levels through spatial mismatch levels. If the spatial mismatch level is low, it indicates that urban air pollution is mainly influenced by local pollutant emissions; if the spatial mismatch level is high, it indicates that urban air pollution is mainly influenced by the input of foreign pollutants or the influence of local pollutant emissions on the surrounding cities is more significant. Then, each city is analysed in relation to its air pollutant emission status and spatial mismatch level. If a city has high air pollutant emission and high spatial mismatch level, it indicates that air pollutant emission not only has a significant impact on air quality in the region, but also has a serious impact on the surrounding areas; if a city has low air pollutant emission but high spatial mismatch level, it indicates that air pollution in the city is mainly influenced by external inputs from surrounding regions.
2.3. Data sources and processing
This paper focuses on the analysis of the spatial mismatch between air pollutant emissions and air pollution conditions in the basin through the air pollutant emission data and AQI data of 69 cities in nine provinces in the basin.
(1) Air pollutant emission data. As industrial air pollutant emissions in China account for more than 80% of the total air pollutant emissions in the country, they have become the primary source of air pollution in China (Hong and Zhang 2021). Therefore, this paper selects urban industrial air pollutant emissions as a representative indicator for the relevant analysis. At present, scholars mostly use emissions inventory methods such as MEIC, INTEX-B(Intercontinental Chemical Transport Experiment-Phase B) and TRACE-P(Transport and Chemical Evolution over the Pacific) to simulate and calculate the emissions of air pollutants from industrial sources in the region, and the main calculation indicators include SO2, NOx and PM2.5, PM10, etc In addition, the China Environment Statistical Yearbook and the provincial and municipal Statistical Yearbooks also publish data on industrial air pollutant emissions by city, with the main statistical indicators including SO2, NOx and soot (solid suspended matter with a particle size of less than 75 μm). As can be seen, the data on industrial air pollutant emissions in the official Statistical Yearbook is largely consistent with, if not more comprehensive than, the scope of the commonly used emissions inventory methods of statistics. However, the application of the emissions inventory methods relies heavily on high-precision basic data such as population, GDP, land use types, road networks, etc, and there are difficulties in collecting accurate and reliable source emission data comprehensively, and it is difficult to accurately record the emission levels of various pollution sources, especially with the rapid development of regional economy and society, and the emissions inventory methods have the problem of regional applicability (Ma et al 2021, Xing and Song 2023). Therefore, this paper directly selects official data on industrial air pollutant emissions from 69 cities in YRB published in the China Environmental Statistics Yearbook and the provincial and municipal Statistical Yearbooks for further analysis.
(2) Air Quality Index(AQI) data. Since PM2.5 has the most obvious impact on air pollution in China (Guan et al 2014; Huang et al 2019), scholars now mostly use PM2.5 as a representative indicator to study air pollution. However, urban air pollution is influenced by a combination of pollutants such as SO2, NO2, PM10, PM2.5 and O3, and there is some spatial and temporal heterogeneity in the primary pollutants of air pollution in different cities or at different times. Therefore, more and more scholars have started to use comprehensive air quality indicators (e.g. AQI) to measure regional air pollution problems comprehensively (Li et al 2021, Guo et al 2019). This paper uses AQI data presented in the 2012 Ambient Air Quality Standards (GB3095-2012) promulgated by China to study air pollution in YRB. AQI is a dimensionless index to quantitatively describe the air quality condition, the higher its value, the more serious the air pollution condition. And it is calculated by using six categories of pollutants such as PM2.5, PM10, SO2, NO2, O3 and CO as reference indicators, and the actual monitoring data of the concentration of various pollutants to obtain the comprehensive degree of urban air pollutant concentration. This paper analyses the air pollution characteristics of the basin through daily AQI data of 69 cities in YRB from 1st January ,2015 to 31st December ,2020, which are obtained from the China Air Quality Online Monitoring and Analysis Platform (http://106.37.208.233:20035/). In addition, the data were processed by Excel 2010, and the relevant one-way ANOVA was conducted by SPSS 19.0, and the kernel density analysis of the national and YRB air quality indices was conducted by Stata, and the graphs were produced by Origin 19.0 and ArcGIS 10.8.
3. Results and analysis
3.1. The overall situation of air pollution in YRB is serious
In order to assess the overall status of air pollution more clearly in YRB, we conducted a comparative analysis between the air pollution levels in the basin and the national air pollution levels. It was found that the annual average value of AQI for 69 cities along YRB from 2015 to 2020 was 89.94, while the annual average value of AQI for 361 cities monitoring air pollution nationwide was 75.23 in the same period, indicating that the overall air quality condition of cities in the basin was less than the national average value. Furthermore, by solving for the mean AQI values of 361 monitored cities across the country from 2015–2020, a comparison of the national and YRB's AQI kernel density was constructed (figure 2). It was found that the annual mean values of AQI indices of 361 cities nationwide during the study period were mostly concentrated between 50 and 90, with the peak to the left, similar to a chi-square distribution, and the distribution of cities with annual mean AQI values greater than 100 had a small probability, with probability densities below 0.01, while most of the 69 cities in YRB have average annual AQI values in the range of 60–120, and the corresponding probability density distribution values are all above 0.01, and the distribution probability of the basin AQI average value greater than 100 is significantly higher than the national distribution probability. It can be seen that the urban air pollution situation in YRB is severe, and the overall air pollution level in the basin is significantly higher than the national average value.

Figure 2. Annual AQI kernel density comparison between the national and YRB from 2015 to 2020.
Download figure:
Standard image High-resolution image3.2. Urban air pollution in YRB is gradually improving
Figure 3 shows the temporal trends of AQI for cities in the upper, middle and lower reaches of YRB. And the average annual AQI values for all cities along YRB from 2015 to 2020 range from 78.22 to 97.08, with an overall fluctuating downward trend of AQI. In particular, the average annual AQI values of cities in the upper, middle and lower reaches of YRB decreased from 79.86, 89.23 and 122.14 in 2015 to 66.87, 82.98 and 98.43 in 2020, respectively. A comparative analysis of the spatial cross-sectional map of air pollution levels from 2015 to 2020 (figure 4) reveals that the number of cities with an annual AQI over 100 rose from 20 in 2015 to 28 in 2017 and then fell to four in 2020, respectively, and the number of cities with an annual AQI less than 100 fell from 49 in 2015 to 41 in 2017 and then rose to 65 in 2020. The results show that the air pollution situation of cities in YRB is gradually improving, especially the air quality of cities in the lower reaches of YRB has improved significantly, and the proportion of cities with annual AQI over 100 to the total number of cities in the lower reaches of the basin has decreased from 100.0% in 2015 to 20.0% in 2020, which may be related to the industrial structure adjustment and upgrading, technological innovation and the increasing level of environmental regulation in thecities in the lower reaches of the basin in recent years.

Figure 3. Annual trends in AQI for cities in the upper(TUR), middle(TMR) and lower reaches(TLR) of YRB, 2015–2020.
Download figure:
Standard image High-resolution image
Figure 4. Spatial cross-section of air pollution levels in cities, 2015–2020.
Download figure:
Standard image High-resolution imageFurther analysis revealed that the AQI of the upstream, midstream and downstream cities of YRB from 2015 to 2020 showed obvious monthly variations, with the monthly average AQI ranging from 53.17–72.69, 67.76–115.04 and 83.98–151.74, respectively, and the monthly variations of AQI showed an overall 'double-peaked ' in character. (figure 5). The highest peak of the AQI in the upper reach of YRB occurred in May (72.69) and the second peak in January (71.25), while the highest peaks of the AQI in the middle and lower reaches of YRB occurred in January (115.04 and 151.74 respectively) and the second peak in June (90.01 and 117.84 respectively). This is significantly different from the results of scholars (Huang et al 2019) who characterized the 'single peak' monthly variation of PM2.5 concentrations in Xi'an in YRB (the peak mostly in January) and O3 concentrations in the North China Plain (the peak mostly in May or June) (Huang et al 2019). The difference may be due to the influence of the continental monsoon climate (Hu et al 2022), whose stable weather condition in winter makes PM2.5 the primary pollutant of urban air pollution in YRB, while the meteorological conditions of 'high temperature, low rainfall and weak wind' at the end of spring and the beginning of summer lead to the continuous accentuation of the O3 pollution problem in the basin, which eventually leads to the urban air pollution in YRB is characterised by a 'double-peaked' intra-annual variation, i.e. seasonally, urban air pollution in YRB is significantly influenced by PM2.5 pollution in winter and mainly by O3 pollution at the end of spring and the beginning of summer.

Figure 5. Monthly trends in AQI for cities in TUR, TMR and TLR of YRB, 2015–2020.
Download figure:
Standard image High-resolution image3.3. Spatial pattern characteristics of urban air pollution levels in YRB
3.3.1. Characteristics of the overall spatial pattern of air pollution
Figure 6 shows the differences in the annual mean AQI values for cities in the upper, middle and lower reaches of YRB from 2015 to 2020. The results show that there are significant spatial differences in the air pollution status in the upper, middle and lower reaches of YRB, where the mean AQI of major cities in the upper, middle and lower reaches of YRB from 2015 to 2020 are 71.92, 89.67 and 108.22, respectively, with annual coefficients of variation of 11.49%, 7.40% and 8.24%, respectively, and the analysis of one-way ANOVA revealed that there were significant differences in the air pollution status of major cities in the upper, middle and lower reaches of YRB (F = 159.84; P = 0.000 < 0.05), and the geographical gradient distribution of urban air pollution levels was roughly in the trend of upper reaches < middle reaches < lower reaches. From the perspective of specific cities (table 2), the overall air quality of cities in the upper reaches of YRB is better, especially in cities such as Aba, Ganzi and Yushu, where the annual AQI is below 50; while the 10 cities in the lower reaches of the basin with the most severe air pollution occupy eight seats, and some cities such as Dezhou, Zhengzhou and Liaocheng with the most severe pollution have an annual AQI of over 130, which shows that the lower reaches of YRB have formed a concentrated and highly polluted area, with a clear 'aggregating' feature of air pollution.

Figure 6. Spatial variation in AQI in YRB, 2015–2020.
Download figure:
Standard image High-resolution imageTable 2. AQI measurement and ranking of cities in YRB, 2015–2020.
| Cities | AQI | |||||||
|---|---|---|---|---|---|---|---|---|
| 2015 | 2016 | 2017 | 2018 | 2019 | 2020 | Average values | Quality Ranking | |
| Anyang | 126.50 | 125.58 | 107.75 | 110.08 | 124.83 | 113.58 | 118.06 | No. 1 from the bottom |
| Dezhou | 141.08 | 127.50 | 118.83 | 99.50 | 107.42 | 97.92 | 115.38 | No. 2 from the bottom |
| Liaocheng | 133.92 | 124.50 | 117.33 | 103.25 | 112.25 | 98.08 | 114.89 | No. 3 from the bottom |
| Heze | 130.00 | 123.00 | 114.08 | 102.00 | 108.58 | 96.58 | 112.38 | No. 4 from the bottom |
| Jiaozuo | 124.00 | 120.42 | 105.25 | 98.33 | 114.92 | 101.83 | 110.79 | No. 5 from the bottom |
| Xianyang | 94.17 | 125.25 | 130.92 | 104.42 | 110.50 | 95.58 | 110.14 | No. 6 from the bottom |
| Zhengzhou | 135.08 | 121.33 | 96.75 | 96.42 | 111.83 | 98.92 | 110.06 | No. 7 from the bottom |
| Jinan | 128.42 | 117.33 | 111.25 | 97.42 | 106.83 | 96.50 | 109.63 | No. 8 from the bottom |
| Zibo | 125.83 | 113.08 | 110.33 | 95.00 | 109.50 | 99.17 | 108.82 | No. 9 from the bottom |
| Linfen | 85.50 | 107.00 | 131.58 | 107.33 | 117.00 | 99.50 | 107.99 | No. 10 from the bottom |
| Gannan | 76.42 | 76.00 | 69.00 | 51.67 | 57.17 | 53.00 | 63.88 | No. 5 |
| Golo | 78.25 | 70.75 | 68.25 | 56.42 | 56.25 | 51.08 | 63.50 | No. 4 |
| Yushu | 53.00 | 45.83 | 58.33 | 45.83 | 47.17 | 40.67 | 48.47 | No. 3 |
| Ganzi | 44.33 | 48.92 | 47.75 | 45.67 | 38.00 | 36.42 | 43.51 | No. 2 |
| Aba | 38.17 | 48.33 | 44.92 | 41.08 | 41.42 | 40.25 | 42.36 | No. 1 |
Note: Given space constraints, only the top 10 and bottom five cities in the AQI are listed.
3.3.2. Spatial correlation pattern characteristics of urban air pollution levels in YRB
The above analyses the temporal trends and spatial patterns of urban air pollution levels in YRB in both the temporal and spatial dimensions, but does not reflect the spatial correlation characteristics of urban air pollution. In order to reveal the spatial correlation of urban air pollution in the basin, we used GeoDa (http://geodacenter.github.io/) to calculate the global Moran's I value of AQI in YRB. From the analysis of the statistical tests in table 3, the global Moran's I values of YRB for each year and the whole time period from 2015 to 2020 were all greater than 0.7, and all passed the 1% significance level test, indicating that the air pollution status in YRB is not randomly distributed, but there is significant spatial autocorrelation, that is, the air pollution status of each city is influenced by neighbouring or nearby areas, and the air pollution status near or around the areas with more serious air pollution is also more serious, while the air pollution status around the areas with better air quality is also relatively light.
Table 3. Global Moran's I index test for AQI in YRB, 2015–2020.
| AQI | Moran's I | |||||
|---|---|---|---|---|---|---|
| 2015 | 2016 | 2017 | 2018 | 2019 | 2020 | |
| Coefficient value I | 0.708 | 0.7324 | 0.5758 | 0.7823 | 0.8042 | 0.7605 |
| Expected value E(I) | −0.0156 | −0.0156 | −0.0156 | −0.0156 | −0.0156 | −0.0156 |
| Standard deviation SD(I) | 0.0882 | 0.0889 | 0.0917 | 0.876 | 0.089 | 0.0899 |
| Z-value | 8.2142 | 8.4137 | 6.413 | 9.1145 | 9.1972 | 8.6212 |
| P-value | 0.000 | 0.000 | 0.000 | 0.000 | 0.000 | 0.000 |
To further reflect the local correlation and aggregating characteristics of urban air pollution in YRB, LISA maps (figure 7) were used to reveal the spatial correlation patterns among specific cities. As shown in figure 6, at the 1% significance level, the air pollution situation in the basin mainly shows 'High-High' ('H-H') and 'Low-Low' ('L-L') aggregations. The 'H-H' aggregating area mainly includes 21 prefecture-level cities such as Jiaozuo, Zhengzhou, Anyang, Dezhou, Liaocheng and Heze, and is concentrated in the lower reaches of the basin, indicating that a more stable and continuous air pollution area has been formed in the lower reaches of the basin. The 'L-L' aggregating area is mainly concentrated in 23 cities in the upper reaches of YRB, including Guoluo, Yushu, Haidong, Xining and Wuwei, indicating that the overall air quality in the upper reaches of YRB is relatively positive. The 'High-Low' ('H-L') aggregations are significantly polarised areas, mostly converted from the 'L-L' aggregations and mainly located around the 'L-L' aggregations, including four cities such as Huangnan, Lanzhou, Pingliang and Xinzhou, where air pollution is more serious. The 'Low-High' ('L-H') aggregations are areas of subsidence (which can be interpreted as radiated areas), mainly around the 'H-H' areas, with the possibility of the 'L-H' aggregations gradually transforming into 'H-H' aggregations, mainly in the two cities of Sanmenxia and Shangluo. The spatial correlation of urban air pollution shows that the air pollution problem in the basin is not a regional isolated problem, but a symbiotic problem with different regions interacting with each other. Therefore, strengthening joint prevention and control between regions is the fundamental solution for air pollution governance in the basin.

Figure 7. Spatial association pattern of urban air pollution in YRB.
Download figure:
Standard image High-resolution image3.4. Spatial mismatch characteristics between urban air pollution and air pollutant emissions
In this paper, the intensity of air pollution emissions, i.e. emissions of air pollutants per unit area, for cities in YRB in 2016, 2017 and 2018 are counted. Due to the differences in data completeness among years, this paper first selects the year 2018 with more detailed data (there are still some pollutant emission data missing for nine cities, including Yushu, Ganzi, Guoluo, Aba, Huangnan, Haibei Prefecture, Hainan, Haixi and Alashan, which will not be relevantly analysed), and uses the SPSS hierarchical cluster analysis method to divide each region into three class zones: low emission zones, medium emission zones and high emission zones, and then delineated the air pollutant emission levels of each city in 2016 and 2017 according to the air pollutant emission intensity intervals of each class zone (figure 8). The results show that there is a good consistency in the air pollution emission intensity levels of cities in the Yellow River Basin in 2016, 2017 and 2018, so this paper selects 2018, the year with more detailed data, for further analysis of the air pollutant emission intensity of each city. The results found that 19 cities such as Bayan Nur, Ordos, Ulanqab and Xi'an belonged to low emission zones, 14 cities such as Pingliang, Xinzhou, Xinxiang, Zhongwei and Wuzhong belonged to medium emission zones, and 27 cities such as Wuhai, Zibo, Shizuishan, Yangquan and Taiyuan belonged to high emission zones, with cities belonging to high emission zones accounting for 45.0% of the total number of cities counted.

Figure 8. Map of air pollutant emission intensity by cities in YRB.
Download figure:
Standard image High-resolution imageIn addition, the spatial mismatch index between air pollutant emissions and pollution status was calculated for each city in the basin in 2016, 2017 and 2018, and classified into low mismatch, medium mismatch and high mismatch zones according to the relevant classification criteria (figure 9). The results showed that the spatial mismatch levels of air pollution and air pollutant emissions in cities of YRB in 2016, 2017 and 2018 also had obvious similarities, so this paper also took 2018 as an example to further analyse the spatial mismatch characteristics of air pollution and air pollutant emissions in cities in the basin. The results show that the high mismatch zone mainly includes 12 cities such as Wuhai, Zibo, Shizuishan, Yangquan and Taiyuan; 18 cities belong to the medium mismatch zone such as Binzhou, Tongchuan, Xining, Xinzhou and Linxia; 30 cities belong to the low mismatch zone such as Anyang, Changzhi, Shuozhou, Jincheng and Zhengzhou, of which the cities belonging to the medium and high mismatch zones account for 50% of the total number of the statistical cities.

Figure 9. Spatial mismatch between air pollution and pollutant emissions in cities of YRB.
Download figure:
Standard image High-resolution image
According to the results of the classification of pollutant emission levels and spatial mismatch levels of cities in YRB in 2018, the air pollution types of cities in the basin are divided into eight types, and the specific spatial distribution and pollution characteristics are shown in table 4.
Table 4. Spatial mismatch between air pollution and pollutant emissions in YRB in 2018.
| Types | Cities | Pollution characteristics |
|---|---|---|
| High Emission-High Mismatch zones (9) | Datong, Taiyuan, Yangquan, Shizuishan, Zibo, Wuhai, Jiyuan, Lvliang, Yuncheng | With high emissions of atmospheric pollutants and a high spatial mismatch index, urban air pollutant emissions will not only have a significant impact on the air quality of the region, but will also have a serious impact on the surrounding areas, and the air pollution control in the jurisdiction should be strengthened to reduce the spillover effect on the surrounding areas. |
| High Emission - Medium Mismatch zones (3) | Binzhou, Xining, Tongchuan | The emission intensity of pollutants is high, but may be affected by external factors such as wind speed and wind direction leading to the diffusion of pollutants, which will have a greater impact on the air quality of the surrounding areas, so the air pollution control in the jurisdiction should be strengthened to reduce the spillover effect on the surrounding areas. |
| High Emission - Low Mismatch zones (15) | Weinan, Anyang, Hohhot, Jiaozuo, Dezhou, Hebi, Yinchuan, Liaocheng, Lanzhou, Jinan, Jining, Zhengzhou, Jincheng, Shuozhou, Changzhi | The intensity of air pollutant emissions and air quality conditions have a strong coupling relationship, local air pollution is mainly affected by the jurisdiction of the pollutant emissions, air pollution governance should strengthen the local pollution emissions governance mainly. But serious pollutant emissions are bound to have an important impact on the surrounding cities. |
| Low Emission - High Mismatch zones (3) | Puyang, Xi'an, Kaifeng | The emission intensity of air pollutants is highly misaligned with the urban air quality condition, the local air pollutant emission intensity is low but strongly influenced by the input of external pollutants and the air quality is poor, the synergistic treatment of air pollution with the surrounding areas should be strengthened to reduce the impact of the input of external pollutants. |
| Low Emission - Medium Mismatch zones (14) | Tianshui, Sanmenxia, Linxia, Luoyang, Baoji, Bayan Nur, Qingyang, Dingxi, Wuwei, Ulanqab, Gannan, Yan'an, Shangluo, Guyuan | The intensity of local air pollutant is low, and the air quality is affected by the strong input of external pollutants, so the synergistic governance of air pollution with the surrounding areas should be strengthened. |
| Low Emission - Low Mismatch zones (2) | Baiyin, Erdos | The intensity of air pollutant emissions and urban air quality conditions are well coupled, and regional air quality is mainly influenced by pollutant emissions in the respective jurisdictions, and the jurisdictions themselves have less intense pollutant emissions and better air quality. |
| Medium Emission - Medium Mismatch zones (1) | Xinzhou | Urban air pollution is mainly influenced by its own pollutant emissions and has a strong spillover effect on surrounding regional air pollution, therefore, air pollution governance should be strengthened with a focus on local and regional synergistic governance. |
| Medium Emission - Low Mismatch zones (13) | Xianyang, Pingliang, Tai'an, Baotou, Linfen, Xinxiang, Zhongwei, Wuzhong, Jinzhong, Dongying, Heze, Yulin, Haidong | The intensity of air pollutant emissions in the area is medium, and urban air pollution is mainly affected by its own pollutant emissions, therefore, air pollution control should be strengthened mainly by local governance. |
4. Conclusions
In this paper, the daily AQI data of 69 cities in YRB from 2015 to 2020 were selected to analyse the spatio-temporal patterns of air pollution in the basin and their spatial mismatch characteristics with air pollution emissions based on spatial autocorrelation model and spatial mismatch model. The main findings are as follows:
- (1)Temporally, the annual average value of AQI for 69 cities in YRB from 2015 to 2020 is 89.94, while the national annual average AQI for the same period is 75.23. The overall air quality of cities along YRB is not as good as the national average, but the air pollution situation in the basin is gradually improving. Spatially, there are significant spatial differences in the air pollution status of 69 cities in YRB, and the geographical gradient of AQI is roughly upper reaches < middle reaches < lower reaches, but there is an obvious spatial correlation and spatial spillover effect of air pollution in cities in the basin, and the lower reaches of YRB belong to the 'high value area' of air pollution in the basin.
- (2)There is an obvious spatial mismatch between air pollutant emissions and air pollution conditions in the cities of YRB, among which the spatial mismatch effect is most obvious in the cities such as Wuhai, Zibo, Shizuishan, Yangquan, Taiyuan, Datong, Jiyuan, Kaifeng, Puyang and Xi'an, and the spatial mismatch index is relatively small in the cities such as Anyang, Changzhi, Shuozhou, Jincheng, Zhengzhou, Jining, Jinan and Lanzhou, where the spatial coupling between air pollutant emissions and air pollution is high but the spatial mismatch effect is not obvious. For cities with insignificant spatial mismatch, we should focus on local air pollution control, while for cities with significant spatial mismatch, we should analyse the source or destination regions of pollutants according to their emission intensity and achieve comprehensive air pollution control based on regional synergy mechanisms.
- (3)The spatial differences of urban air pollution levels in YRB are mainly reflected in the differences between the upper, middle and lower reaches of the basin. To improve the overall situation of air pollution in the cities of the basin, it is necessary to fully consider the geographical gradient difference of air pollution in the upper, middle and lower reaches of YRB, follow the principle of 'focused treatment, gradual progress, enhanced prevention', and combine the spatial mismatch characteristics of air pollutant emissions and air pollution in each city, and build a 'differentiated' cooperative treatment strategy system for air pollution in cities of in the upper, middle and lower reaches of YRB. The high pollution 'clubs' in the lower reaches of YRB should be 'focused and controlled on a priority basis', and air pollution control should be given the highest priority in social and economic development; for cities in the middle reaches of YRB, it is necessary to take into full consideration the objective needs of urban economic and social development and to adopt a strategy of 'gradual advancement and enhancing improvement' in the treatment of air pollution; in the context of pollution prevention and control battles and the inlanding of national industries, better air quality in the upper reaches of the river basin may become a short-term phenomenon. Therefore, the cities in the upper reaches of YRB need to adopt an air pollution prevention and control strategy of 'strengthening precaution and preventing deterioration', strictly enforcing environmental access mechanisms and actively raising environmental access thresholds, as well as actively adopting special green industries as the main direction of future economic and social development according to their respective resource endowments to prevent the risk of deteriorating air quality.
- (4)This paper examines the spatio-temporal heterogeneity of urban air pollution in YRB and its spatial mismatch with air pollutant emissions, mainly at a macroscopic scale, which provides a reference for future policy formulation and adjustment of urban air pollution governance in the basin. However, in the process of formulating cross-regional air pollution governance measures, it is necessary to build cross-regional air pollution governance units based on the analysis of the spatial mismatch characteristics of urban air pollution and air pollutant emissions, with the help of air quality models, focusing on clarifying the specific source cities of air pollutants in 'low emission-high mismatch' cities and the spillover impact objects of air pollution in 'high emission-high mismatch' cities. On this basis, the emissions inventory can be used to establish an inventory of air pollution emissions in 'high emission' cities, to identify the dominant source regions of air pollutant emissions within each 'high emission' city, and to determine the key areas and key industries that need to be highlighted and controlled, so as to achieve differentiated and refined governance of air pollutant emissions in 'high emission' cities, which will be an important future research direction and also the main limitation of this study.
Acknowledgments
We would like to acknowledge our institutions including Safety and Emergency Management Research Centre, HPU and Emergency Management School, HPU, for their support of our research. In addition, we are grateful to the China's relevant government departments for providing data support for our research.
Data availability statement
The data cannot be made publicly available upon publication because no suitable repository exists for hosting data in this field of study. The data that support the findings of this study are available upon reasonable request from the authors.
Funding
This study was partially supported by the National Social Science Fund of China (Grant No.20BJY043). Any opinions, findings, conclusions, or recommendations expressed in this material are those of the authors and do not necessarily reflect the views of the funding agencies.
Contributions
X Y contributed to the study conception, and the interpretation of the results. Z F contributed to methodology design, reviewed, and edited the manuscript. Y C contributed to part of the figures design and drawing. X Y performed analysis and drafted the manuscript. All authors read and approved the final manuscript.
Conflicts of interest
The authors declare that they have no known competing financial interests or personal relationships that could have appeared to influence the work reported in this paper.