

Abstract
Avocado (Persea Americana Mill.) is an important tree crop and proved to be a very rewarding commercial crop for export and local consumptions. Due to high local and global market demand, avocado plantation and production is considerably increasing in many parts of Ethiopia. Thus, pre-harvest yield estimation is necessary for market planning, monitoring, and tracking long-term productivity. Though there are studies on various characteristics of avocado tree, not much has been documented about its productivity due to lack of easy and non-destructive ways to estimate yield. Hence, this study was conducted to develop cultivar-specific and mixed-cultivar fruit weight estimation models using single and multiple predictors including fruit length and diameter. We harvested and weighted 1800 fruits from five cultivars grown in 30 smallholder farmlands. The highest mean fruit load was recorded for Nabal (281 (±36 Fruit. tree−1) and Hass 249 (±27 Fruit. tree−1). A large proportion of avocado fruits were in the range that are commercially valuable. The correlation between fruit load and crown diameter were positive for each cultivar and it was stronger for Ettinger (r = 0.7, p < 0.01, n = 30), followed by Nabal (r = 0.64, P < 0.01, n = 30). We observed that fruit weight correlates significantly (P < 0.01) with fruit diameter and length. Our best models explained 80% for Ettinger, 78% for Fuerte, 80% for Hass, 63% for Nabal, 72% for Reed and 72% for multiple cultivars. Estimated yield was nearly 45 kg. tree−1 for Ettinger, Fuerte, Hass, Reed and 90 Kg. tree−1 for Nabal. The equations developed in this study are suitable for conducting pre-harvest yield estimation and monitoring changes in avocado productivity. Such information is critical for planned marketing and support government initiatives towards making horticulture sector as a possible engine for poverty alleviation and national economic growth.
Export citation and abstract BibTeX RIS

Original content from this work may be used under the terms of the Creative Commons Attribution 4.0 licence. Any further distribution of this work must maintain attribution to the author(s) and the title of the work, journal citation and DOI.
1. Introduction
Avocado tree (Persea americana) is a tropical tree species with three horticultural races [1]. Worldwide, avocado trees are cultivated in countries with tropical and Mediterranean climates [2]. It has many socioeconomic, ecological and environmental benefits and contributes to income, food and nutrition requirements of households, communities, and livestock through provision of fruits, fodder and shade [3–6]. It also contributes to mitigate and adapt to climate change impacts through absorbing atmospheric carbon dioxide and improving the soils and microclimate conditions, leading to sustainable and increased food production [3, 5, 7]. It is also proved to be a very profitable commercial crop for both export and local consumption [6, 8, 9].
In Africa, the introduction of avocado plantations dates back to the 17th century [10]. Meanwhile, Kenya and South Africa are prominent African countries in earning foreign exchange from export of avocados to the global market [11]. Avocado was introduced around 1938 in the eastern and southern regions of Ethiopia and has been widely planted throughout the country, particularly around the homestead [12]. A report showed that Ethiopia is one of the top five avocado-producing countries in sub-Saharan Africa (SSA) and the 20th in the world [13], where about 2 million smallholder farmers are currently involved in avocado production.
Worldwide, avocado fruit is recognized as a 'superfood' and becoming an essential profitable crop to be traded at a local, regional and global scale [14, 15]. Avocados are farm-to-market food that do not require processing, preservatives or taste enhancers [16]. A recent study showed that the global avocado market is projected to show 6% annual increment until 2026 and is estimated to reach an overall value of US$22 billion by 2026 [17]. The export and import prices of avocado considerably vary by country of origin and destination. Ethiopian avocados have fetched high prices but are limited in volume compared to Kenya and South Africa [9, 18]. For example, the export value of Kenya's avocado has reached 137.8 million USD in 2017 [13, 19], while Ethiopia earned only 165,000 USD [20].
The increasing trend of global demand for avocado is providing new opportunities for those that are still in the process of establishing national capacities towards the horticultural sector, including Ethiopia [9, 12]. Although Ethiopia has large land size with favourable agroclimatic conditions to produce avocado fruits for domestic consumption and export markets [4, 9], little consideration has been given to the expansion and production of avocado in Ethiopia. Nonetheless, the consumption of avocado is growing throughout the country as people started to use it in different forms, including edible oil. Thus, it has becoming one of the most important fruit crops for food and nutrition security as well as earning economic return from export and domestic market [8, 9].
With high local and global market demand, coupled with government initiatives to make the horticulture sector a possible engine of growth, avocado production is considerably increasing over the last few years across different parts of Ethiopia. Thus, pre-harvest yield estimation is necessary for market, planning monitoring, and tracking long-term productivity [1]. However, information on avocado production and productivity falls behind what is required. The main reason for such data scarcity is lack of easy and non-destructive ways to determine fruit weight while it is on the tree. Hence, the study was conducted to develop cultivar-specific and mixed-cultivar fruit weight estimation equations for widely available avocado varieties based on their measurable fruit parameters and to recommend the best fruit weight estimation models for the study region.
2. Material and methods
2.1. Study area and climate characteristics
The study was conducted in the Upper Gana (7° 34' 24' N, 37° 46' 4'E) and Jewe (7° 30' 35' N, 37° 47' 1') Kebeles. A Kebele is the smallest administrative unit of Ethiopia, similar to a Ward or Village. These kebeles are located in Gembora and Limu districts, respectively found in Hadiya zone, Ethiopia [1]. The study area is located 223 km south of Addis Ababa. The elevations of Jewe and Upper Gana Kebeles range between 2000 and 2400 m a.s.l (figure 1). The study districts have an estimated total population of 153,783, of whom 75,819 were males and 77,921 were females. 93% of the population lives in rural areas practicing subsistence farming depending on rainfed production systems [21].
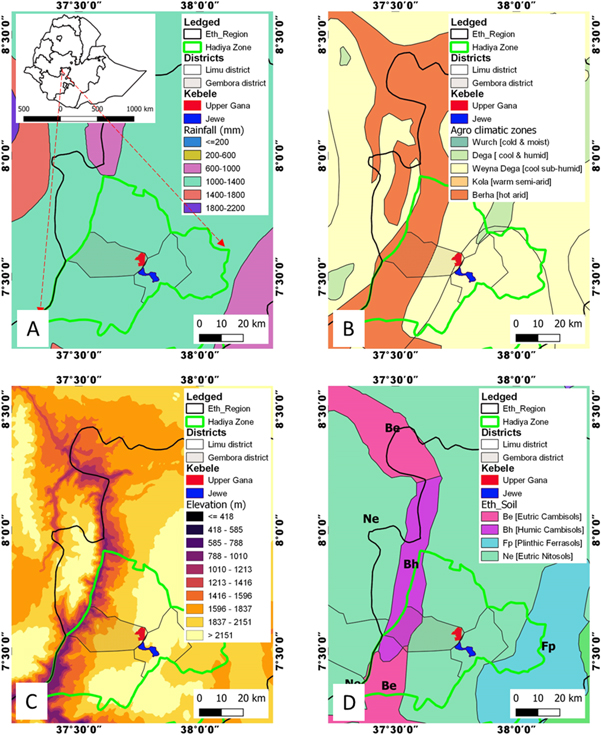
Figure 1. The specific study area in Ethiopia and rainfall distribution (A), Agro-ecology (B), Elevation (C) and Soil characteristics (D) of the study region.
Download figure:
Standard image High-resolution imageEthiopia is endowed with diverse agroclimatic zones [22]. In the study area, the annual rainfall varies between 1300 and 1400 mm with a bi-modal rainfall pattern. The length of the rainy seasons spans from February to April and from June to September. The average annual minimum and maximum temperatures were 18 °C and 23 °C [1]. Agroforestry- mixed crop-tree-livestock production is the main farming system in the district. Tree growing as a woodlot is also common practice around homesteads. The district has favourable climate and agroecological conditions for multi-strata agroforestry and home garden intensive farming systems. The average farm size per household was estimated to be around 0.5 ha [1]. The dominant soil type, in general, is classified as 'Nitisol', which has favourable moisture-storage capacity and aeration (figure 1(D)).
2.2. Vegetation and fruit data collection
In June 2014, the World Agroforestry (ICRAF), as part of Africa Rising Project, established on-farm/backyard avocado trials in the Upper Gana and Jewe Kebeles of Gembora and Limu districts. The total number of beneficiaries were 70 households/farmers from both Kebeles. The beneficiaries have received grafted high-quality seedlings of five avocado varieties, namely Ettinger, Fuerte, Hass, Nabal, and Reed (figure 2). We used purposive sampling approach and randomly selected 15 households/farmers, who have all the study avocado cultivars from each Kebele (total = 30 households).
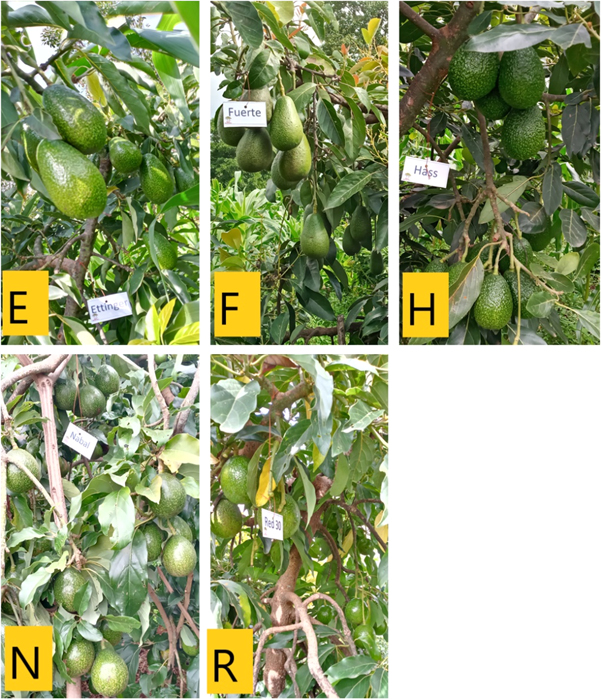
Figure 2. Photographic description of the studied avocado cultivars. The letters in figure 2, refers to Ettinger (E), Fuerte (F), Hass (H), Nabal (N), Reed (R).
Download figure:
Standard image High-resolution imageThen, fruit samples were collected from 30 individual trees per cultivar following the method described in previous studies [23]. Twelve sample fruits were randomly harvested from each trees (i.e., three sample fruits per radii). In total, 360 sample fruits were randomly collected from each cultivar - representing 30 different smallholder farm plots. Fruit length (FL in mm), diameter (FD in mm) and weight (FW = weight per individual fruit in g) were measured using a digital calliper and scale, respectively.
We also recorded tree dendrometric characteristics including stem diameter below union (DBU in cm), crown diameter (CD in m), and total tree height (H in m). DBU, CD, and H were measured using diameter tape, measuring tape and graduated stick/stiff measuring. Fruit load (FLO = is the total number of fruits per tree) was recorded through a complete manual counting approach using four people at a time [24]. To minimize fruit counting error, we first divide the canopy area into four sections using coloured rope, then each quarter of the canopy area was allocated for each person for fruit counting and the total was obtained by adding the total number of fruits recorded in each quarter of the canopy.
Canopy volume was calculated using the formula CV = 4/6*π*H*(CW/2)2, where CV is canopy volume, H is tree height, and CW is tree canopy width [25, 26]. During data collection (i.e., June 2020), all sample trees were six years of age and in the 3rd round of fruiting. Avocado tree with age less than four is considered young, while from 6/7 years onwards it is considered adult and fully productive [27]. Avocado stabilizes its production at 10–15 years of age and may continue to produce for up to 50 years [27]. Therefore, our sample trees were in the early stage of being adult and fully productive.
2.3. Fruit weight estimation models and cross-verification test
Sixteen models were developed using linear and non-linear regression equations based on either fruit diameter (FD), fruit length (FL) alone, or both FL and FD at the same time as independent predictors (table 1). Using two independent variables may sometime introduce potential problems of co-linearity. This may lead to a high degree of errors in the estimates of regression coefficients [28]. Thus, we performed a multicollinearity test using Variance Inflation Factors (VIF = 1/(1-r2) [29, 30] and the Tolerance Values (T = 1/VIF) [31]; where r is the correlation coefficient between length and diameter of avocado fruit. VIF value exceeding 10 or if T value was smaller than 0.10 then co-linearity may have a considerable impact on the prediction of the parameters [29–31].
Table 1. Tested model forms to predict fruit weight of five avocado cultivars.
| Model No. | Model forms |
|---|---|
| M1 | FW = a*FD + b |
| M2 | FW = a*FL + b |
| M3 | FW = a*FD^2 |
| M4 | FW = a*FD^b |
| M5 | FW = a*FL^b |
| M6 | FW = a + b*FL + c*FD |
| M7 | FW = a*(FL*FD)^b |
| M8 | FW = a*(FL*FD)^2 |
| M9 | FW = a*(FL^2*FD)^b |
| M10 | FW = a*(FL*FD^2)^b |
| M11 | FW = a*(FL^b)*(FD^c) |
| M12 | FW = a*(FL^2)*(FD^b) |
| M13 | FW = a*(F^b)*(FD^2) |
| M14 | FW = a*FD + b*FD^2 + c |
| M15 | FW = a*FL + b*FL^2 + c |
| M16 | FW = a + b*FL + c*FD + d*FL^2 + e*FD^2 + g*FL*FD |
Model cross-validation was conducted following a split-sample approach by randomly dividing sample fruits into two equal parts [1, 32]. Consequently, both halves of the dataset (hereafter, P1 & P2: n = 180 each for cultivar-specific model, and n = 900 for mixed-cultivar model) were used for model calibration and validation test. Finally, the full dataset was used to build fruit weight estimation models.
Model performance was tested using various goodness-of-fit statistics, such as the Coefficient of Determination (R2), Standard Error of Estimate (SEE), Index of Agreement (D), Mean Absolute Bias (MAB), Percent Bias (PBIAS), Root Mean Square Error (RMSE), Prediction Residuals Sum of Squares (PRESS), Reduction of error (RE) and Coefficient efficiency (CE) [28, 32]. The estimation models with higher R2 may have unstable parameter estimates. Thus, we further calculated Percent Relative Standard Error (PRSE) of the coefficients to check the stability of model parameter estimates [28]. Outlier and influential diagnostic test statistics, including Cook's distance, Leverage point, Studentized Residuals and DFFITS were analysed to examine the accuracy of model fit [28].
Values of R2 and Di approaching 1.0 indicate a very good agreement between observed and predicted values. The RE and CE statistics are widely used as metrics of model validation skill, and a positive value of CE and RE is generally considered as an acceptable level of model predictive performance. The optimal value of PBIAS is 0.0; however, a model can be considered satisfactory if PBIAS ≤ ±10. A model is likely to be unreliable when PRSE value is greater than 20% for one or more parameters. Moreover, if outliers and/or leverage points constitute >10% of the entries, model parameters are likely to be unreliable. Therefore, models were evaluated and ranked based on all goodness-of-fit statistics, outlier, and influential diagnostic statistics [1, 32]. We also compared the performance of each of selected best cultivar-specific model as well as model developed elsewhere to estimate fruit weight of other avocado cultivars. Finally, we used our best model to convert measured fruit biometric data to FW, and the total yield (Kg per-tree) was estimated by multiplying mean fruit weight and fruit load.
2.4. Yield Estimation and yield efficiency
Preharvest fruit yield estimation (i.e., fruit yield is the amount of fruit product in Kg per−1 tree or Kg ha−1) is critical for strategic market planning for both small-scale farmers and large-scale farming companies. Therefore, the total yield was estimated by multiplying mean fruit weight by the total number of fruits per tree (fruit load) [33, 34]. In addition, we calculated yield efficiency (kg m−3) by dividing the yield for an individual tree by its respective canopy volume.
2.5. Statistical analysis
Pearson correlation tests were conducted to identify which fruit (i.e., FL, FD) and vegetative biometric variables (i.e., DBU, CD, H) were most strongly correlated with fruit weight (FW) and fruit load (FLO). A correlation analysis was also conducted between independent variables (i.e., FL, FD, DBU, H, CD and FLO). The differences among avocado varieties in FL, FD, FW, and FLO were assessed using one-way analysis of variance and the significance of differences were tested using the least significant difference test (LSD) with P < 0.05.
3. Results
3.1. Vegetative and fruit characteristics of avocado trees
The studied avocado varieties and their vegetative and fruit characteristics are presented in tables 2 and 3. The variations in measured vegetative and fruit parameters were not significant (P > 0.05) between sites (tables 2, 3), but most of them have showed significant differences between cultivars (figure 3). Tree height, diameter and canopy size of the studied avocado varieties were ranging from 1.8–5.5 m, 8.9–25.8 cm, and 1.5–5.9 m, respectively (table 2). The mean (±SE) fruit loads per tree were 177 (± 23) for Ettinger, 179 (±15) for Fuerte, 249 (±27) for Hass, 281 (±36) for Nabal, and 186 (±19) for Reed.
Table 2. Summary of vegetation characteristics of five avocado cultivars.
| Jewe Kebele | Stem diameter (cm) | Tree height (m) | Crown diameter (m) | |||
|---|---|---|---|---|---|---|
| Variety | Mean [±SE] | Range | Mean [±SE] | Range | Mean [±SE] | range |
| Ettinger | 12.6 [0.6] | 8.9–17.2 | 3.8 [0.2] | 2.9–50 | 3.3 [0.2] | 2.2–4.7 |
| Fuerte | 16.1 [0.9] | 12.1–23.9 | 3.9 [0.1] | 2.9–4.8 | 4.3 [0.1] | 3.6–4.8 |
| Hass | 13.8 [0.7] | 9.6–20.1 | 3.8 [0.1] | 2.8–4.8 | 3.5 [0.2] | 2.5–4.8 |
| Nabal | 14.1 [0.9] | 8.0–22.1 | 4.1 [0.3] | 2.4–5.6 | 3.7 [0.2] | 1.8–5.6 |
| Reed | 12.0 [0.4] | 8.6–13.7 | 3.2 [0.1] | 2.1–4.2 | 3.0 [0.2] | 1.5–4.0 |
| Upper Gana Kebele | Stem Diameter (cm) | Tree height (m) | Crown diameter (m) | |||
| Variety | Mean [±SE] | Range | H [±SE] | Range | CD [±SE] | Range |
| Ettinger | 15.0 [0.7] | 10.5–19.1 | 4.2 [0.1] | 3.4–5.5 | 3.4 [0.2] | 2.2–4.4 |
| Fuerte | 18.2 [0.8] | 11.1–22.0 | 3.9 [0.2] | 2.7–5.6 | 4.6 [0.2] | 3.4–5.9 |
| Hass | 15.8 [1.1] | 10.2–25.8 | 3.5 [0.2] | 1.8–5.0 | 3.8 [0.2] | 2.2–5.6 |
| Nabal | 17.4 [0.9] | 10.2–23.9 | 4.4 [0.3] | 3.1–6.3 | 4.2 [0.3] | 2.0–5.8 |
| Reed | 13.5 [0.8] | 9.1–20.1 | 3.6 [0.2] | 2.7–5.6 | 2.9 [0.1] | 1.9–4.0 |
Table 3. Summary of fruit size, weight, and load characteristics of five avocado cultivars.
| Jewe Kebele | Fruit length (mm) | Fruit diameter (mm) | Fruit weight (g) | Fruit load (count) | ||||
|---|---|---|---|---|---|---|---|---|
| Variety | Mean [±SE] | Range | Mean [±SE] | Range | Mean [±SE] | Range | Mean [±SE] | Range |
| Ettinger | 108.4 [1.0] | 72.5–150 | 66.8 [0.4] | 48.6–80.16 | 234.0 [4.3] | 96–390 | 195.3 [40.8] | 17–527 |
| Fuerte | 102.6 [0.8] | 72.1–136.68 | 65.9 [0.6] | 47.3–85.6 | 227.7 [3.6] | 121–375 | 180.5 [25.1] | 67–450 |
| Hass | 85.0 [0.5] | 60.9–100.29 | 61.4 [0.5] | 40.2–93.35 | 161.8 [2.5] | 86–340 | 274.1 [39.8] | 87–597 |
| Nabal | 93.6 [0.5] | 75.6–113.5 | 82.6 [0.4] | 63–96.04 | 326.5 [4.8] | 196–530 | 282.0 [46.0] | 20–724 |
| Reed | 81.9 [0.6] | 62.2–107.57 | 72.0 [0.5] | 57.5–94.13 | 236.5 [4.5] | 145–519 | 213.8 [29.8] | 27–423 |
| Upper Gana Kebele | Fruit length (mm) | Fruit diameter (mm) | Green fruit weight (g) | Fruit load (count) | ||||
| Variety | Mean [±SE] | Range | Mean [±SE] | Range | Mean [±SE] | Range | Mean [±SE] | Range |
| Ettinger | 110 [0.8] | 86.3–134.8 | 70.5 [0.5] | 45.4–95.5 | 253.8 [3.4] | 151–379 | 159.0 [22.9] | 18–367 |
| Fuerte | 105 [0.8] | 79.8–150.0 | 68.6 [0.5] | 42–84.2 | 237.8 [4.1] | 142–367 | 178.1 [19.3] | 50–338 |
| Hass | 91.2 [1.0] | 64.6–120.1 | 66.5 [0.6] | 40.3–93.01 | 206.5 [4.3] | 112–350 | 223.8 [35.3] | 50–482 |
| Nabal | 92.6 [0.8] | 70.4–117 | 82.0 [0.8] | 60.9–100.92 | 308.1 [7.4] | 140–600 | 280.1 [55.8] | 25–741 |
| Reed | 78.8 [0.9] | 48.5103.6 | 72.6 [0.6] | 49.2–92.54 | 238.4 [6.2] | 100–486 | 157.2 [22.3] | 44–340 |

Figure 3. The observed variation in measured vegetative and fruit parameters of five avocado cultivars.
Download figure:
Standard image High-resolution imageThe fruit size-class distribution profiles showed that more than 85% of FL and 75% of FD were found under size-classes ranging between 60 and 120 mm (figures 4(a), (b)). In line with this, 80%–99% of fruits lie under FW class between 130–385 g (figure 4(c)). Among the studied avocado cultivars, Nabal and Hass showed the highest and lowest FW, respectively (table 3). Fruit load was higher for Nabal, and followed by Hass (table 3). The correlation between FLO and CD were positive for all cultivars, and it was strongest for Ettinger (r = 0.7, P < 0.05, n = 30) and for Nabal (r = 0.64, P < 0.05, n = 30). The correlations between FW-FD and FW-FL as well as between FL and FD were significantly positive (P < 0.01) (figure 5).
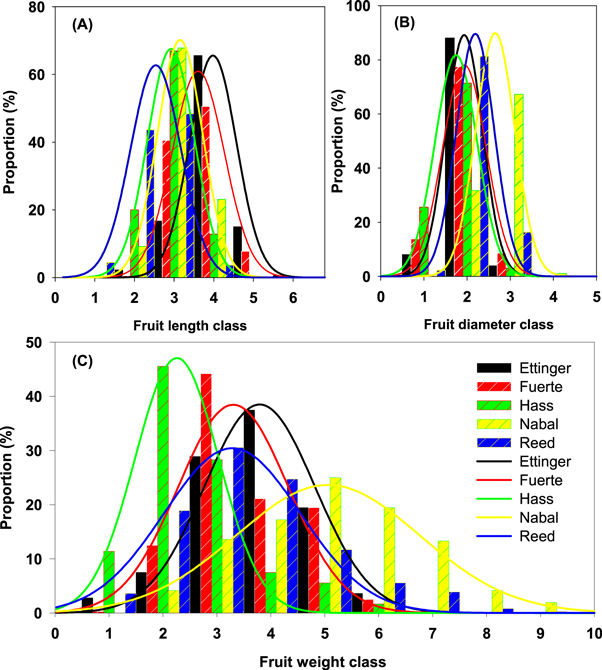
Figure 4. Fitted distribution curves for relative frequency of measured fruit size and weight of harvested fruit samples of five avocado cultivars. In figures 4(a) and (b), 1–6 refer to size class (in mm) of 40–60, 60–80, 80–100, 100–120, 120–140, and 140–160 mm, respectively. In figure 4(c), 1–10 refer to fruit weight class (in g) of 80–130, 131–181, 182–232, 233–283, 284–334, 335–385, 386–436, 437–487, 488–538, and 539–600 g fruit−1), respectively. Relative frequency = the proportion of observed avocado fruit under each size and weight class relative to the total number of observations.
Download figure:
Standard image High-resolution image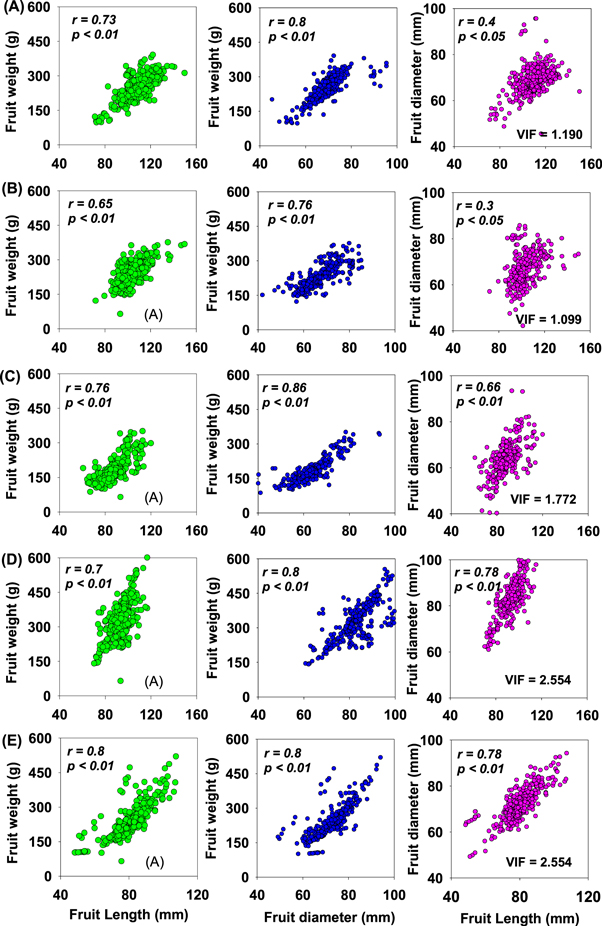
Figure 5. The weight of harvested fruits from five avocado varieties (A–E) as a function of fruit length (left panel) and fruit diameter (middle panel) as well as the regression of fruit diameter as a function of fruit length (the right panel). A–E refer to Ettinger, Fuerte, Hass, Nabal and Reed cultivars, respectively.
Download figure:
Standard image High-resolution image3.2. Model goodness-of-fit and cross-validation
The collinearity test among independent variable showed that VIF was < 10 and T was > 0.10, for all studied avocado cultivars (Supplementary Information (SI). This indicates that the co-linearity between independent variables is insignificant Therefore, both predictors, i.e., fruit length and fruit diameter were considered during allometric model development.
Sixteen model forms were tested to develop a predictive model to estimate FW of five avocado cultivars. The three (3) best-performing models for each avocado cultivar are shown in table 4. In these models, the influence of coefficients was significant (P < 0.01) (table 4). Model performance analysis (table 3, Supplementary Information (SI)), as well as the cross-validation test results (SI) revealed that the Multiple Linear Regression model (M6), which combines FL and FD as predictors ranked as the best model out of the set of sixteen (16) candidate model forms. The model explained 83% for Ettinger, 78% for Fuerte, 80% for Hass, 63% for Nabal, 72% for Reed, and 72% for mixed-avocado cultivars (table 4).
Table 4. Equations and goodness-of-fit performance statistics for estimating avocado fruit weight (g/fruit) of five different cultivars.
| Model | Equations | Model parameter | Performance statistics | PRSE | Rank | ||||||||||||
|---|---|---|---|---|---|---|---|---|---|---|---|---|---|---|---|---|---|
| a | b | c | R2 | SEE | PRESS | RMSE | PBIAS | MAB | Di | RE | CE | a | b | c | |||
| Ettinger | |||||||||||||||||
| M6 | a + b*FL + c*FD | −313.622*** | 2.231*** | 4.572*** | 0.83 | 21.4 | 162942.9 | 11.7 | 0 | 14.38 | 0.95 | 0.99 | 0.83 | −4.2 | 4.7 | 3.9 | 1 |
| M14 | a*FD + b*FD^2 + c | 25.275*** | −0.135*** | −848.738*** | 0.69 | 29.1 | 302908.3 | 20 | −0.01 | 21.55 | 0.9 | 0.99 | 0.69 | 8.8 | −11.6 | −9.4 | 2 |
| M7 | a*(FL*FD)^b | 0.007*** | 1.176*** | — | 0.83 | 21.9 | 171006 | 11.6 | −0.03 | 15.2 | 0.95 | 0.99 | 0.83 | 28.4 | 2.7 | 3 | |
| Fuerte | |||||||||||||||||
| M6 | a + b*FL + c*FD | −304.699*** | 2.366*** | 4.340*** | 0.78 | 24.1 | 207114.7 | 15.5 | 0 | 17.92 | 0.94 | 0.99 | 0.78 | −5 | 5.5 | 4.1 | 1 |
| M11 | a*(FL^b)*(FD^c) | 0.008*** | 1.030*** | 1.316*** | 0.8 | 23.3 | 193425.6 | 15 | 0.45 | 17.12 | 0.94 | 0.99 | 0.8 | 27.6 | 5 | 3.9 | 2 |
| M7 | a*(FL*FD)^b | 0.007*** | 1.180*** | 0.79 | 23.6 | 200856.4 | 15.2 | 0.77 | 17.68 | 0.94 | 0.99 | 0.79 | 28.4 | 2.7 | 3 | ||
| Hass | |||||||||||||||||
| M6 | a + b*FL + c*FD | −227.415*** | 1.654*** | 4.155*** | 0.8 | 23.1 | 190967.9 | 17.6 | 0 | 16.31 | 0.94 | 0.99 | 0.8 | −4.8 | 9 | 5 | 1 |
| M14 | a*FD + b*FD^2 + c | −7.937*** | 0.106*** | 253.416*** | 0.78 | 24.1 | 208020.9 | 18.4 | −0.07 | 17.49 | 0.94 | 0.98 | 0.78 | −18.9 | 11 | 19.1 | 2 |
| M3 | a*FD^2 | 0.044*** | — | — | 0.77 | 25 | 224365.7 | 19.2 | −0.14 | 17.98 | 0.93 | 0.98 | 0.77 | 0.7 | 3 | ||
| Nabal | |||||||||||||||||
| M6 | a + b*FL + c*FD | −364.699*** | 2.080*** | 5.933*** | 0.63 | 51.6 | 949631.6 | 41.4 | 0 | 37.88 | 0.88 | 0.98 | 0.63 | −7.9 | 19.8 | 8.7 | 1 |
| M1 | a*FD + b | 7.690*** | −315.693*** | — | 0.61 | 52.8 | 999432.2 | 41.8 | 0 | 39.07 | 0.87 | 0.97 | 0.61 | 4.3 | −8.6 | 2 | |
| M3 | a*FD^2 | 0.046*** | — | — | 0.6 | 53 | 1007153.3 | 42.1 | −0.15 | 39.79 | 0.86 | 0.97 | 0.6 | 0.9 | 3 | ||
| Reed | |||||||||||||||||
| M6 | a + b*FL + c*FD | −345.812*** | 3.298*** | 4.400*** | 0.72 | 38.41 | 526555.7 | 34 | 0 | 23.13 | 0.92 | 0.98 | 0.72 | −5.89 | 9.52 | 10.17 | 1 |
| M14 | a*FD + b*FD^2 + c | −24.841*** | 0.227*** | 834.425*** | 0.7 | 40.02 | 571841.9 | 34.8 | 0.11 | 23.83 | 0.91 | 0.97 | 0.7 | −15.54 | 11.71 | 16.74 | 2 |
| M2 | a*FL + b | 5.703*** | −220.860*** | — | 0.65 | 43.25 | 669732.4 | 36.5 | 0 | 30.18 | 0.88 | 0.97 | 0.65 | 3.88 | −8.11 | 3 | |
| Mixed_spp | |||||||||||||||||
| M6 | a + b*FL + c*FD | −345.812*** | 3.298*** | 4.400*** | 0.72 | 38.4 | 526555.7 | 34 | 0 | 23.13 | 0.92 | 0.98 | 0.72 | −5.9 | 9.5 | 10.2 | 1 |
| M14 | a*FD + b*FD^2 + c | −24.841*** | 0.227*** | 834.425*** | 0.7 | 40 | 571841.9 | 34.8 | 0.11 | 23.83 | 0.91 | 0.97 | 0.7 | −15.5 | 11.7 | 16.7 | 2 |
| M2 | a*FL + b | 5.703*** | −220.860*** | — | 0.65 | 43.3 | 669732.4 | 36.5 | 0 | 30.18 | 0.88 | 0.97 | 0.65 | 3.9 | −8.1 | 3 | |
The cross-validation test showed that model estimates were stable for the test and validation data set (figure 6, SI (available online at stacks.iop.org/ERC/4/075013/mmedia)). The parameter estimates for the coefficients a, b and c for model M6 using the two halves (P1 & P2) of the dataset showed negligible differences from those parameter estimates using the full dataset (SI). The PRSE, the regression and influence diagnostic analysis further confirmed that parameter estimates were stable and reliable for model M6 (table 4, SI). Moreover, estimated avocado FW of the cross-validation dataset (P1 or P2) estimated by model M6 using the training dataset, showed negligible differences compared to fruit weight estimated using the 'full dataset' (figure 6). The deviations (PBIAS%) of estimated averages from observed average FW were less than a percent (PBIAS < 1%) using the training data set (P1 or P2) and the full data equations of our best model (M6) (SI). In line with this, the correlation between observed and estimated FW was significant (R2 = 0.999, P < 0.001) for all studied avocado cultivars (figure 6).
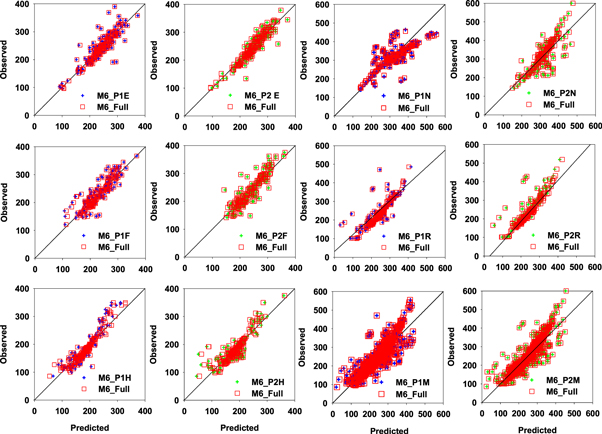
Figure 6. Relationships between predicted and observed fruit weight of cross−validation 'test' datasets for each and multiple cultivars. The square is the fruit weight predicted using the full dataset equation (M6_Full) and the crosses are the estimates calculated using the cross-validation 'training' dataset (M6_P1& P2) equation. The diagonal line represents a 1:1 line between observed values. In figure 6, the letter E, F, H, N, R, and M, refers to Ettinger, Fuerte, Hass, Nabal, Reed and Mixed cultivars, respectively.
Download figure:
Standard image High-resolution image3.3. Comparison of fruit weight estimation models and yield estimation
Cultivar-specific fruit estimation models showed the lowest mean relative error (PBIAS %) compared to the error produced using models developed for other cultivars as well as for mixed cultivars (table 5). The equations developed for Ettinger, Fuerte and Hass produced relatively large errors in estimating FW of Nabal and Reed cultivars and the reverse is also true (table 5). On the other hand, the model developed for Ettinger, Fuerte and Hass can be used to estimate FW on one another with the range of error (PBIAS %) between 1.5% and 3.8% (table 5). In line with this, the mixed-cultivar estimation model provided less amount of error, ranging from 0.6% to 3.8%, which is closer to cultivar-specific model when used to estimate fruit weight of all the studied avocado varieties (table 5). Moreover, we compared our best model (PBIAS% = −0.002%) with that of Lahav and Zamet [35] developed for Hass cultivar only. When applied to our dataset, Lahav and Zamet [35] models resulted in a higher estimation error (PBIAS %) which is ranging between −3.41% and 13%, for models developed using one or more predictors, including fruit length (FL) and fruit circumference (FC) [35].
Table 5. Model comparison in estimating fruit weight from easily measurable fruit parameters. The negative and positive values indicated an over and underestimation.
| PBIA (%) Estimation Models | ||||||
|---|---|---|---|---|---|---|
| Cultivars | Fuerte- M6 | Hass-M6 | Nabal-M6 | Ettinger-M6 | Reed-M6 | Mixed Spp-M6 |
| Fuerte | 0.0002 | 3.8745 | −7.476 | 3.132 | −25.5905 | −0.5899 |
| Hass | 1.4985 | −0.0019 | −7.5453 | 3.132 | −22.8123 | −3.8558 |
| Nabal | 14.0054 | 15.3266 | 0.0014 | 14.7445 | 14.7445 | −1.9207 |
| Ettinger | −3.1557 | 2.2215 | −10.5656 | −0.0002 | −29.675 | −2.702 |
| Reed | 16.0304 | 13.1981 | 2.4699 | 17.2709 | −0.0005 | 2.9835 |
Total yield per tree was estimated by multiplying estimated mean with fruit weight by fruit load. The mean yield of each cultivar was about 45 kg tree−1 for Ettinger, Fuerte, Hass, and Reed and it was about 90 kg tree−1 for Nabal (table 6). The result showed that about 63%, 76%, 50%, 67% and 87% of Ettinger, Fuerte, Hass, Reed and Nabal trees in the data set yielded between 20 and 60 kg tree−1 and >40 kg tree−1, respectively (table 6). Canopy volume and yield efficiency ranged from 16–41 m2. tree−1 and 1.0–3.8 kg. m3 (table 6).
Table 6. Estimated yield, canopy volume and yield efficiency of five different avocado cultivars.
| Cultivars | No. tree | Yield per tree (kg tree−1) | Canopy volume (CV) and Yield efficiency (YE) | Proportion (%) of trees under each yield category (Kg) | ||||||
|---|---|---|---|---|---|---|---|---|---|---|
| Mean (SE) | Median | Rang | CV (m3) | YE (kg m–3) | < 20 | 20–40 | 40–60 | >60 | ||
| Ettinger | 30 | 43.2 [±5.7]a | 41.6 | 4.1–128.5 | 24.7 [±2.1]ac | 1.8 [±0.2]ab | 20.0% | 26.7% | 36.7% | 16.7% |
| Fuerte | 30 | 41.7 [±3.6]a | 39.7 | 11.6–104.8 | 41.0 [±2.5]b | 1.0 [±0.1]a | 6.7% | 40.0% | 36.7% | 16.7% |
| Hass | 30 | 45.8 [±4.9]a | 41.9 | 9.2–109.9 | 27.4 [±2.7]a | 1.9 [±0.2]ab | 20.0% | 26.7% | 23.3% | 30.0% |
| Nabal | 30 | 89.2 [±11.3]b | 73 | 6.3–235.1 | 37.4 [±3.5]b | 2.9 [±0.4]bc | 13.3% | 0.0% | 23.3% | 63.3% |
| Reed | 30 | 44.0 [±4.5]a | 38.7 | 6.4–100.4 | 15.9 [±1.2]c | 3.8 [±0.7]cd | 16.7% | 30.0% | 36.7% | 16.7% |
4. Discussion
4.1. Avocado tree vegetative and fruit characteristics and their relationships
During data collection (June 27–July 15, 2020), the studied avocado cultivars (Ettinger, Fuerte, Hass, Nabal, and Reed) were 6 year-old and in the 3rd fruiting phase. The trees were owned by smallholder farmers and mostly planted as a form of Homesteads agroforestry system. The vegetative characteristics of avocado trees, including H, DBU, and CD were not significantly different across sites (table 1). This might be explained by the similarity in age, agroecological and climatic conditions of the sites where they were planted. Congruent to our findings, Gregoriou and Economides [36] reported statistically insignificant growth variations between Hass, Ettinger, and Fuerte cultivars grown for twelve years under similar management conditions.
Tree height, diameter and canopy spread were ranging from 2–5.6 m, 8–26 cm and 1.5–6.0 m, respectively, and were smaller compared to values reported for non-grafted avocado trees [4, 37]. It has been reported that avocado trees with height of less than 5 m are easier to manage for farmers and more productive than taller trees [38]. We found that the highest fruit load for Nabal (281) and Hass (249) compared to about 180 fruits for Ettinger, Fuerte and Reed. In agreement with our results, another study has reported that an avocado tree can produce 200 to 300 fruits per tree once it is about 5 to 8 years of age [39].
The productivity (total fruit load) of avocado trees showed positive but insignificant correlations with tree height and stem diameter. However, the relationship between canopy width and fruit load was statistically significant (P < 0. 05). Other studies conducted in Ethiopia and elsewhere also reported positively weak relationships between FLO-H, FLO-D, but significant relationships between FLO and CD [4, 5, 38, 40]. The significant correlation between canopy size and productivity indicates that a wider canopy could play a potential role in intercepting a higher percent of incident light, which eventually enhances more fruit settings. Thus, canopy management is a key factor to maximize light interception and productivity [38, 41]. The lack of an appropriate method to manage canopy size might lead to the trees crowding out each other, thereby reducing orchard productivity [38, 42].
The highest/lowest mean values of fruit length, diameter and weight were recorded for Ettinger (109.2 mm)/Reed (80.4 mm), Nabal (82.3 mm)/Hass (64.8 mm), and Nabal (317.3 g)/Hass (184 g), respectively. This finding is in agreement with other studies conducted under Mediterranean coastal conditions [43]. Fruit weight more closely correlates to fruit diameter than to fruit length (figure 5). Similar results were reported by Lahav and Zamet [35], indicating that fruit diameter growth considerably affects the fruit weight more than a change in fruit length [44]. We observed insignificant variations in the length, diameter, and weight of fruits within cultivars grown across different locations in the district. This might be explained by conduciveness of the microenvironment as well as the presence of similar agroecological and climatic conditions at larger spacial scales. Avocado fruit size-class distribution profiles showed that most (> 80%) of fruit length and diameter were found in the same ranges of diameter and length between 60 and 120 mm. This was in agreement with results of Janice et al., [37]. Approximately, 80%–99% of fruits lie under fruit weight class between 130–385 g, indicating that a large proportion of avocado fruits were in the range that is commercially valuable [45–47].
4.2. Cultivar-specific and multi-species fruit weight estimation models and their performances
The estimated versus measured avocado fruit weights were plotted and the values were closely distributed alongside the 1:1 line (figure 6). The predictive performance of tested models using the full dataset were ranging from 52%–84% for Ettinger, 41%–81% for Fuerte, 49%–88% for Hass, 30%–63% for Nabal, 54%–79% for Reed, and 20%–79% for mixed-species models (table 4, Supplementary Information (SI)). The observed variation in model performances might be ascribed to variations in model forms and predictors included in the models. Based on cross-validation and performance statistics test, the multiple linear regression model (M6) that included fruit length (FL) and diameter (FD) as predictors performed best from the given set of model forms for all cultivar-specific as well as for generalized mixed cultivar models (table 4, SI).
Our best model (M6) passed all rigorous verification and cross-validation statistical test, and delivered the lowest mean relative error, implying that using fruit length and diameter together as predictor increases model robustness. In addition, the performance of our best model to make an accurate prediction is not an artifact of overfitting, because the parameter values in the regression equations and cross-validations were stable across subsets of the 'test' dataset for our best model (SI). Moreover, the PRSE value of < 20% and outliers and influential points of less than 10% of the total observation as well as higher positive value of CE, and RE provide evidence that the parameter estimates were reliable in model M6 [28, 48, 49]. Thus, M6 is can reliably be used to determine the fruit weight based on their easily measurable fruit dendrometric parameters. Other studies reported the possibility of getting fruit weight from fruit diameter and length measurement while it is on the tree [1]. For example, for avocado [35, 44], for blueberry fruit [50], for Banana [51], for apple [52, 53] and for Peach palm fruit [54]. Therefore, the developed fruit weight estimation equations potentially enable different experts engaged in horticultural sectors to carry out avocado tree yield estimation before harvesting.
The comparison of cultivar-specific and mixed-cultivar model performance in estimating fruit weight of other cultivars showed that cultivar-specific estimation equations produced the lowest estimation error for the study area. Moreover, the equations developed for Ettinger, Fuerte and Hass produced higher magnitudes of error in estimating fruit weight of Nabal and Reed cultivars, and the reverse is also true (table 5). In general, our results highlighted that variation in fruit morphological characteristics (fruit length, diameter, shape) can affect the values of model coefficients and model performance. This can be partially justified by the finding that the models developed for Ettinger, Fuerte and Hass could also provide a reliable estimate of fruit weight when the model is used for other varieties. This might be because they have similar morphological characteristics.
The mixed-cultivar estimation model also provided an acceptable magnitude of errors when used to estimate fruit weight of all studied avocado cultivars (table 5). This generally provides additional opportunities to estimate fruit weight while fruits are still on the tree and when the type of cultivar is unknown. When applied to our dataset, the cultivar-specific Haas model developed by Lahav and Zamet [35] in Israel resulted in a PBIAS of 9.8%, whereas for our Haas-specific model M6, PBIAS was −0.002% (table 5). Therefore, site-specific estimation models are more robust compared to models developed elsewhere to convert fruit length and diameters measurements to fruit weight.
4.3. Yield estimation and socioeconomic potentials of avocado production
In the study area, the mean yield was nearly 45 kg tree−1 for Ettinger, Fuerte, Hass, Reed and it was about 90 kg tree−1 for Nabal. Among other factors, tree age, cultivar type, agroecology, management, and tree density within an orchard are important factors to influence the yield [41, 46, 55]. Other studies showed that avocado trees at age eight (8) years can provide a yield ranging from 30–100 kg tree−1 [39, 55]. Hence, our finding is in line with other research reports on the productivity of young avocado plantations [26, 41, 46, 56, 57]. Moreover, the life cycle of avocado (longevity and productive period) is long and a tree of eight years onwards is considered an adult and fully productive for a period that can extend for more than 20 or 25 years [27]. The adult orchard typically stabilizes its annual production from 80 to 100 kg of fruit per tree from 10–15 years of age [27]. Observed canopy volume and yield efficiency of the studied avocado cultivars were ranging from 16–41 m3. Tree−1 and 1.0–3.8 kg. m3, which is in agreement with other studies conducted on young (6 years) orchards of avocado cultivars [26, 40, 55]. However, productivity also varies depending on cropping density and canopy size [38, 58], and fruit production is often compromised by the intensive pruning regime required to control the growth and shape of the trees [26, 41].
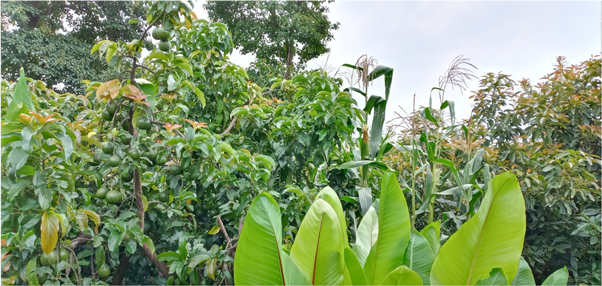
On the other hand, avocado trees across inventoried households have not been under intensive pruning because farmers were practicing the traditional agroforestry system with minimum silvicultural practices. In the study area, the main intention for pruning activity is not only for managing tree canopy but rather maximizing financial return from the sale of scion required to produce high-quality grafted seedlings. This practice, in turn, supports government efforts in implementing national programs, like National Avocado Development Program (agroberichtenbuitenland.nl). It is also important to note that avocado can be integrated with different crops, vegetables, and herbs as a multistrata agroforestry system [59] (figure 7). Moreover, avocado yield generally tends to be erratic, meaning that individual trees in the orchards may provide high or little yield within the same year, due to alternate bearing habits which are most prevalent in mature trees [46, 55]. Therefore, as several factors could determine avocado production, such as climate variability (rainfall and temperature), age, and canopy size, it might be very important and reliable if productivity is determined using data collected from more than one production period. Moreover, it is also important to determine avocado fruit edible fraction for each cultivar across different agroecological conditions. It is because such fruit morphological characteristics are also an important indicator in avocado marketing.
Figure 7. Photographic depiction of avocado agroforestry system in Ethiopia.
Download figure:
Standard image High-resolution image
The observed productivity can be said to be within commercial farming standards and is worth investing in this horticultural sector to improve and diversify household income sources, thereby alleviating poverty while improving environmental health [9, 12]. Based on our result, by planting the standard density of 400 seedlings of avocado trees per hectare [56], the farmer could produce up to 20 tons of fruits per hectare. This is by far larger compared to coffee productivity, which is ranging from 1–2 tons per hectare under different planting densities [60], and oilseeds and pulse productivity (e.g. Sesame) which is about one ton per hectare [61]. Besides, the result also highlighted that Ethiopia has a considerable potential to generate huge hard currency comparable to what the country is currently getting from coffee [9]. For instance, according to the Ethiopian Horticulture Producers and Exports Association (EHREA), Mashav which is one of the main avocado exporters in Ethiopia, exported a Kilogram of avocado for 5.7 USD to different countries in 2018 [18]. At the same time, the same amount of coffee was exported for 2.2 USD [20] and Sesame seed for 1.6 USD per Kg in 2018/19 [62].
The peak avocado production period in Ethiopia is around July and this could provide a great opportunity for the country to earn a better economic return from avocado export. This is because the world's largest avocado exporting countries such as Mexico usually supply the lowest volume to the global market in June-July. In line with this, the government of Ethiopia is currently advocating avocado industry by promoting the implementation of cluster-based avocado farming to achieve the main objectives of the National Avocado Development Program [63]. This, in turn, requires strengthening of the horticultural extension systems as well as supporting the production and dissemination of high-quality grafted seedlings of avocado for smallholder farmers. Despite the potential of avocado production for local consumption and export earnings, there are also major challenges such as transport, poor infrastructure and establishment of overseas markets. Thus, while promoting avocado plantations, it is equally important to establish transportation and storage facilities. This includes establishing a cool logistic chain because keeping fresh produce cool is crucial to serving global markets. Moreover, cold storage facilities potentially minimize post-harvest loss, preserves product quality, and increase shelf life.
5. Conclusions
This study presents both cultivar-specific and mixed-cultivar allometric equations to estimate and monitor avocado fruit weight while it is on the tree. The cross-validation results confirmed that our best model (M6) is robust and reliable to estimate fruit weight in the study region and orchards dominated by young avocado trees. We also found that site- and cultivar-specific models produced the lowest bias compared to models developed for other cultivars through this study and developed elsewhere. We also noted that the mixed-cultivar model can reliably be used to estimate fruit weight within an error ranging 0.5%–4.0% of the true mean when used to estimate fruit weight of unknown cultivars. More importantly, cultivar-specific, and mixed-cultivar fruit weight estimation models have the potential for application in other regions, where agro-ecological zones, cultivar composition/type, age of the orchards, and site characters are like our study area.
The report on fruit size distribution and yield per tree is within the standards of commercial farming system. This indicates that the country has a considerable potential to enter the global avocado market system and increase financial gain from horticultural sector. Reported yield values can also be used as a reference against which future estimates can be compared. It could also help to investigate land productivity and financial feasibility of horticultural sector investments, thereby helping inform the best way to meet economic and development objectives of the government. The model developed in this study will help to build information on the long-term productivity of avocado orchards across Ethiopia and beyond. Moreover, alternate bearing/fruit setting is one of the physiological characteristics of avocado plants, thus it might be very important to study the productivity of avocado plantations using data collected from more than one production period.
Acknowledgments
We thank the local community, district experts and local administration offices in the study area for their support during fieldwork. We thank the Africa RISING project ILRI/USAID for funding the project. The contents of this document are solely the responsibility of the author/s and does not necessarily represent the official views of ICRAF or the donor.
Data availability statement
All data that support the findings of this study are included within the article (and any supplementary files).
Authors' contributions
'A. G., as a PI designed and led the Avocado trial project. M. M., A. G., H.S., K. H., N. H., A. B., designed the study. M. M., W.D, collected the sample fruits across the study sites, performed all sample preparation and measurements. M. M., carried out the first analysis and wrote the first version of the manuscript, which was intensively discussed and revised by all authors'.
Conflict of interest
The author (s) declare no competing interests.
Data availability
The datasets generated during and/or analysed during the current study are available from the corresponding author upon request.