


Abstract
Climate change is a threat to the 500 Gt carbon stored in northern peatlands. As the region warms, the rise in mean temperature is more pronounced during the non-growing season (NGS, i.e., winter and parts of the shoulder seasons) when net ecosystem loss of carbon dioxide (CO2) occurs. Many studies have investigated the impacts of climate warming on NGS CO2 emissions, yet there is a lack of consistency amongst researchers in how the NGS period is defined. This complicates the interpretation of NGS CO2 emissions and hinders our understanding of seasonal drivers of important terrestrial carbon exchange processes. Here, we analyze the impact of alternative definitions of the NGS for a peatland site with multiple years of CO2 flux records. Three climatic parameters were considered to define the NGS: air temperature, soil temperature, and snow cover. Our findings reveal positive correlations between estimates of the cumulative non-growing season net ecosystem CO2 exchange (NGS-NEE) and the length of the NGS for each alternative definition, with the greatest proportion of variability explained using snow cover (R2 = 0.89, p < 0.001), followed by air temperature (R2 = 0.79, p < 0.001) and soil temperature (R2 = 0.54, p = 0.006). Using these correlations, we estimate average daily NGS CO2 emitted between 1.42 and 1.90 gCO2 m−2, depending on which NGS definition is used. Our results highlight the need to explicitly define the NGS based on available climatic parameters to account for regional climate and ecosystem variability.
Export citation and abstract BibTeX RIS

Original content from this work may be used under the terms of the Creative Commons Attribution 4.0 licence. Any further distribution of this work must maintain attribution to the author(s) and the title of the work, journal citation and DOI.
1. Introduction
The current rate of warming in northern boreal peatlands (≥ 45°N) is without precedent in the historical record and happens primarily during the non-growing season (NGS). This has repercussions for net ecosystem-scale carbon fluxes considering the uncertainties in carbon offsets from growing season primary productivity [1–4]. A growing body of literature has emerged alluding to substantial increases in soil carbon dioxide (CO2) and methane (CH4) emissions during the NGS [5–17]. Despite these findings, there is a lack of consistency in how the NGS is defined, with the start and end dates of the NGS in a calendar year assigned differently among studies [18].
Defining the growing and non-growing seasons is closely related to plant phenological events. For example, spring leaf unfolding and fall leaf coloring can signal the start and end of the period of photosynthetic CO2 uptake, respectively and be used to define growing season in ecosystems dominated with deciduous plant species [19]. The timing of these events correlates with interannual variations of local climatic factors as well as broader climate warming [20–22]. Globally, growing seasons are increasing in length [2, 18], which influences the ecosystem carbon balance through changes in gross primary productivity (GPP). Annual GPP is typically larger where the growing season is longer, while the longer exposure of plants to fluctuating weather conditions can lead to low rates of GPP in the late winter and early spring [2, 23–25].
Net carbon exchange between the atmosphere and boreal peatlands has been observed to be strongly seasonal, shifting from growing season biomass CO2 uptake to NGS induced soil carbon release [13, 14, 26]. Recent synthesis studies have compiled site-level carbon flux measurements but have not defined the NGS in a systematic manner. For example, in their compilation of CH4 emissions, Treat et al [12] used the NGS definition from the original studies or otherwise fixed NGS start and end dates (mid-September through May between 60°N and 90°N, and November through March between 40°N and 60°N). Natali et al [13] considered the period between October to April, regardless of site location, when extracting winter soil CO2 flux data. More recently, Virkkala et al [26] reported significantly different estimates for the total NGS carbon fluxes compared to Natali et al [13], despite matching time periods and regions. Therefore, there is a need for clear and consistent definitions of the NGS that accurately capture local ecosystem and climatic factors.
When recorded continuously, net ecosystem CO2 exchange (NEE) data can provide a straightforward indicator to separate the growing and non-growing states of the ecosystem: positive NEE indicates net CO2 release and therefore represents an overall non-growing (heterotrophic) state, negative NEE implies net CO2 fixation and biomass accumulation [9, 10, 18, 20, 24]. Most on-site carbon fluxes have been measured using flux chambers or eddy covariance (EC) towers. The vast majority of existing data cover only the summer months because of the cold temperatures and logistical difficulties during the winter, but also because at high latitudes winter flux rates tend to be a fraction of those in the summer months [5, 9, 27]. However, growing empirical evidence points to substantial accumulated ecosystem carbon release in fall, winter, and spring seasons [5–15, 26]. Hence, there is increasing research focus on measuring on-site CO2 emissions during the NGS period [14, 26].
Mer Bleue bog near Ottawa, Canada is a long-term peatland EC flux monitoring site with CO2, momentum, radiative, and energy fluxes measured since 1998. This site has been reported to have a large inter-annual variation in the fall season NEE [28]. In addition, our new compilation over more years of data (1998–2010) shows wide ranges of daily NEE rates during October and April, that is, near the beginning and end of the NGS (figure 1). This variability in daily NEE is at least in part due to interannual shifts in the start and end of the NGS [17]. As leafing events or greenness changes are not easy to monitor in the usually evergreen dominated or open vegetation of northern peatlands, climatic variables may be of more practical use to identify the ecological season transitions and reversals of the NEE direction (i.e., net heterotrophy or net autotrophy) [20–23].
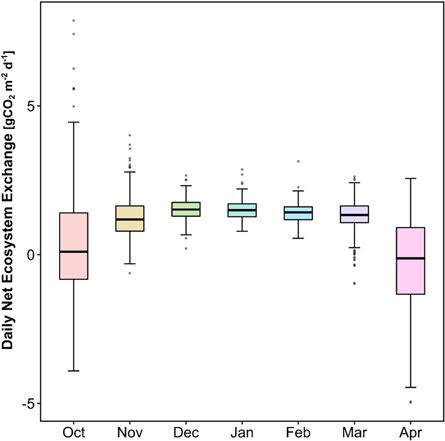
Figure 1. Boxplots of daily net ecosystem exchange (NEE) rates of CO2 grouped by month at Mer Bleue Bog. Daily NEE were estimated from a 12-year record (1998–2010) of eddy covariance measurements of CO2 extracted for the non-growing season by Rafat et al [15]. Boxes extend from the first to the third quartile with the interior horizontal line corresponding to the median. Vertical lines extend to the 1.5 times interquartile range of each box.
Download figure:
Standard image High-resolution imageIn this study, we use climate-related parameters to define the start and end dates of the NGS for the Mer Bleue Bog. To identify key environmental drivers and predict future changes in the NGS-NEE CO2 emission rates, Rafat et al [15] extracted EC data for the annual NGS periods based on the snow cover records for this site. Here, we expand on this analysis by determining how variable definitions of the NGS affect the cumulative NEE estimates for the NGS. Using a 12-year record (1998–2010) of data, we delineate the NGS period based on thresholds in snow cover, air temperature, and soil temperature.
2. Data analysis
Gap-filled estimates of NEE fluxes, soil temperatures measured at 20 cm below hummock surface, snow depths, and air temperatures at the Mer Bleue site were obtained from the Fluxnet Canada Research Network via the Oak Ridge National Laboratory's Distributed Active Archive Center for Biogeochemical Dynamics (ORNL DAAC) FlUXNET CANADA TEAM. 2016 [8]. The Mer Bleue research site is a domed ombrotrophic bog located within a larger 2800-hectare wetland complex near Ottawa, Canada [15]. Site vegetation consists of Sphagnum mosses and overstory of ericaceous shrubs. Additional site details, including details of the eddy covariance tower and flux processing methods, can be found in Rafat et al [15].
The following alternative NGS definitions were used. (1) For the air temperature definition, the start of the NGS was set as the first day of three consecutive days for which smoothed air temperatures over a 7-day sliding window fell below 1 °C, while the end coincided with the first day of three consecutive days with temperature rising above 1 °C. (2) For the snow cover definition, the presence and absence for three consecutive days of accumulated snow on the ground signaled the beginning and end of the NGS. (3) For the soil temperature definitions, three alternative threshold temperatures were considered to set the start and end dates of the NGS: 1, 2 and 5 °C. The start of the corresponding NGS was defined as the first day for which 7-day smoothed soil temperatures remained below 1, 2, or 5 °C respectively. The end of the NGS was determined as the first day when the 7-day smoothed soil temperatures exceeded 1, 2, and 5 °C, respectively. For each year within the 12-year record, only daily NEE fluxes within the specified NGS period were considered. We refer to these daily NEE fluxes as NGS-NEE. Cumulative NGS-NEE values were then calculated for each year, with these sums representing the total CO2 released or sequestered during the corresponding NGS period.
3. Results and discussion
Cumulative NGS-NEE values fluctuated significantly from year to year, with the length of the NGS varying by days to weeks between the different definitions. While we expected that the cumulative NGS-NEE values would vary depending on the length of the (definition-dependent) NGS, the exact relationships between NGS duration and cumulative NGS-NEE were unknown. For a given year, longer NGSs capture shoulder seasons which can exhibit large fluctuations between positive and negative NEE values, therefore complicating the relationship between NGS duration and NGS-NEE. No clear increasing or decreasing trend with time was observed (figure 2). Within the same year, the different NGS definitions resulted in variable cumulative NGS-NEE estimates. In general, the soil temperature threshold of 1 °C yielded larger cumulative NGS-NEE with longer durations of the NGS. For example, in 1999–2000 and 2003–2004 the NGS started earlier and ended later than when the air temperature and snow cover definitions were applied (figure 2). Similarly, the NGS end date according to the 1 °C soil temperature threshold was markedly late in the years 2006–2007, 2008–2009, and 2009–2010, which for 2006–2007 and 2008–2009 also resulted in relatively large cumulative NGS-NEE but less so for 2009–2010. In contrast, the early start of the NGS in 2002–2003 was delayed by half a month when soil temperature rather than air temperature was used to define the NGS. Thus, the results show not only that applying different climate variables to define the NGS can produce significant differences in cumulative NGS-NEE estimates, but also that imposing fixed start and end dates (e.g., from November to March as in [12]) would not capture the important inter-annual variability in the NGS period at the Mer Bleue site.

Figure 2. Inter-annual variability of cumulative non-growing season net ecosystem exchanges (NGS-NEE) (left panel). Estimates of NGS-NEE were obtained by defining the non-growing season (NGS) based on three distinct environmental variables, each represented by a unique colour. The right panel displays the differences in NGS duration and timing according to how the NGS is defined. According to a one-way ANOVA test, the difference in NGS durations between the three definitions are statistically significant (F(2,33) = 4.085, p = 0.026), likely associated with the significant difference in the NGS end date (F(2,33) = 8.13, p = 0.001).
Download figure:
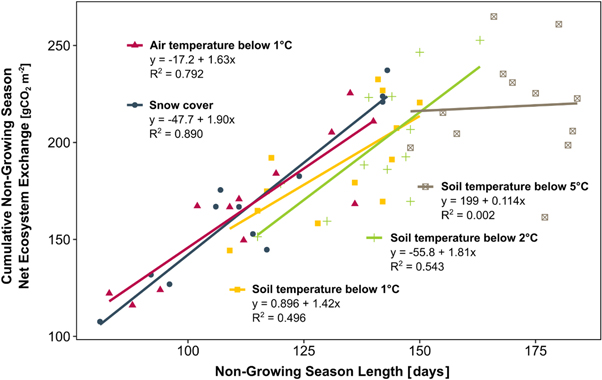
Standard image High-resolution imageAs expected, there was a general positive correlation between the cumulative NGS-NEE and the NGS length (figure 3). The greatest proportion of variability in cumulative NGS-NEE was explained by the length of the NGS for the snow cover definition (R2 = 0.89), followed by the air temperature below 1 °C (R2 = 0.79, p < 0.001), soil temperature below 2 °C (R2 = 0.54, p = 0.006), and soil temperature below 1°C (R2 = 0.50, p = 0.01). The linear regression for soil temperature below 5 °C was not statistically significant (R2 < 0.01, p = 0.88). The slopes of the linear regressions provide estimates of the average daily NGS-NEE flux at the Mer Bleue site. We refer to these values as the Non-growing Season Emissions Factors (NGS-EF). Based on the available 12-year dataset, the NGS-EF ranged from 1.42 to 1.90 gCO2 m−2 per day depending on the NGS definition.
Figure 3. Non-growing season (NGS) length and cumulative non-growing season net ecosystem exchanges (NGS-NEE) obtained using the different NGS definitions given in the text, as well as their corresponding linear regression fits.
Download figure:
Standard image High-resolution image
The NGS-EF for the meteorological winter (December, January, and February) was 1.48 ± 0.33 gCO2 m−2 per day (mean ± standard deviation, N = 1,083 by aggregating all years), similar to the NGS-EF estimated with the NGS definition based on soil temperature below 1 °C (1.42 gCO2 m−2 per day). Table 1 summarizes calculated NGS-EFs along with their linear regressions fits (R2) and statistical significance (p-values). Despite yielding the lowest NGS-EF, the soil temperature below 1 °C definition predicted the highest cumulative NGS-NEE in most years between 1998 and 2010, because it generally also produced the longest NGS durations (figure 2). The interplay between the NGS duration and NGS-EF highlights the importance of consistency when applying NGS definitions. In particular, we caution against applying NGS-EF estimates derived from a dataset based on one definition to NGS durations based on another definition given the strong relationship between cumulative NGS-NEE and NGS length.
Table 1. Summary of the linear regression analysis results according to the NGS definition.
| NGS Definition | Non-Growing Season Emissions Factor (NGS-EF) [gCO2 m−2 day−1] | Regression Fit (R2) | Pr(>∣t∣) a |
|---|---|---|---|
| Air temperatures below 1 °C | 1.63*** | 0.792 | <0.001 |
| Soil temperatures below 5 °C | 0.114 | <0.01 | 0.883 |
| Soil temperatures below 2 °C | 1.81** | 0.543 | 0.006 |
| Soil temperatures below 1 °C | 1.42* | 0.496 | 0.011 |
| Snow cover | 1.90*** | 0.890 | <0.001 |
a Probability of observing values greater than or equal to t-value.*p < 0.05, ** p < 0.01, *** p < 0.001.
The snow cover and air temperature below 1 °C definitions resulted in the strongest linear correlations between cumulative NGS-NEE and the duration of the NGS; they also span the widest ranges of both variables (figure 3). By contrast, NGS defined using soil temperatures of 1 and 2 °C produced smaller ranges of cumulative NGS-NEE and NGS length. The below 2 °C soil temperature NGS definition further yielded lower cumulative NGS-NEE values for the same NGS length than the snow cover and air temperature-based definitions. Likely, this result can be attributed to longer NGSs defined by soil temperature below 2 °C, which extend into April and capture large daily NEE fluctuations with possibly negative values (figure 1). Consequently, the regression curve (figure 3) was translated towards longer NGS lengths resulting in lower cumulative NGS-NEE in comparison to cumulative NGS-NEE obtained from the snow cover and air temperature definitions for different years but same length of NGS. When the NGS was defined by soil temperature below 5 °C, the estimated NGS period increased but a clear positive trend with the cumulative NGS-NEE was no longer observed (figure 3). In addition, for comparable NGS lengths, considerable variability was observed in the cumulative NGS-NEE estimates. The longer the NGS, the more it extends into shoulder season months increasing variability in NEE, ultimately reaching October and April for which the daily NEE fluxes oscillate between positive and negative values (figure 1).
Our results support defining NGS based on readily available climatic parameters that account for the interannual variability of regional climate and ecosystem response. For the Mer Bleue bog, the snow cover appears to provide a robust metric to estimate the cumulative NGS-NEE from the variable length of the NGS. The snow depth and coverage influence both surface and subsurface processes. Snow cover insulates the soil and, hence, protects it against extreme temperature fluctuations during the winter, while patchy snow melt can expose Sphagnum mosses to light, hence, contributing to early spring photosynthesis [16, 29]. If sufficient snow cover phenology information is not available, using an air or soil temperature threshold of 1°C may be the next best choice to flexibly delineate the NGS.
Allowing the start and end dates of the NGS to vary from year to year naturally implies a coincident adjustment of the growing season length. Further work should assess how different definitions of the NGS impact the trends between the length and cumulative NEE of the growing season [18, 23]. An informed selection of the duration of the NGS is important for quantifying the impacts of changes in the length of growing and non-growing seasons on carbon budgets and interpreting the environmental drivers regulating the seasonality of ecosystem functions [20, 25], including potential legacy effects of the growing season on soil carbon cycling during the NGS [4, 30]. In northern environments, both the growing and non-growing seasons incorporate some portion of the spring and fall transition periods when plant photosynthesis is sporadic and NEE fluxes change direction as a result of, for example, freeze and thaw cycles, blowing snow, and snow melt water pulses [14].
Rafat et al [15] projected future NGS-NEE rate increases under various radiative forcing scenarios (RCPs). To assess the impact on the cumulative NGS-NEE, these rate increases must be combined with projected changes in the NGS length. Because the rate increases remain fairly small until 2050 [15], it is conceivable that in the next few decades the cumulative NGS-NEE will not substantially increase, or even decrease if the NGS period continues to follow the same decreasing trend as over the last decade. However, the near doubling of the NGS-NEE rate in 2100 projected under RCP8.5 [15] points to the potential for an upward shift of NGS-EFs (i.e., steeper slopes in figure 3) outpacing the shortening of the NGS duration. An increase in NGS CO2 emissions during the second half of the century may in turn be compensated by higher warming-induced primary production, as well as adaptive shifts in phenology (e.g., sensitivity to photoperiod) that allow vegetation to take advantage of the lengthening of the potential growing period [31]. Further research will be needed to fully unravel the impacts of variable growing and non-growing season lengths on the NEE of northern peatlands.
Acknowledgments
Funding was provided by the Canada Excellence Research Chair (CERC) in Ecohydrology, the Advancing Climate Change Science in Canada program (ACCPJ 536050-18), the Winter Soil Processes in Transition project within the Global Water Futures (GWF) program funded by the Canada First Research Excellence Fund (CFREF), and a Natural Sciences and Engineering Research Council (NSERC) Discovery Grant (RGPIN-2015-03801).
Data availability statement
The data that support the findings of this study are openly available at the following URL/DOI: https://doi.org/10.3334/ORNLDAAC/1335.
Author contributions
A R, E B, and F R worked together in conducting the data analyses, and led the preparation of the paper. E R H, P V C, W L Q and K W discussed the results and contributed to writing and reviewing the paper and have approved the final version.
Competing interests
All authors declare no competing interests.