

Abstract
Highly sensitive and selective gas sensors with low energy consumption and amenable to miniaturization are required for real-time gas monitoring applications. The challenge is to produce sensing units at a sufficiently low cost to allow for broad deployment, which can only be reached with efficient materials and fabrication procedures. In this context, metal oxides are promising for next-generation gas sensors due to their high surface-area-to-volume ratio, efficient electron transfer, enhanced and tunable surface reactivity, fast response, and short recovery time. However, sensors from metal oxides are normally not sufficiently selective and have to be operated at high temperatures. These limitations have been overcome with strategies such as doping with other oxides, UV-illumination, and noble metal decoration. This review concentrates on the design and mechanisms of heterostructures for gas sensors, which are obtained with metal oxides in conjunction with other materials (e.g. other metal oxides and 2D materials). The key topics discussed include: (a) synthesis of metal oxide heterostructures (MOHs); (b) semiconducting heterostructures comprising n–n, n–p, and p–p heterojunctions, with emphasis on their sensing mechanisms; (c) sensors produced with heterostructures involving 2D materials. The challenges and prospects for gas sensors based on MOHs are also discussed.
Export citation and abstract BibTeX RIS
1. Introduction
The living standards of humans have grown at a remarkable pace, which was accompanied by environmental issues such as monitoring of air quality [1–3]. It is now crucial to detect and monitor fossil fuel hydrocarbons, oxygen for breathable atmospheres and combustion processes, in addition to other gases that pollute the environment and pose a risk to public health [4–6]. Pollution control, in particular, requires gas sensors to monitor the environment, public security and food quality [7]. With such prominence, there is a strong trend to integrate sensors into devices, especially within the internet of things paradigm [8]. Examples are systems for air quality control inside buildings and heavy traffic regions, and detection of toxic and explosive gases. The gas sensing market is currently worth €630 million annually, with chemiresistive sensors comprising ∼€230 million due to their low cost, high sensitivity, fast response, and relative simplicity [9].
The essential features of a gas sensor are the three 'S' rules: sensitivity, selectivity, and stability. Chemiresistive gas sensors have been optimized with wide-bandgap semiconducting metal oxides, such as tin oxide, tungsten oxide, indium oxide, or zinc oxide [4, 10, 11]. They act as gas sensors when adsorbed gaseous species form surface states in the metal oxide by exchanging electrons with the bulk material. Optimization is mainly focused on decreasing the particle (grain) size of the semiconducting metal oxide to the nanometer scale. In nanoparticles, the surface states extend throughout the entire particle, inducing an increase in sensitivity together with the high surface-to-volume ratio and large accessible surface area. With nanomaterials, microsensor platforms may be developed [12–16] where miniaturization reduces material consumption in manufacture and decreases power consumption during operation [17–19]. Miniaturization also enables faster response times and lower detection limits than traditional ceramic sensors, enabling devices to be deployed on-site and for real-time detection. Chemiresistive sensors made with semiconducting oxides (SnO2, ZnO, WO3, In2O3), catalytic oxides (V2O5, MoO3, CuO, NiO), and mixed oxides (LaFeO3, BaTiO3, and ZnFe2O4) have been used in environmental monitoring, personal safety, and industrial processes [20, 21]. They possess drawbacks related to low selectivity, extended response and recovery times, and instability [22], which have been addressed by modifying the host matrix with metal sensitizers, including Ag, Au, Fe, Pd, Pt, Cu, or other metal oxides such as NiO, CuO and SnO2 [23, 24]. Core–shell structures have also been used, including α-Fe2O3/SnO2, GaN/WO3, TiO2/ZnO, multi-walled CNT/SnO2, ZnO/SnO2, CeO2/TiO2, Fe2O3/ZnO, MoO3/TiO2 and Fe2O3/TiO2 [25, 26].
The fabrication of heterostructures with p-type and n-type semiconducting oxides permits one to combine physical and chemical properties of individual components. The performance in terms of sensitivity and fast response can then be enhanced owing to the build-up of an inner electric field at the p/n junction. In equilibrium, the inner electric field in the depletion region sets up a negative charge at the p-type semiconductor, while a positive net charge is established in the n-type semiconducting region. Figure 1 shows an overview of gas sensors made with metal oxide heterostructures (MOH) for detecting toxic analytes such as ethanol, acetone, formaldehyde, ammonia (NH3), hydrogen sulphide (H2S), carbon monoxide (CO), nitrogen dioxide (NO2), carbon dioxide (CO2), ozone (O3), methane (CH4), liquefied petroleum (LPG). Also depicted in figure 1 is a chart showing the increase in publications over the last decade.

Figure 1. Schematic diagram of MOH-based gas sensors for the detection of hazardous gases and volatile organic compounds (VOCs), and the total number of publications on MOHs in the last decade (Web of Science, accessed on 19 February 2021).
Download figure:
Standard image High-resolution imageThe design and development of new sensing materials have been the subject of various review papers on sensing mechanisms or target gases. For example, Zappa et al [25] summarized heterostructure-based gas sensors that operated mainly at high temperatures, with emphasis on the physical and chemical syntheses but there was no attempt to identify the approaches more likely to lead to high sensitivity. Miller et al [27] presented a thorough review on gas sensors made with metal oxide heterojunctions where the sensing mechanism was analyzed in depth and the factors affecting the sensing performance were discussed. Similar reviews were produced by Miller et al [27] with focus on the morphology and sensing mechanism of one-dimensional heterostructured materials, and by Walker et al [26] with an emphasis on synergistic effects from oxide heterostructures in gas sensing. All of these reviews focused on particular subjects without covering recent advances in nano heterostructured materials for gas sensors from a pragmatic perspective. This is precisely the focus on the present review, which is aimed at a comprehensive coverage of recent advances on heterostructured materials with the prospects of continued efforts toward the development of higher performance gas sensors.
1.1. General sensing mechanism
Metal oxide gas sensors operate based on a change in the electrical properties of the active element that adsorbs gas molecules, as illustrated in figure 2(a). The negative charge trapped in the adsorbed oxygen species causes an upward band bending and reduced conductivity compared to the flat band situation in n-type materials. When adsorbed on metal oxides, O2 molecules can extract electrons from the conduction band (Ec), thus trapping electrons at the surface in the form of ions. This will lead to band bending, and an electron depleted region known as a space-charge layer whose thickness is of the order of the band bending region length. The reaction of the oxygenated species with reducing gases, or a competitive adsorption/replacement of the adsorbed oxygen by other molecules decreases and can reverse the band bending, resulting in an increased conductivity [28, 29]. Depending on the temperature, oxygen is mainly adsorbed on the sensor in ionic forms such as O2 − (<100 °C), O− (100 °C–300 °C), and O2− (>300 °C). Figure 2(b) shows the changes in band structure owing to the adsorption of oxygen molecules.
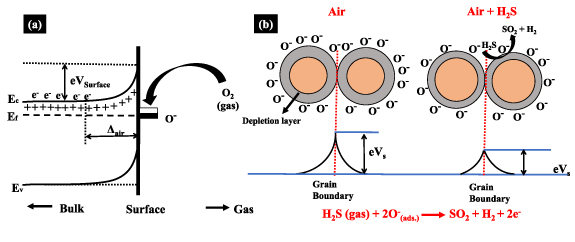
Figure 2. (a) Band bending after chemisorption of charged species on n-type semiconductors (here the ion sorption of oxygen). EC, EV, and EF denote the energy of the conduction band, valence band, and the Fermi level, respectively. Δair is the thickness of the space-charge layer, and eVsurface represents the potential barrier. The conducting electrons are represented by e−, and +ve ions are the donor sites [30, 31]. (b) Schematics of charge carrier concentration in metal oxides. At the surface, left: negatively charged chemisorbed oxygen species cause an upward band bending and a depletion layer in the near-surface region. This leads to a Schottky-like barrier across grain boundaries, leading to the high resistance of the sample. Right: reducing gases react with chemisorbed oxygen species, and the potential barrier is reduced, yielding a sharp reduction in the resistance.
Download figure:
Standard image High-resolution imageMetal oxides such as SnO2, WO3, and ZnO are n-type materials, with the stoichiometric excess of metal attributed to oxygen vacancies (O2 −, O− and O2−). Under standard sensor operating conditions, the conductivity is lower than that in bulk due to surface oxygen ions that trap electrons. A surface depletion layer is formed, and thus a Schottky barrier is established at interparticle contacts. Such barriers control the injection of charge carriers, and their height is related to the probability of adsorption. Heterojunctions are obtained by modifying the sensor surface with a thin layer of metal oxides, polymers, noble metals, or 2D materials, leading to random heterojunctions distributed uniformly over the sensor surface [32]. The formation of these junctions causes depletion of nanostructures with the formation of potential barriers distributed over the sensor film surface. Table 1 brings details of sensors to detect toxic gases obtained with heterostructures containing ZnO and SnO2 transition metal oxides.
Table 1. Gas sensing performance of ZnO and SnO2-based heterostructures for detecting toxic gases.
| Analyte gas | Morphology | Composition | Operating temperature | Concentration | Sensor response | Response/recovery time | LOD | Selective against | Reference |
|---|---|---|---|---|---|---|---|---|---|
| Butanol | Mixed particles | ZnO–SnO2 | 350 | 5 ppm | 300 a | NA h | 0.1 ppm | Ethanol, propanol, hexanol, 3-methyl-1-butanol, 3-octanone, diacetyl, butanal, butanone, ethyl benzene, decane | [43] |
| Ethanol | Nanofibers (NFs) | SnO2–ZnO | 360 | 2500 ppm | 17 b | 5 s/1 s | 27.7 ppm | NA h | [44] |
| Ethanol | Core–shell nanosheet | SnO2/ZnO | 350 | 100 ppm | 13.3 b | NA h | 5 ppm | Benzene, toluene, ammonia, acetone, methanol | [45] |
| Hydrogen sulphide | Hetero-nanostructures | SnO2/ZnO | 100 | 10 ppb | 2.7 b | ∼150 s/40 s | 10 ppb | Ethanol, acetone, NH3, H2 | [46] |
| Ammonia | Composite fiber | ZnO/NiO | RTg | 250 ppm | 67 b | ∼1000 s/— | 50 ppm | Methanol, 2-propanol, ethanol, benzyl alcohol, acetone, acetic acid, trimethylamine | [47] |
| Carbon monoxide | Composite | SnO2–CuO | 235 | 10 ppm | 95 b | 37 s/80 s | 10 ppm | Ethanol, methanol, toluene, acetone, formaldehyde | [48] |
| Formaldehyde | Hollow spheres | SnO2 /ZnO | RTg | 100 ppm | 76 c | 36 s/73 s | 1.91 ppb | Ammonia, ethanol, acetone, methanol, benzene, toluene | [49] |
| Nitrogen dioxide | Hierarchical nanostructures | SnO2@ZnO | 150 | 0.005 ppm | 1.2 d | 60 s/45 s | 5 ppb | Acetone, C7H8, H2S, CHCl3, NH3, ethanol | [50] |
| Acetone | Heterostructures | NiO/ZnO | 400 | 100 ppm | 6.7 e | 10 s/— | 11 ppm | NA h | [51] |
| Triethylamine (TEA) | Composite | SnO2/NiO | 70 | 10 ppm | 14.3 | 86 s/95 s | 2 ppm | NO2, HCHO, C2H5OH, CH3OH, C6H5CH3, NH3 | [52] |
| Methanol | Heterostructures | ZnO/SnO2 | 200 | 100 ppm | 80 b | 20 s/65 s | 1 ppm | NA h | [53] |
| Ozone | Heterojunctions | ZnO–SnO2 | RT | 20 ppb | 8 f | 13 s/90 s | 20 ppb | NO2, NH3, CO | [54] |
| Chlorine | Heterostructures | ZnO–SnO2 | 260 | 10 ppm | 230.52 f | 1 s/3 s | 0.06 ppm | Ammonia, formaldehyde, methanol, acetone, ethanol, NO2 | [55] |
| Acetone | Thick films | ZnO/SnO2 | 180 | 0.5 ppm | 3.36 b | 57 s/63 s | 10 ppb | Alcohol, methanol, gasoline, ammonia, CO, CO2 | [56] |
| TEA | Heterostructure | Au–ZnO/SnO2 | 300 | 100 ppm | 115 b | 7 s/30 s | 2 ppm | Benzene, p-xylene, acetone, ethanol, isopropanol | [57] |
| Hydrogen | Composites | ZnO–SnO2 | 150 | 1% | 65% c | ∼200 s/∼ 100s | 0.3% | NA h | [58] |
a S = (ΔI/Ia) × 100. b S = Ra/Rg. c Rs = (Ra − Rg)/Ra × 100. d S = (Gf − G0)/G0 = ΔG/G0. eResponse = (Gair − Ggas)/Ggas. f S = Rg/Ra. gRT—room temperature. hNA—not available.
2. Distinct methods to synthesize heterostructures for gas sensors
Novel materials have been developed to address such limitations of gas sensors as sluggish response and recovery time, low sensitivity and selectivity, and high-temperature operation. In this context, heterostructures are used to improve the performance of pristine nanomaterials, as discussed in review papers [33–35]. They are mostly prepared with wet chemical approaches, including solvothermal, hydrothermal, and co-precipitation methods. In wet chemistry, synthesis occurs with chemical reactions under controlled conditions, above ambient temperature and pressure in an autoclave [36]. Heterostructures demand two or more fabrication steps because different materials are combined, making it difficult to reach mass production, in addition to the possible low-quality heterojunctions [37]. This is the case of heterostructures with 2D materials need mechanical [38], chemical [39], or optical [40] exfoliation steps. An alternative is to employ electrostatic interactions with a magnetic stirrer or hydrothermal procedures [41, 42]. The distinct methods used to synthesize heterostructures for gas sensors are summarized in the following, and some selected examples are given in table 2. The morphologies of heterostructures produced with different synthesis methods are illustrated in figure 3.

Figure 3. SEM images of: (a) and (b) hydrothermally synthesized NiO nanosheets on flower-like ZnO. Adapted from [59], Copyright 2017, with permission from Elsevier Ltd and Techna Group S.r.l. (c) Fe2O3/LaFeO3 hollow nanospheres by co-precipitation method. Adapted from [60], Copyright 2018, with permission from Elsevier. (d) and (e) SnO2–Sn3O4 hierarchical microspheres prepared by co-precipitation method. Adapted from [61], Copyright 2019, with permission from Elsevier. (f) SnO2–ZnO NFs prepared via electrospinning process. Adapted from [62], Copyright 2014, with permission from Elsevier. (g) and (h) ZnO/CdO heterostructures prepared by spray pyrolysis (SP) method. Adapted from [63], Copyright 2019, with permission from Elsevier.
Download figure:
Standard image High-resolution imageTable 2. Examples of heterostructures applied as gas sensors and corresponding synthetic method.
| Morphology | Heterostructure | Synthetic method | Analyte | Reference |
|---|---|---|---|---|
| Hollow microspheres | NiO/ZnO | Hydrothermal | Ethanol | [64] |
| Nanorods/nanoparticles | NiO/ZnO | Hydrothermal | Ethanol | [37] |
| Nanoplates | NiO/ZnO | Hydrothermal | Ethanol | [65] |
| Nanorods | SnO2/ZnO | Hydrothermal | Ethanol | [66] |
| Nanosheets/nanoparticles | MoS2/ZnO | Hydrothermal | NO2 | [67] |
| Nanocomposites | Al–ZnO/CuO | Co-precipitation | Ammonia | [68] |
| Hollow nanospheres | α-Fe2O3/LaFeO3 | Co-precipitation | Ethanol | [60] |
| Mesoporous hollow microboxes | Zn2SnO4/SnO2 | Co-precipitation | Acetone | [69] |
| Nanoparticles/nanospheres | rGO-NiO/In2O3 | Co-precipitation | CO2 | [70] |
| Nanocomposites | NiO/SnO2 | Co-precipitation | Ethanol | [71] |
| Hierarchical microsphere | SnO2/Sn3O4 | Solvothermal | NO2 | [61] |
| Metal–organic framework (MOF) bamboo-like | CuO/In2O3 | Solvothermal | H2S | [73] |
| Nanoparticles/nanocomposites | Sn–TiO2@rGO/CNT | Solvothermal | NH3 | [74] |
| Core–shell NFs | SnO2/Au–In2O3 | Electrospinning | Acetone | [79] |
| Nanotubes | SnO2/ZnO | Electrospinning | Ethanol | [80] |
| Core–shell NFs | TiO2/SnO2 | Electrospinning | Acetone | [81] |
| Core–shell NFs | Co3O4/ZnO | Electrospinning | Formaldehyde | [82] |
| Crumpled 2D | SnO2/ZnO | SP | Formaldehyde | [83] |
| Crumpled 2D | SnO2/Co3O4 | SP | Acetone | [83] |
2.1. Hydrothermal method
The hydrothermal method is advantageous because of its simplicity with no requirement of costly equipment, high yield, low energy consumption, and control over the morphology of the heterostructures. It can be used as a one-step fabrication for producing various types of heterostructured materials. The hydrothermal method allows to control the size and shape of the nanostructures; however, precise control over the hydrothermal routes still needs to be solved, particularly to determine optimized parameters for preparing high-quality MOHs. Figures 3(a) and (b) shows scanning electron microscopy (SEM) and transmission electron microscopy (TEM) images of the flower-like architecture of NiO/ZnO heterostructure prepared via hydrothermal method, which had a high surface area leading to fast response and recovery in sensing acetone [59]. Examples of heterostructures synthesized with the hydrothermal method are NiO/ZnO [37, 64, 65], SnO2/ZnO [66] and MoS2/ZnO [67].
2.2. Co-precipitation method
The co-precipitation method also allows for fabricating semiconducting oxide nanostructures with controlled morphology. It does not require expensive equipment, stringent reaction conditions, or complicated procedures. In rare cases, nanostructures may be produced without calcination or post-annealing process. Highly porous Al-doped ZnO/CuO nanocomposites were obtained with a co-precipitation method followed by a sol-gel procedure [68]. Figure 3(c) shows the p–n heterostructures of Fe2O3/LaFeO3 synthesized by the co-precipitation method, with which a rapid response (within 1 s) in detecting ethanol vapor could be obtained with excellent selectivity and stability [60]. Other examples of heterostructures synthesized using the co-precipitation method are Zn2SnO4/SnO2 [69], reduced graphene oxide (rGO)-NiO/In2O3 [70] and NiO/SnO2 [71].
2.3. Solvothermal method
The solvothermal synthesis process is similar to the hydrothermal one, except for the precursor solution typically non-aqueous. This process ensures that nanoparticles or nanostructures can be monitored for their size, shape, and high crystallinities. Zeng et al [61] reported a facile co-precipitation method to fabricate hierarchical SnO2–Sn3O4 heterostructures (figures 3(d) and (e)), which demonstrated excellent NO2 sensing performances with high sensitivity even at 20 ppb. Other heterostructures synthesized by the solvothermal method are ZnO@Bi2O3 [72], CuO/In2O3 [73] Sn–TiO2@rGO/CNT [74] BiVO4/Cu2O/rGO [75], and α-Fe2O3/ZnO [76].
2.4. Electrospinning method (ES)
The ES has been studied since the 1990s, being one of the most versatile techniques to generate nanostructures with long NFs using solutions, gel, and fluid crystals. ES is the only method to prepare large quantities of NFs from a commercial point of view, owing to its simple handling, minimal solution use, controllable NF diameter, low cost, and easy and reproductive character [77]. ES has been used in technological applications, including gas sensors [78]. Li et al [79] used the coaxial ES to prepare SnO2/Au-doped In2O3 core–shell NFs applied as a selective acetone gas sensor. Figure 3(f) shows SnO2–ZnO composite NFs with porous morphology and surface area of 17.42 m2 g−1, with which excellent sensing performance was obtained for methanol gas [62]. Other examples of heterostructures synthesized by the ES are SnO2/ZnO [80] SnO2/Ga2O3 [80], SnO2/WO3 [80] TiO2/SnO2 [81], and Co3O4/ZnO [82].
2.5. Spray pyrolysis (SP)
SP is a simple and practical approach to design nanostructured materials with controlled morphology, suitable for scalable production. Advantages of SP include the fabrication of homogeneous multi-component materials and composites with specific stoichiometric ratios, rapid solvent evaporation, and solvent decomposition porous hollow structures. SP can also be scaled up for mass production. Srinivasan et al [63] synthesized n–n heterostructures of ZnO/CdO (figures 3(g) and (h)) with SP, and used them in room temperature (RT) sensing of acetone gas under UV-light illumination. Some examples of heterostructures synthesized by the SP method are SnO2/ZnO, SnO2/Co3O4, GO/SnO2, GO/ZnO, and GO/Co3O4 [83].
Because of their controlled and straightforward manner of designing nanostructures, these synthesis approaches are promising for obtaining materials with the desired sensing properties. There is no definitive answer to which method is better to achieve a specific property or detect selective gas because many parameters, such as operating temperature, size, and shape of the morphology, play a significant role [84]. In this regard, researchers have mostly opted for wet chemical approaches, particularly hydrothermal methods, to fabricate heterostructures with porous morphology. Figure 4 indicates the fabrication method appropriate for detecting toxic analytes in a specific temperature range. Also mentioned is the suitability of each method for a target gas. It is worth noting, nevertheless, that the figure brings only a pictorial view based on one parameter. Other sensing characteristics must also be considered, including morphology, size/shape, and surface area, which can affect the sensor response.
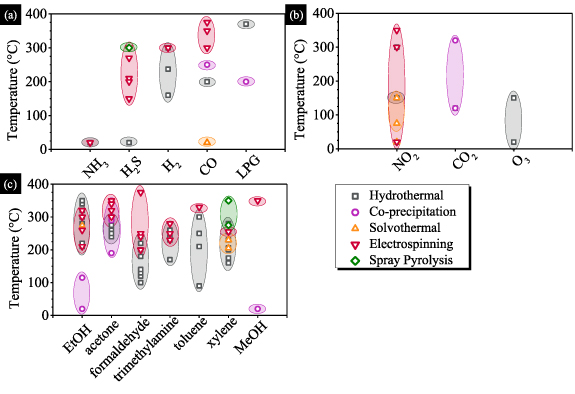
Figure 4. Comparative plots of temperature operation for MOHs prepared by hydrothermal ( ), co-precipitation (
 ), solvothermal (
 ), electrospinning (
 ), and SP (
 ) methods for the detection of (a) reducing (NH3:
  [85–91],
  [92], H2S:
  [93–95],
  [96–100],
 [101], H2:
  [102–104],
  [105], CO:
  [106, 107],
 [108],
  [109, 110],
  [111–114], LPG:
  [115],
 [116]), (b) oxidizing (NO2:
  [117–120],
  [61, 121, 122],
  [114, 123, 124], CO2:
  [125],
 ; [126, 127], O3:
  [54, 128]), and (c) VOCs gases (EtOH:
  [129–139],
 [71, 140],
  [141],
  [142–146], acetone:
  [59, 147–154],
 [155–158],
  [81, 159–161], formaldehyde:
  [162–171],
  [172–175], trimethylamine:
  [176–179],
  [176, 180–182], toluene:
  [183–185],
  [186], xylene:
  [187–192],
  [188, 193],
  [194],
 [195, 196], MeOH:
 [197],
  [62]).
Download figure:
Standard image High-resolution image3. MOHs as gas sensors
The formation of heterostructures is a popular way to enhance gas sensing performance because it increases reaction and adsorption sites, yielding a higher catalytic activity than a single material. Combining two different materials such as n–n, p–p, or n–p semiconductors provides synergistic effects of the interfaces, with equalization of the Fermi energies due to electron transfer from higher energies to the unoccupied lower energy level. A potential energy barrier is formed at the interface with band bending due to different Fermi energies. Hence, electrons must cross the depletion region (interface) to overcome this potential energy barrier. The detailed mechanisms behind the operation of gas sensors made of MOHs are discussed in [84, 198–200].
Figure 5 shows the energy band diagram and the heterojunctions formed with n-type and p-type semiconductors. In n–n metal oxide heterojunctions (figure 5(a)), electrons make the majority charge carriers. At the interface, an electron depletion layer is formed with higher-energy conduction band states due to the loss of electrons, in addition to an electron accumulation layer with lower-energy conduction band states [201]. For p–p metal oxide heterojunctions (figure 5(b)), holes are the majority charge carriers that are transported at the interface from higher to lower-energy valence band states. This yields a hole depletion region and a hole accumulation region with higher and lower energy valance band states, respectively. A more widespread use is observed for n-type materials due to their stability in low oxygen environments and response compatibility to measuring devices [202]. Sensing performance can be enhanced with a p–n heterojunction. At a n–p or p–n heterostructure interface (figure 5(c)), electron transfer from n-type to p-type or hole transfer from p-type to n-type occurs due to electron–hole recombination depending on the backbone material. This facilitates additional oxygen adsorption due to the larger electron density [203]. These heterostructures have a larger number of free electrons than in n–n or p–p heterojunctions [27]. The intrinsic Fermi level for n-type materials is usually higher than for a p-type, which results in a space charge region at the p–n interface. The width of this region is calculated using equation (1), where Xn and Xp are electron depletion and hole depletion layers, respectively:

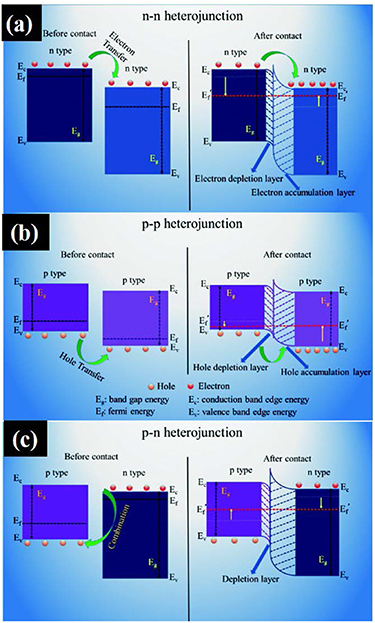
Figure 5. Different types of heterojunction and their energy band structures (a) p–n junction, (b) n–n junction, and (c) p–p junction. Adapted from [201] with permission of The Royal Society of Chemistry.
Download figure:
Standard image High-resolution imagehere,  n and p are the static dielectric constant, Nn and Np are the carrier concentration of the n-and p-type semiconductor, and qVbi is the high potential barrier between n and p-type semiconductors. p–n heterostructures provide a high sensor response and selective sensing towards target analytes for several reasons. These include effective charge separation, long lifetime of charge carriers, minimized electron–hole recombination [27, 145, 204–206]. The relevant parameters to evaluate gas sensing performance are the electrical response, gas selectivity and sensitivity, operating temperature, and response and recovery times [27], which will be considered in the brief survey below of gas sensors made with MOHs in recent years.
Heterojunctions can accelerate electron transport and improve oxygen adsorption, resulting in an abundance of oxygen vacancies on the heterostructures surfaces and providing new active sites for sensing reactions. Furthermore, the heterostructures often contain mesoporous that aid in gas adsorption and desorption. These effects should increase the sensitivity and response rates of gas sensors made with MOHs. In the formation of the heterojunction, many defects are generated at the interface between the composites due to the different lattice parameters of the two materials, thus creating active sites for gas adsorption. Therefore, more gas molecules can be adsorbed on the composites and participate in the reaction between the chemically adsorbed oxygen and the target molecule. The gas sensing mechanism can be verified experimentally by measuring the work function using the Kelvin probe method. Figure 6(a) shows the energy diagram for a ZnO@In2O3 heterojunction obtained from scanning Kelvin probe force microscopy (SKPM) under NO2 gas exposure at RT [207]. Considerable changes exist in the energy band structure owing to the local electron transport between ZnO and In2O3 at the heterojunctions upon exposure to NO2 gas, thus indicating charge carrier recombination. Electrons shift from a higher to a lower Fermi energy before the energy levels reach equilibrium. Under environmental air, both n-type materials adsorb negatively charged oxygen ions owing to the oxygen adsorption over the sensing material. As a result, there is a built-in interfacial electric field and electrons can move from the conduction band of In2O3 to ZnO. Hence, these adsorbed oxygens ultimately draw electrons and make the n-type In2O3 more depleted, with this lower electron concentration yielding an upward band bending. Similarly, n-type ZnO becomes more conductive due to a higher electron concentration causing a downward band bending, as illustrated in figure 6(b). The NO2 gas molecules trap the electrons by interacting with adsorbed oxygen species on the heterojunction interfaces (figure 6(c)). Since the affinity of NO2 gas (2.28 eV) is higher than the adsorbed oxygen species (0.43 eV), NO2 reacts at the heterojunction via oxygen species (O−). The ensuing increase in the potential barrier was confirmed in the studies with the Kelvin probe. Figures 6(d) and (e) show the SKPM analysis of the ZnO@In2O3 heterostructure before and after exposure to the gas. In air, the contact potential difference (CPD) was 103 mV, while it was 35 mV for a pure ZnO sample. The difference is due to the charge transport between the heterojunction materials, with the electrons moving because of the difference in work functions. The calculated work function for ZnO@In2O3 heterostructure was 4.97 eV, higher than for the pure ZnO sample, leading to band bending. In the presence of NO2 gas, CPD further increased to 146 mV with a work function of 5.02 eV. This increase in CPD depends on the difference in work function, as indicated in the SKPM images of figures 6(d) and (e). The energy band bending could be understood by simulating the energy band structure using the evidence from SKPM with n-ZnO/n-In2O3 heterojunctions. Furthermore, the crystallographic defects and increased surface area of ZnO@In2O3 nanowires provided favorable adsorption facets for a fast response to gaseous NO2, potentially amplifying the gas sensing properties.

Figure 6. (a) Energy band diagram of ZnO@In2O3 heterojunction before and after contact, and schematic illustration of the sensing mechanism: (b) before gas exposure (in air); (c) after NO2 gas exposure. (d) Atomic force microscopy image of ZnO@In2O3 heterojunction. (e) SKPM analysis of ZnO@In2O3 heterojunction in air and under NO2 atmosphere (the inset shows the CPD value under air and NO2 atmosphere). Adapted from [207] with permission of The Royal Society of Chemistry.
Download figure:
Standard image High-resolution image3.1. p–n heterostructures
Various metal oxides have been used in p–n heterostructures for gas sensors, including NiO/ZnO [148, 208, 209], NiO/SnO2 [210, 211], Co3O4/ZnO [82, 212], CuO/ZnO [68, 213–215], SnO/SnO2 [120], Fe2O3/NiO [216] and CuO/TiO2 [217]. The gas sensing performances of some p–n heterostructures at RT and high temperature are described in table 3. Emphasis has been placed on detecting toxic gases and VOCs, as with ZnO nanosheets and NiO nanoparticles to detect TEA [208, 210]. Using the p–n heterojunction led to a higher sensitivity compared to pristine ZnO. Figure 7(a) shows the energy band diagram and the schematic model of the NiO/ZnO p–n junction in air and acetone gas. A depletion layer is formed on the ZnO surface and an accumulation layer on NiO, exhibiting high electrical resistance (Ra) in dry air. In contrast, upon exposure to acetone gas, the atmosphere with abundant electrons induces the shrink in the depletion layer, causing a change in electrical conductivity (Rg) and, therefore, a high sensing response. Figure 7(b) shows the energy band diagram and the schematic model of the NiO/SnO2 p–n junction in air and in TEA gas conditions. When the sensor is under air conditions, the resistance of the composite (Ra) is higher than that of the pristine SnO2, due to the depletion layer in the p–n junction. Then, the composite resistance decreases upon exposure to TEA gas (Rg), improving the sensor response due to the large change in resistance (S = Ra/Rg).

Figure 7. Energy band diagrams and schematic models of p–n heterostructures for gas sensing based on NiO nanoparticles with (a) ZnO. Adapted from [148], Copyright 2017, with permission from Elsevier. (b) SnO2. Adapted from [210], Copyright 2015, with permission from Elsevier.
Download figure:
Standard image High-resolution imageTable 3. Gas sensing performance of p–n heterostructures.
| Analyte gas | Morphology | Composition | Operating temperature | Concentration | Sensor response | Response/recovery time | LOD | Selective against | Reference |
|---|---|---|---|---|---|---|---|---|---|
| Triethylamine (TEA) | Nanoparticles—nanosheets | NiO/ZnO | 320 °C | 100 ppm | 185 a | 7 s/33 s | 2 ppm | Ethanol, acetone, 2-propanol, p-xylene, C6H6, C6H12, CH3OH, n-hexane | [208] |
| Hydrogen sulfide (H2S) | Nanowires | NiO/ZnO | RT k | 100 ppm | 31.5 b | 15 s/10 min | 10 ppm | Carbon disulfide, ethanol, acetone, methanol | [209] |
| Acetone ((CH3)2CO) | Nanoparticles—hollow spheres | NiO/ZnO | 275 °C | 100 ppm | 30 a | 1 s/20 s | 0.8 ppm | Benzene, formaldehyde, xylene, methanol, ethanol | [148] |
| Triethylamine (TEA) | Nanoparticles—hollow spheres | NiO/SnO2 | 220 °C | 10 ppm | 46.5 a | 11 s/34 s | 2 ppm | Ethanol, acetone, benzene, xylene | [210] |
| Formaldehyde (HCHO) | Hollow spheres—nanoparticles | Co3O4/ZnO | 160 °C | 10 ppm | 5.68 c | 27 s/15 s | 1 ppm | NO2, NH3, ethanol, acetone | [212] |
| Formaldehyde (HCHO) | Core–shell NFs | Co3O4/ZnO | 220 °C | 100 ppm | ∼5 d | 6 s/9 s | 10 ppm | Ethanol, acetone, toluene, ammonia, carbon monoxide | [82] |
| Ethanol (C2H5OH) | Flower-like nanorods | CuO/ZnO | 300 °C | 100 ppm | 98.8 a | 7 s/9 s | 1 ppm | Formaldehyde (CH2O), methanol (CH3OH), benzene (C6H6), dichloromethane (CH2Cl2), carbon tetrachloride (CCl4) | [213] |
| Ethanol (C2H5OH) | Core–shell cubes | CuO/ZnO | 240 °C | 50 ppm | ∼3.5 e | 5 s/18 s | 5 ppm | CH3OH, (CH3)2CHOH, CH3COCH3, CO, CH4 | [215] |
| Ammonia (NH3) | Nanocomposites | Al-CuO/ZnO | RT k | 200 ppm | 510.11 a | 14 s/9 s | 50 ppm | Ethanol, acetone, methanol, isopropanol, n-butanol, acetyl acetone, gasoline, xylene | [68] |
| Nitrogen dioxide (NO2) | Nanosheet crystals | SnO/SnO2 | RT k | 0.2 ppm | 2.5 d | 57 s/5 min | 0.1 ppm | Ethanol, acetone, benzene, ammonia, toluene | [120] |
| Ethanol (C2H5OH) | Nanosheets | Fe2O3/NiO | 255 °C | 100 ppm | 170.7 d | 0.5 s/14.6 s | 200 ppb | Methanol, formaldehyde, DMF (dimethylformamide), DMA (dimethylacetamide), toluene, methanamide, ammonia | [216] |
| Hydrogen gas (H2) | Thin film—nanotubes | CuO/TiO2 | 200 °C | 1000 ppm | 2 f | 7.4 min/6.8 min | 100 ppm | Acetone, ethanol, chloroform, NO2 | [217] |
| Butanol | Mixed particles | ZnO–SnO2 | 350 °C | 5 ppm | 300 g | NA l | 0.1 ppm | Ethanol, 1-propanol, 1-butanol, 1-hexanol, 3-methyl-1-butanol, 3- octanone, diacetyl, butanal, 2-butanone, ethyl benzene, decane | [43] |
| Ethanol | NFs | SnO2–ZnO | 360 °C | 2500 ppm | 17 a | 5 s/1 s | 27.7 ppm | NA l | [44] |
| Ethanol | Core–shell nanosheet | SnO2/ZnO | 350 °C | 100 ppm | 13.3 a | NA l | 5 ppm | Benzene, toluene, ammonia, acetone, methanol | [45] |
| Hydrogen sulphide | Hetero-nanostructures | SnO2/ZnO | 100 °C | 10 ppb | 2.7 a | ∼150 s/40 s | 10 ppb | Ethanol, acetone, NH3, H2 | [46] |
| Ammonia | Composite fiber | ZnO/NiO | RT k | 250 ppm | 67 a | 1000 s/— | 50 ppm | Methanol, 2-propanol, ethanol, benzyl alcohol, acetone, acetic acid, trimethylamine | [47] |
| Carbon monoxide | Composite | SnO2–CuO | 235 °C | 10 ppm | 95 a | 37 s/80 s | 10 ppm | Ethanol, methanol, toluene, acetone, formaldehyde | [48] |
| Formaldehyde | Hollow spheres | SnO2 /ZnO | RT k | 100 ppm | 76 h | 36 s/73 s | 1.91 ppb | Ammonia, ethanol, acetone, methanol, benzene, toluene | [49] |
| Nitrogen dioxide | Hierarchical nanostructures | SnO2@ZnO | 150 °C | 0.005 ppm | 1.2 i | 60 s/60 s | 5 ppb | Acetone, C7H8, H2S, CHCl3, NH3, ethanol | [50] |
| Acetone | Heterostructures | NiO/ZnO | 400 °C | 100 ppm | 6.7 j | 10 s/— | 11 ppm | NA l | [51] |
| TEA | Composite | SnO2/NiO | 70 °C | 10 ppm | 14.3 d | 86 s/95 s | 2 ppm | NO2, HCHO, C2H5OH, CH3OH, C6H5CH3, NH3 | [52] |
| Methanol | Heterostructures | ZnO/SnO2 | 200 °C | 100 ppm | 80 a | 20 s/65 s | 1 ppm | NA l | [53] |
| Ozone | Heterojunctions | ZnO–SnO2 | RT | 20 ppb | 8 f | 13 s/90 s | 20 ppb | NO2, NH3, CO | [54] |
| Chlorine | Heterostructures | ZnO–SnO2 | 260 °C | 10 ppm | 230.52 d | 1 s/3 s | 0.06 ppm | Ammonia, formaldehyde, methanol, acetone, ethanol, NO2 | [55] |
| Acetone | Thick films | ZnO/SnO2 | 180 °C | 0.5 ppm | 3.36 a | 57 s/63 s | 10 ppb | Alcohol, methanol, gasoline, ammonia, CO, CO2 | [56] |
| TEA | Heterostructure | Au–ZnO/SnO2 | 300 °C | 100 ppm | 115 a | 7 s/30 s | 2 ppm | Benzene, p-xylene, acetone, ethanol, isopropanol | [57] |
| Hydrogen | Composites | ZnO–SnO2 | 150 °C | 1% | 65% h | ∼200 s/∼ 100s | 0.3% | NA l | [58] |
| H2S | Microtubes | CuO/ZnO | 170 °C | 50 ppb | ∼1.66 | 35/29 s | 10 ppb | Ethanol, chlorobenzene, acetone, formaldehyde, aniline, TEA, ammonia, hydrogen, nitrogen dioxide, carbon monoxide | [218] |
| Formaldehyde | Nanoflowers | SnO/SnO2 | 120 °C | 50 ppm | 80.9 | 7/27 s | 8.15 ppb | Acetone, ethanol, methanol, TEA | [164] |
| CO | NFs | SnO2–Cu2O | 300 °C | 1 ppm | 3 | 17/12 s | NA l | C6H6, NH3, C3H3O, and HCHO | [111] |
| H2S | Hierarchical | NiO@SnO2 | 240 °C | 50 | 183.5 | 45/60 s | 1.5 ppb | Ammonia, toluene, formaldehyde, nitrogen dioxide | [219] |
a S = Ra/Rg. b R% = ((Va − Vg)/Vg) × 100. c Rs = (Vwork − Voutput)/Voutput × Rref. d S = Rg/Ra. e S = (Rg − Ra)/Ra. f Rs = (Ig − I0)/I0. g S = (ΔI/Ia) × h Rs = (Ra − Rg)/Ra × 100. i S = (Gf − G0)/G0 = ΔG/G0. jResponse = (Gair − Ggas)/Ggas. kRT—room temperature. lNA—not available.
Nanoplates of NiO/ZnO heterostructures were used to detect ethanol [65]. The morphology of the nanoplates of pristine NiO and NiO/ZnO is uniform, with a hexagonal shape and diameter of 90–120 nm, as shown in figures 8(a) and (b). The selectivity towards ethanol is indicated in figure 8(c) where data are presented for 500 ppm of oxidizing and reducing gases. Figure 8(d) shows the transient response-recovery to ethanol gas at an operating temperature of 400 °C, within the detection range from 10 to 800 ppm. The superior performance of NiO/ZnO heterostructure-based gas sensor is confirmed in figure 8(e), which is attributed to the higher catalytic activity compared to pure oxides and the presence of more active sites for the adsorption–desorption process [65]. Figure 8(f) illustrates the stability and reproducibility of the sensor made with NiO/ZnO.

Figure 8. Field emission SEM images of: (a) pristine NiO and (b) NiO/ZnO nanoplates; (c) the selectivity plot of pristine NiO and NiO/ZnO gas sensors to 500 ppm of different toxic gases; (d) dynamic sensor behavior of the NiO and NiO/ZnO gas sensor to ethanol in the detection range of 10–800 ppm at 400 °C; (e) transient response/recovery behavior of NiO and NiO/ZnO gas sensors to 500 ppm ethanol gas at 400 °C; (f) long-term stability and reproducibility of NiO/ZnO nanoplates-based gas sensor upon eight cycles. Adapted from [65], Copyright 2018, with permission from Elsevier.
Download figure:
Standard image High-resolution imageMorphology has been proven essential for sensing performance, as exemplified by comparing sensors fabricated with the same nanomaterials but distinct morphologies. NiO nanorods modified with ZnO nanoparticles were used to detect ethanol vapor at 100 ppm at 300 °C [37], while hierarchical hollow NiO/ZnO microspheres exhibited a higher sensing response at the optimum operating temperature of 260 °C [64]. Another SnO2/ZnO p–n heterostructure was used for selective ethanol sensing, with a sensor response of 18.1 and fast response (3 s) at the operating temperature of 275 °C [66]. Therefore, in various studies the detection experiments are accompanied by a full characterization of the nanomaterials. Figures 9(a)–(d) show SEM and TEM images of p–n hollow nanospheres with n-type α-Fe2O3 nanoparticles on p-type LaFeO3 [60]. The average diameter of the nanospheres was 350 nm, with the polycrystalline nature of the α-Fe2O3/LaFeO3 nanospheres being confirmed with selected-area electron diffraction (SAED) in figures 9(e) and (f). Ethanol detection could be made in the range from 5 to 200 ppm at an operating temperature of 240 °C with excellent reproducibility, selectivity, and long–term stability (for 15 d), ultrafast response time (1 s), and recovery time (5 s) to 100 ppm ethanol (figures 9(g)–(k)).
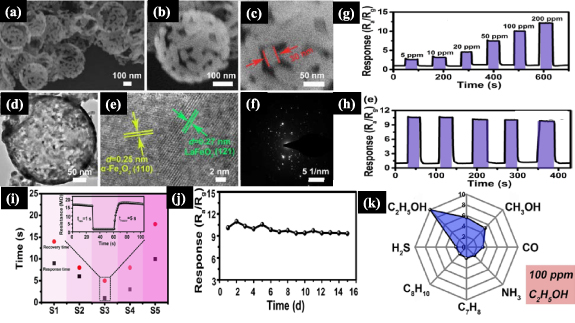
Figure 9. (a)–(c) α-Fe2O3/LaFeO3 hollow nanospheres Field Emission Scanning Electron Microscopy (FESEM) images; (d) TEM image; (e) high resolution-TEM images; (f) SAED pattern; (g) response-recovery curve to different ethanol concentrations (5–200 ppm); (h) reproducibility of the sensor to 100 ppm of ethanol at 240 °C; (i) transient response/recovery behavior to understand the response/recovery speed to 100 ppm ethanol at 240 °C; (j) long-term stability of α-Fe2O3/LaFeO3 hollow nanospheres; (k) selectivity polar graph of the α-Fe2O3/LaFeO3 hollow nanospheres to different toxic gases. Adapted from [60], Copyright 2018, with permission from Elsevier.
Download figure:
Standard image High-resolution imageThe detection of VOCs may also serve a disease diagnosis, for these compounds are present in humans exhaled breathing. For instance, acetone vapor from the human breath is associated with diabetes, which has motivated work on mesoporous hollow Zn2SnO4/SnO2 microboxes whose sensing results are shown in figure 10 [69]. The porous microboxes with an interplanar spacing of 0.335 nm and 0.261 are shown in figures 10(a)–(e), which also include elemental mapping. The results of pore diameter, porosity, and surface area are given in figure 10(f), while the data related to sensing appear in figures 10(g)–(j). It is worth noting that the sensing performance was considerably higher (8–18 times) for the Zn2SnO4/SnO2 than pure SnO2 at the operating temperature of 250 °C.

Figure 10. Zn2SnO4/SnO2 microboxes: (a) FESEM image; (b)–(d) TEM, High-resolution transmission electron microscopy (HRTEM) and SAED pattern; (e) Energy Dispersive Spectroscopy (EDS) elemental mapping; (f) Brunauer–Emmett–Teller (BET) surface area distribution plot with pore-size distribution (inset); (g) transient response-recovery behavior of pristine SnO2 and Zn2SnO4/SnO2-based sensors for acetone gas at 250 °C; (h) long-term stability of sensors within 30 d; (i) operating temperature vs sensor response behavior of pristine SnO2 and Zn2SnO4/SnO2 samples; (j) response of bare pristine SnO2 and Zn2SnO4/SnO2 gas sensors to 100 ppm toxic analytes at 250 °C. Adapted from [69], Copyright 2020, with permission from Elsevier.
Download figure:
Standard image High-resolution imageOther p–n heterostructures to detect acetone, ethanol, formaldehyde (HCHO), NO2, and benzene (C6H6) include NiO/ZnO, SnO2/NiO, Co3O4/ZnO and CuO/ZnO [82, 148, 211–215]. In all cases, the sensing performance is enhanced compared to pristine materials. There are, however, still limitations related to selectivity and operation temperature. Efforts have been made to mitigate such limitations, with metal doping and noble metal decoration to exploit catalytic properties and spillover effects. SnO2/Au-doped In2O3 core–shell electrospun NFs were selective to acetone with excellent response/recovery speed (2 and 9 s) and stable performance [79]. As for VOCs, an essential factor for sensing performance is the bond dissociation energy [12, 220–225], which is temperature dependent and affects the optimum operating temperature. Morphology of the heterostructures is also important, as is the case for sensing the toxic gases NO2, H2S, and ammonia.
3.2. n–n heterostructures
The formation of n–n heterostructures induces band bending as in p–n heterostructures but the depletion layer appears owing to transfer of electrons from higher to lower energy levels. These heterostructures have been used for gas sensors, including TiO2/SnO2 [81, 226], CeO2/SnO2 [103] and SnO2/ZnO [227–230], as listed in table 4. Sensing performance can be enhanced with oxygen vacancies serving as active sites on the surfaces and interfaces of these heterostructures. Moreover, they tend to be mesoporous which is beneficial to adsorption and desorption of gas molecules, as exemplified with n–n core–shell TiO2/SnO2 electrospun NFs to detect acetone gas [81]. The latter authors also investigated similar NFs for comparison purposes. Figures 11(a)–(c) shows a FESEM image of electrospun NFs from TiO2–SnO2 core–shells, SnO2, and TiO2 core–shells. No broken NFs are observed. The NFs are uniformly deposited as indicated in the TEM images of figures 11(d)–(f). Optimized sensing performance occurred at 280 °C with TiO2–SnO2 for 100 ppm acetone in figure 11(g). The selectivity towards acetone is depicted in figure 11(h), which may not be sufficient for practical applications. Figure 11(i) shows the transient response behavior from concentration 10–1500 ppm to acetone gas, with no saturation after exposure to 500 ppm. Sensors for TEA also had operating temperatures around 260 °C [226], while n–n heterostructures with CeO2/SnO2, SnO2/ZnO, SnO2/Zn2SnO4 have been used to detect H2 and ethanol [66, 103, 231].

Figure 11. FESEM (a)–(c) and TEM (d)–(f) images of TiO2–SnO2 core–shell NFs, SnO2 NFs, and TiO2 core–shell NFs. (g) Sensor response vs operating temperature of TiO2–SnO2 core–shell NFs based, SnO2 NFs based, and TiO2 NFs based sensors to 100 ppm of acetone, respectively. (h) Selectivity plot of pristine materials and heterostructures to 100 ppm of various gases at 280 °C, 300 °C, and 320 °C, respectively. (i) Sensor response vs concentration for pristine materials and heterostructures to 10–500 ppm of acetone. Adapted from [81], Copyright 2017, with permission from Elsevier.
Download figure:
Standard image High-resolution imageTable 4. Gas sensing properties of n–n heterostructures.
| Analyte gas | Morphology | Composition | Operating temperature | Concentration | Sensor response | Response/recovery time | LOD | Selective against | Reference |
|---|---|---|---|---|---|---|---|---|---|
| TEA | Nanoparticles—nanosheets | TiO2/SnO2 | 260 °C | 100 ppm | 52.3 a | 12 s/22 s | 2 ppm | Ethanol, glycol, isopropanol, paraxylene, acetone, benzene | [226] |
| Acetone | Core–shell NFs | TiO2/SnO2 | 280 °C | 100 ppm | 13.7 a | 2 s/60 s | 10 ppm | Acetone, formaldehyde, methanol, ethanol, toluene, ammonia | [81] |
| Hydrogen | Nanoparticles | CeO2/SnO2 | 300 °C | 60 ppm | ∼1323 a | 17 s/24 s | 0.5 ppm | CO, CH4, NH3, NO2, ethanol | [103] |
| Ethanol | Nanorods | SnO2/ZnO | 275 °C | 100 ppm | 18.1 a | 3 s/38 s | 1 ppm | Xylene, toluene, formaldehyde, methanol, acetone | [66] |
| Ethanol | Porous spheres | SnO2/Zn2SnO4 | 250 °C | 100 ppm | 30.5 a | 2 s/114 s | 0.5 ppm | Acetone, methanol, formaldehyde, toluene, xylene | [231] |
| Hydrogen | Thin Films | SnO2–TiO2 | 400 °C | 20 ppm | 0.53 b | 12–14 s/4.5–5 min | 1 ppm | NA f | [228] |
| Trimethylamine | Hierarchical | Fe2O3/TiO2 | 250 °C | 50 ppm | 13.9 a | 0.5 s/1.5 s | 10 ppm | C7H8, HCHO, NH3, C3H6O | [180] |
| Ethanol | NFs | Nb2O5–TiO2 | 250 °C | 500 ppm | 21.64 a | NA f | 0.017 ppm | Isopropyl alcohol (C3H8O), acetic acid (CH3COOH), ammonia (NH3), methylbenzene (C7H8), nitrogen dioxide (NO2) | [229] |
| Ethanol | NFs | TiO2/V2O5 | 350 °C | 500 ppm | 24.6 a | 6 s/7 s | 20 ppm | Acetone, ammonia, methanol, toluene | [232] |
| Ethanol | NFs | ZnO–TiO2 | 320 °C | 50 ppm | 10.6 a | 5 s/10 s | 20 ppm | H2S, CH4, C3H6O, CO, CH3OH, C2H2 | [146] |
| Ethanol | Nanorods | MoO3/TiO2 | 180 °C | 10 ppm | 4.8 a | 40 s/40 s | 10 ppm | H2, NH3, CH4 | [233] |
| Ethanol | Nanowires | SnO2/ZnO | 400 °C | 100 ppm | 6.2 a | NA f | 25 ppm | NH3, CO, H2, CO2, LPG | [227] |
| NO | NFs | ZnO/CdO | 215 °C | 33 ppm | 22.6 a | 35 s/630 s | 1.2 ppm | NO2, H2S, CH4, SO2, CO, ethanol, acetone, ammonia, methanol, chloroform | [234] |
| Acetone | Nanoplates | ZnO/CdO | 30 °C | 100 ppm | 540 c | 61 s/47 s | 1 ppm | Formaldehyde (HCHO), ethanol (C2H5OH), benzene (C6H6), ammonia (NH3) | [63] |
| NO2 | Microspheres | SnO2–Sn3O4 | 150 °C | 50 ppm | 940 d | 25 s/14 s | 20 ppb | Ethanol, acetone, toluene, xylene, H2, CO, CH4 | [61] |
| NO2 | Hierarchical nanostructures | SnO2–ZnO | 150 °C | 10 ppm | 106 d | 50 s/55 s | 5 ppb | Acetone, C7H8, H2S, CHCl3, NH3, ethanol | [50] |
| NO2 | Heterojunction | ZnO/In2O3 | RT | 3 ppm | 1419.9 e | 13/189 s | 500 ppb | H2S, NH3, SO2, acetone and ethanol | [207] |
| H2 | Nanotubes | SnO2–decorated TiO2 | 250 °C | 1000 ppm | 1410 | NA f | NA f | NH3, CH4, C3H8, and NO2. | [235] |
| Ethanol | Hierarchical structure | SnO2/ZnO | 260 °C | 100 | 366 | 8/45 | NA f | Methanol, Acetone, Toluene, Benzene, Ammonia, TEA | [142] |
| NO2 | Composite | ZnO/In2O3 | RT (UV-LED) | 5 | 2.21 | 100/695 | NA f | NA f | [127] |
| Acetone | Hierarchical | Fe2O3/SnO2 | 250 °C | 100 | 16.8 | 7/54 s | NA f | Ethanol, Methanol, HCHO | [153] |
a S = Ra/Rg. b S = (Ra − Rg)/Rg × 100. c S = (Ig − Ia)/Ia × 100. d S = Rg/Ra. e S = (Rg − Ra)/Ra × 100. fNA—not available.
The sensing mechanism for n–n heterostructures is illustrated in figure 12(a) for TiO2/SnO2 core–shells, where electrons from TiO2 flow to the SnO2 layer. This increases the number of electrons in the shell to be captured by adsorbed oxygens, thus enhancing the sensing performance in comparison to devices made with pristine SnO2. Figure 12(b) shows a diagram for the energy band of the SnO2/ZnO n–n heterojunction in air and in ethanol gas. Electrons flow from SnO2 to ZnO to equalize the Fermi levels and create a depletion layer, leading to higher resistance of the composite material. Thus, when exposed to a reducing gas, the trapped electrons are released to the conduction band to increase sensor response.

Figure 12. Energy band diagrams and schematic models of n–n heterostructures for gas sensing based on SnO2 combined with (a) TiO2. Adapted from [81], Copyright 2017, with permission from Elsevier. (b) ZnO. Adapted from [66], Copyright 2019, with permission from Elsevier.
Download figure:
Standard image High-resolution image3.3. p–p heterostructures
Only a few manuscripts reported p–p heterostructures of metal oxides as gas sensors. For instance, TeO2–core/CuO–shell nanorods were used to detect different gases [236] and NiGa2O4–NiO heterojunctions were employed for selective detection of toluene and xylene [188]. The optimum operating temperatures were 150 °C and 175 °C for the sensors fabricated with TeO2/CuO and pristine TeO2, respectively. Some p–p heterostructures with CuO–NiO, Co3O4@CuO and, Co3O4/CuO have been used to detect H2S, ammonia and NOx [92, 237, 238]. Another p–p heterostructure with Cu2O/Co3O4 was used to detect various gases at 200 ppm, and the selectivity to H2S was higher than for other gases even at 1 ppm [239]. In our survey, we could not establish the reasons why there is so little in the literature for gas sensing with p–p heterostructures, which appears to deserve more attention.
4. Heterostructures of metal oxides with 2D materials
Gas sensors have been increasingly made from 2D nanomaterials such as graphene and transition metals dichalcogenides (MoS2, WS2) due to their outstanding properties, namely RT operation and accelerated electron transfer [4, 34, 240–245]. These features are desirable since most chemiresistive sensors are operated at high temperatures, with risk of sensor degradation and explosion. A list of architectures and materials with these properties can be found in [201]. However, pristine 2D nanomaterials have poor gas sensing performance [90, 246, 247]. The low selectivity/sensitivity of rGO is explained by the inherent stacking tendency and periodic honeycomb lattice carbon structure, leading to adsorption of any molecule. The sluggish recovery time is assigned to remnant carboxylic acids that increase the binding energy [247]. Pristine MoS2 strongly adsorbs atmospheric oxygen, which affects their activity and stability [246]. Various strategies are used to overcome these limitations, including external stimuli (heat, light) [242, 247–250], doping with noble metals [251, 252], exploring novel materials [253–258], and tailoring heterostructures by decorating with metal oxides. The last two strategies are the most attractive due to the myriad of possibilities to improve gas-sensing performance. Some examples exploiting heterojunctions with room- or low-temperature operation are discussed below.
The restacking problem was addressed by using single- and multiple-component crumpled 2D metal oxides, and graphene oxide as a sacrificial template [83]. As depicted in figure 13(a), the precursors were mixed with GO solution in a magnetic stirrer and the solution was nebulized through ultrasonic transducers in a tubular quartz reactor at 400 °C to promote shrinkage and compression of GO sheets. Crumpled heterostructures of GO/SnO2, GO/ZnO, and GO/Co3O4 display uniform submicron size as shown in figures 13(b)–(d). The effects from the crumpled morphology and heterojunctions on gas sensing properties were verified with gold electrodes modified with 0D SnO2, 2D SnO2, crumpled 2D SnO2, crumpled 2D SnO2/ZnO, and crumpled 2D SnO2/Co3O4. The data for the detection of acetone and formaldehyde are displayed in figures 13(e) and (f), where the highest sensor responses are observed for the crumbled heterostructures. A sensor array consisting of crumpled 2D SnO2, crumpled 2D SnO2/ZnO, and crumpled 2D SnO2/Co3O4 was used to analyze selectivity. When the combined data are visualized using principal component (PCA) in figure 13(g), one notes that formaldehyde and acetone are discriminated completely without any overlap with other interferences or gas analytes. Although sensitivity and selectivity issues were mitigated, the operational temperature of crumpled 2D metal oxides was still high (350 °C–400 °C) [83].
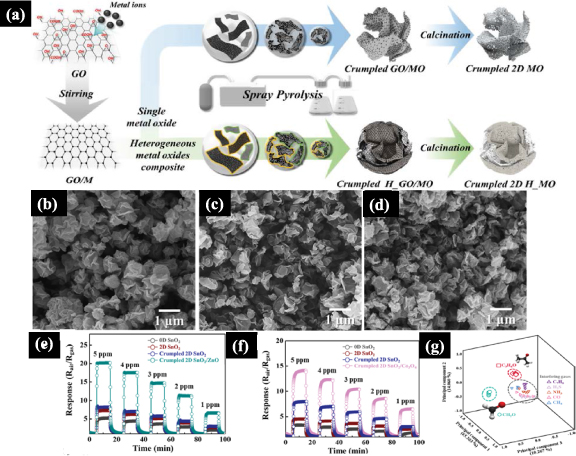
Figure 13. (a) Schematic illustration of SP method to fabricate crumpled 2D metal oxides and crumpled 2D heterogeneous metal oxides; (b)–(d) FESEM images of (b) crumpled GO/SnO2, (c) crumpled GO/ZnO, and (d) crumpled GO/Co3O4; (e) dynamic response transition of pristine and crumpled 2D SnO2/ZnO toward formaldehyde at 400 °C; (f) pristine and crumpled and crumpled 2D SnO2/Co3O4 toward acetone at 350 °C; (g) pattern recognition for gas analytes with classification based on PCA using the sensor array consisting of crumpled 2D SnO2, crumpled 2D SnO2/ZnO, and crumpled 2D SnO2/Co3O4. Adapted from [83] John Wiley & Sons. © 2019 WILEY-VCH Verlag GmbH & Co. KGaA, Weinheim.
Download figure:
Standard image High-resolution imageNanotubes of TiO2 were loaded with rGO to detect H2 gas, where the increased conductance upon adding rGO led to an enhanced response compared to the sensor with pristine TiO2 [259]. An even higher performance was obtained by using niobium-doped titanium dioxide (Nb–TiO2) nanotubes [260]. rGO was also used with cerium oxide (CeO2) nanocrystals to detect NO2 at RT but recovery was only reached under light exposure at λ = 365 nm [247]. The sensitivity of rGO/CeO2 heterostructures toward NO2 was increased by exploring the effect of oxygen vacancies on CeO2 nanoparticles via increasing the proportion of Ce3+ ions [261]. The enhancement was explained with first-principle calculations which indicated that CeO2 becomes metallic at a given proportion of Ce3+ ions [261]. Detection of NO gas at 60 °C was reached with SnO2 nanoparticles and Ni-decorated natural cellulosic graphene nanohybrid films (SnO2/Ni-NCG) [262]. Although the sensitivity is not the highest in the literature, the operating temperature is the lowest.
ZnO is one of the most studied metal oxides in gas sensors, but their commercial application has been hampered especially owing to the requirement of high-temperature operation. This limitation has been addressed with heterostructures from oxide nanostructures and 2D materials. For example, a ternary Pt/rGO/ZnO heterostructure was produced to detect H2 gas in the dark at 100 °C [42]. RT detection of H2 was made possible by taking advantage of plasmonic properties from gold nanoparticles with rGO and ZnO nanorods [41]. Figures 14(a)–(f) show SEM images of the various nanostructures, while the sensing performance of ZnO, rGO/ZnO and Au/rGO/ZnO is depicted in figures 14(g)–(i), including under UV irradiation. As expected, the performance of the ZnO nanorod gas sensor is highly dependent on the temperature. The response is further improved to 35% with the rGO/ZnO nanocomposite, which decreased the optimal temperature to 150 °C under UV irradiation. The most significant improvement was observed for the Au/rGO/ZnO nanocomposite that reached 96% with fast response/recovery times of 8/612 s at RT under UV light. It is worth mentioning that a long-term experiment of Au/rGO/ZnO kept the response approximately constant for over 60 d. The proposed H2 sensing mechanism is schematically as follows: when the sensor is exposed to ambient air, oxygen molecules are adsorbed on the sensor surface, making the electrical resistance increase due to the decrease in the carrier charge density depletion layer (figure 14(j)). When exposed to UV light under an air atmosphere as in figure 14(k), abundant electrons and holes are generated on the sensor surface, increasing the depletion region width and decreasing the electrical resistance. The exposure of the Au/rGO/ZnO sensor to H2 gas represented in figure 14(l) leads to water as a product of ionized oxygen species and H2 molecules reaction. This decreased the electrical resistance due to the release of trapped electrons back to the bulk of the sensor [41].
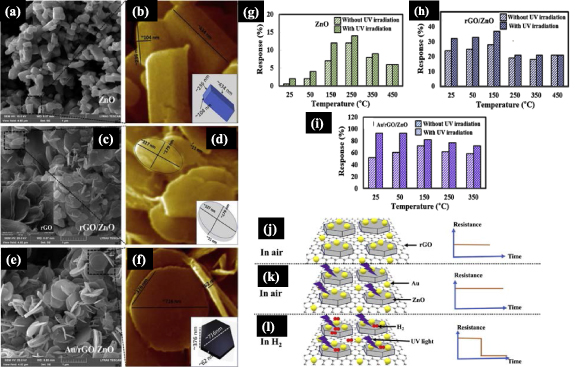
Figure 14. SEM images of: (a) pristine ZnO; (c) rGO/ZnO; (e) Au/rGO/ZnO. Inset of (c): rGO only. High-resolution SEM images and dimensions of: (b) pristine ZnO; (d) rGO/ZnO; (f) Au/rGO/ZnO. Individual insets represent typical dimensions of as-synthesized nanostructures. Comparison of the response of (g) pristine ZnO, (h) rGO/ZnO, and (i) Au/rGO/ZnO sensor with and without UV irradiation at different operating temperatures. Gas sensing mechanism of Au/rGO/ZnO sensor in (j) air (k) air with UV light, and (l) H2 environment with UV irradiation. Adapted from [41], Copyright 2019, with permission from Elsevier.
Download figure:
Standard image High-resolution imageThe discrimination of similar molecules remains a challenge for metal oxide gas sensors [263]. This can be achieved using the concept of electronic noses according to which the global selectivity principle with a combination of various sensing units is applied to solve problems related to selectivity. A multisensory system comprising three heterostructured materials was prepared via a one-step hydrothermal route and layer-by-layer (LbL) technique, as shown in figure 15(a) [264]. Tin dioxide (SnO2) nanospheres and copper oxide (CuO) nanoflowers-decorated graphene were used as active layers for sensors and deposited on Cu/Ni interdigitated electrodes. The I–V measurements collected at RT as depicted in figure 15(b) led to different profiles depending on the gas and on the sensing unit, which were analyzed with a machine learning algorithm. Figure 15(c) illustrates the data processing procedure with which a quantitative prediction of formaldehyde (HCHO) and ammonia (NH3) in gas mixtures was obtained using a backpropagation neural network model. The adequacy of the machine learning model was confirmed by noting the high correlation between the predicted and measured concentrations in figure 15(d). This kind of machine learning model is widely used for pattern recognition and quantitative prediction in many fields [265–272].

Figure 15. (a) LbL fabrication of MOx/graphene composites as sensing films; (b) experimental setup of sensor array toward ammonia and formaldehyde sensing; (c) the schematic illustration of sensor array detection combining with the neural network model; (d) comparison between the prediction values and experimental calibration values of formaldehyde (HCHO) and ammonia (NH3). Reprinted from [264], Copyright 2017, with permission from Elsevier.
Download figure:
Standard image High-resolution imageMoS2 nanosheets are being considered as an alternative material to graphene that has zero bandgap structure, with MoS2 bandgap ranging from 1.5 to 3 eV [273]. The activity and stability of pristine MoS2 are strongly hindered by atmospheric oxygen adsorption, though. Elegant solutions to this problem consist of metal doping, using heterojunctions, and decoration with metal oxides. Metal doping provides high sensitivity [274, 275], while high-entropy alloys (HEA) such as Ag, Au, Pt, Pd, Cu are relatively cheaper. MoS2 sheets decorated with HEA nanoparticles were used to detect H2 gas at 80 °C, with a similar performance to MoS2 sensors doped with pure metal nanoparticles [276]. Cu2O–MoS2 microspheres were utilized for ammonia sensing at 130 °C [277], and RT detection was achieved with MoS2/NiO heterostructures [90]. Also possible to operate at RT was the NO2 gas sensor made with MoS2@MoO2 n–p heterojunctions [246], and the ethanol vapor sensor fabricated with multilayered hierarchical α-Fe2O3/MoS2 heterostructures [278]. The main significance of the latter work was in the ultrafast response of an ethanol sensor operating at RT, which did not require sophisticated preparation methods. It is worth mentioning that sensing performance for the same materials may depend on the fabrication procedures and conditions. For instance, the thickness of the MoS2 layer in MoS2/ZnO heterostructures was an important factor detecting NO2 [279]. Whether a RT operation is made possible also depends on the fabrication method. This was reached for NO2 detection with MoS2/ZnO heterostructures prepared either with a chemical precipitation process [249] or a wet chemical method [67].
The 2D materials referred to as MXenes are transition metal carbides, nitrides, and carbonitrides with the general formula Mn +1 XnTx , where M is an early transition element (Ti, Nb, V, Cr, Mo, Ta), X are layers of C and/or N, Tx represents the surface termination groups (–OH, –O, –F) and n varies from 1 to 4 [280]. They have been used in various gas sensors, as in the case of pristine Ti3C2Tx MXene whose signal-to-noise ratio was considerably higher than other 2D materials [281, 282]. However, aggregation is still an issue comprising their sensitivity and selectivity. A flexible sensor for NO2 was produced from pristine 3D crumpled MXene Ti3C2Tx spheres and a Ti3C2Tx /ZnO composite via ultrasonic SP, as depicted in figure 16(a). The crumpled nature of MXene and composite structures is confirmed in the SEM images in figures 16(b) and (f), while maps of elemental analysis are displayed in figures 16(c)–(e) and 16(g)–(j) [283]. It is important to remark that Ti3C2Tx MXenes are adequate for sensing NOx species, but not for some VOCs and ammonia, which can be addressed by combining MXenes with CuO [284].
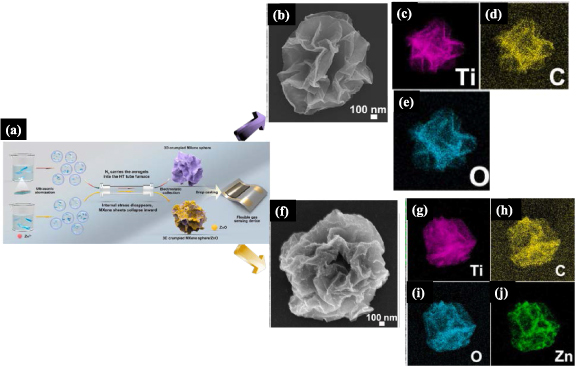
Figure 16. (a) Schematic illustration of the preparation of 3D crumpled MXene sphere and 3D crumpled MXene sphere/ZnO, and then the flexible gas sensor. Morphology and element distribution of 3D crumpled MXene. (b) SEM images of 3D crumpled MXene sphere. (c)–(e) EDS maps for Ti, C, and O. (f) Morphology and (g)–(j) EDS for 3D crumpled MXene sphere/ZnO EDS of Ti, C, O, and Zn. Adapted from [283], Copyright 2021, with permission from Elsevier.
Download figure:
Standard image High-resolution imageThe articles mentioned above are demonstration of the advances in gas sensing through novel heterostructures that operate at a room- or low-temperature, thus addressing some of the challenges hampering commercialization. There is nevertheless plenty of room for improvements to reach gas sensors that operate at RT and detect multiple analytes without suffering from interfering issues. To fulfill these stringent requirements, we suggest that efforts should be made to develop gas sensor arrays combined with artificial intelligence methods for data analysis.
5. RT gas sensors made of MOHs
We have already mentioned that gas sensors made with metal oxides are usually operated at high temperatures. In order to reach detection at the desired RT, researchers have used various strategies, including surface modification using noble metal nanoparticles or metal/metal oxide doping [70, 71, 209]. Table 5 summarizes the details of RT sensors to detect toxic gases with MOHs. For example, Al-doped ZnO/CuO nanocomposites were used to detect ammonia selectively and at RT, with fast response (14 s) and recovery (9 s) [68]. NO2 sensors produced from SnO/SnO2 p–n heterostructures could operate at RT and high sensitivity, but the recovery speed was poor (5 min) [120]. Another important factor for RT sensors is humidity, for sensors have to maintain their performance under varying humidity conditions. This has been achieved with H2S sensing at 70 °C and relative humidity from 11% to 95% using CuO/In2O3 heterostructures with MOFs [73], and with ammonia detection at RT using tin–titanium dioxide/reduced graphene/carbon nanotube (Sn–TiO2@rGO/CNT) composites [74]. Sensing performance at RT can also be enhanced via illumination or doping with 2D materials. Indeed, MoS2/ZnO hetero-nanostructures were employed to detect NO2 at low ppb concentrations at RT [67].
Table 5. RT gas sensors made of MOHs.
| Heterostructure | Morphology | Target gas and concentration (ppm) | Sensor response | Response/recovery speed | LOD | Selective against | Reference |
|---|---|---|---|---|---|---|---|
| ZnO/SnO2 | Thin films | NH3 (20) | 1.1 | 300/—s | 5 ppm | NA c | [291] |
| In2O3/CuO | NFs | NH3 (100) | 1.9 a | 2/—s | 0.3 ppm | H2S, H2, CH4, CO | [292] |
| Cr2O3/ZnO | Thick films | NH3 (300) | 13.7 a | 25/75 s | NA c | LPG, CO2, C2H5OH, H2, Cl2 | [293] |
| NiO/ZnO | Nanocones | NH3 (50) | 42 b | 27/150 s | ∼15 ppm | Chloroform, toluene, ethylacetate, formaldehyde, iso-propanol, dichloromethane, heptane | [294] |
| CuO/TiO2 | Nanoparticles | NH3 (50) | 97 b | 2/55 s | ∼5 ppm | Hydrogen Sulphide, LPG, ethanol | [295] |
| CuO/MNO2 | Flowers/sheets | NH3 (100) | 135 b | 120/600 s | 20 ppm | NA c | [85] |
| Silica/CeO2 | Nanoparticles | NH3 (80) | 3244 b | 750/—s | 0.5 ppm | H2, H2S, C2H5OH, CO, NO2 | [296] |
| Fe2O3/ZnO | Nanorods | NH3 (0.4) | 10 000 | 20/20 s | NA c | TMA, methanol, ethanol | [297] |
| NiO/WO3 | Plates | NO2 (30) | 4.8 | 2.5/1.1 s | 5 ppm | CH4, CO, H2, NO, SO2, NO2 | [298] |
| NiO/SnO2 | Nanosheets | NO2 (60) | ∼7.5 a | NA c | ∼5 ppm | NH3, C7H8, HCHO, C2H5OH, CO | [299] |
| NiO/CuO | Flower-like | NO2 (100) | 77.16 b | 2 s/— | 1 ppm | CO, CH4, H2 | [119] |
| CaO/SnO2 | Rod-like | NOx (97) | 6.63 a | — | 10 ppb | NH3, H2, CO | [300] |
| In2O3/SnO2 | Nanorods | NOx (100) | 8.98 a | 4.67/—s | 0.1 ppm | NH3, H2, CO | [301] |
| In2O3/TiO2 | NFs | NOx (97) | 41.1 b | 3/—s | 97 ppb | NH3, H2, CO | [302] |
| Al2O3/TiO2 | Nanotubes | NOx (97) | 88.04 b | ∼8/∼8 s | 0.97 ppm | Not available | [303] |
| K2O/In2O3 | Nanowires | NOx (97) | 151.78 a | 12/—s | 48.5 ppb | Not available | [304] |
| NiO/In2O3 | NFs | H2S (3) | 6 | 14/22 s | 3 ppm | C2H5OH, CH3OHCH3, CH3OH, NH3, C6H5CH3, C6H6, CH4, H2, C2H2 | [305] |
| CuO/ZnO | Nanorods | H2S (0.5) | 25 b | 180/15 s | ∼0.5 ppm | Ethanol, NH3, CO2, H2, acetone | [306] |
| SnO2/NiO | Thin films | H2S (10) | 440 | NA c | 100 ppb | NO, NH3, C2H5OH, CO, CH4 | [307] |
| In2O3/ZnO | Core–shells | H2S (10) | 925 b | NA c | 20 ppm | Carbon disulfide, ethanol, methanol, formaldehyde, acetone | [94] |
| Cu2O/Co3O4 | Nanoarrays | H2S (20) | ∼2600 | ∼100/∼100 s | ∼0.1 ppm | NH3, H2, C7H8, C3H6O, HCHO | [239] |
| SnO2/CuO | Heterojunctions | H2S (1) | 3672 a | 15/—s | 10 ppm | LPG, NH3, CO2, C2H5OH, H2, Cl2 | [308] |
| NiO/Nb2O5 | Nanoparticles | H2 (500) | 1.68 | 100.42/524.84 s | NA c | Ethanol, CO, methane | [309] |
| Cr2O3/Nb2O5 | Nanoparticles | H2 (200) | 5.24 | 40/—s | NA c | Ethanol, NH3, H2S | [310] |
| ZnO/CuO | Nanoparticles | Alcohol (20) | 3.32 | 62/83 s | ∼150 ppm | Not available | [311] |
| VO2/ZnO | Heteronanostructures | Acetone (100) | 4.51 | 8/18 s | ∼10 ppm | Isopropanol, hydrogen, methane, ethanol | [312] |
| ZnO/SnO2 | Heterojunctions | Ozone (0.06) | 12 | 13/90 s | 20 ppb | NO2, NH3, CO | [54] |
| CuO/ZnO | Thick film | Cl2 (300) | 195 a | 18/50 s | NA c | LPG, NH3, CO2, C2H5OH, H2, H2S | [313] |
| α-Fe2O3/ZnO | Nanowires | Ethanol (700) | 706.8 | NA c | ∼100 ppm | H2S, methanol, acetone, formaldehyde | [314] |
aΔR/Rg or ΔR /Ra (for reducing and oxidizing gases respectively). b(ΔR/Rg) × 100% or (ΔR/Ra) × 100% (for reducing and oxidizing gases respectively). cNA—not available.
In this review paper, we have so far concentrated only on the challenges and opportunities to exploit MOHs in gas sensors, with no emphasis on their possible integration into other devices and monitoring systems. We now highlight the prospects of using these materials in sensors that may exhibit special characteristics, such as being self-powered. This topic has grown rapidly with piezoelectric and triboelectric nanogenerators, including gas sensing properties [285–290]. For example, a selective self-powered RT H2S sensor was obtained with the NiO/ZnO nanowire arrays in figure 17(a) [209]. The sensor device was connected with a low-noise preamplifier to monitor the piezo-voltage response upon exposure to H2S gas. Figures 17(b) and (c) show the selectivity histogram of the sensor for toxic gases individually and in a mixture. The piezo-voltage response in figure 17(d) was ten times the value for pure ZnO, with a low detection limit of 10 ppm. Other examples of heterostructures utilized in self-powered room RT gas sensors are described in [1, 289, 290].

Figure 17. (a) Schematic illustration of a self-powered RT H2S sensor prepared using NiO/ZnO nanowires array. Selectivity histogram of self-powered NiO/ZnO-based sensor towards (b) individual and (c) mixture of toxic gases. (d) Piezo-voltage response vs H2S concentration by applying 30 N of compressive force, with the inset showing the signal close to the detection limit. Adapted from [209], Copyright 2016, with permission from Elsevier.
Download figure:
Standard image High-resolution image6. Factors affecting sensing performance of heterostructures
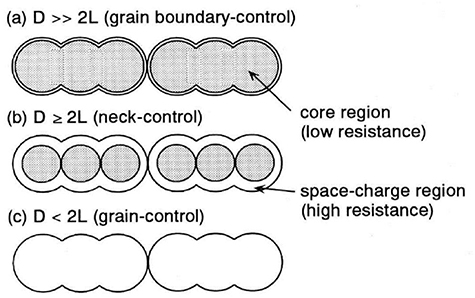
Sensing performance is affected by various environmental factors and device characteristics, such as humidity, temperature, film thickness, electrode area, and particle size/shape [315]. The grain size and width of the necks, in particular, play a major role [316, 317], which can be understood by considering the model depicted in figure 18, where different parameters are proposed to control the properties. Smaller grain sizes offer high surface area and, therefore, higher sensitivity, while larger grain sizes lead to less homogeneous and stable materials. For larger grains where D (grain size) ≫ 2 l, grain size is unaffected by the surface interaction, and resistivity is dominated by the grain boundaries. When D = 2 l, grain size decreases in the depletion region, and the necks become more resistant (neck control). If D < 2 l, the depletion region extends to the whole area of grains and the resistivity is governed by the grain size effect (grain control) [318]. The Debye length (LD) can be related to the grain size (d) or neck width as in equation (2):
Figure 18. Grain size conductance dependence in semiconductor metal oxides (a) grain boundary control (D ≫ 2 l) (b) neck control (D = 2 l) (c) grain control (D < 2 l). Adapted from [316], Copyright 1991, with permission from Elsevier.
Download figure:
Standard image High-resolution image
where T is the absolute temperature, ε is the dielectric constant of the material, k is the Boltzmann constant, and N is the number of charge carriers. The grain size affects the gas sensing properties, as observed with acetone sensing at ppb level with core–shell ZnO–CuO p–n heterojunctions, where performance increased with small grain sizes and large surface areas [319]. Another approach to enhance sensitivity is to control morphology and porosity of oxide heterostructures [320].
Another critical factor for sensing performance is humidity, since an increased humidity may decrease the sensor response because chemisorbed water molecules will diminish the adsorbed oxygen species following the Grotthuss mechanism [321, 322]. Because heat treatment at 400 °C could desorb these water molecules, most metal oxides work at high temperatures to achieve high sensor response [323, 324]. This also illustrates the importance of the operating temperature [20, 325–327]. At low temperatures, the reaction rate is slow and the sensor response is relatively small. Upon increasing the temperature, the response gradually increases because of exothermic reactions between gas molecules and adsorbed oxygen species. However, when the temperature increases above a threshold value, the desorption of chemisorbed oxygen is enhanced to a higher rate than the reaction rate. The activation energy of the gas is not sufficient to cross over the conduction band, thus leading to a decrease in response. Strategies to overcome the problems related to the operation temperature include the use of a heating platform to save power consumption, in addition to surface modification and metal doping [328].
Film thickness and effective area of the sensing units may also affect the performance. For instance, reducing film thickness from 600 to 50 nm led to a five-fold increase in the response of SnO2 sensors to ethanol, which was explained by the easier penetration of gas molecules to enhance the adsorption–desorption process [329, 330]. It is also relevant that reducing film thickness makes it possible to reduce power consumption and increase the measurement accuracy [329, 331].
7. Concluding remarks, perspectives and challenges
In this review, we have summarized the recent advances in gas sensors made with MOHs, including gas sensing mechanisms and the search for enhancing sensing performance for a variety of gases. Interest in these heterostructures arises from their large specific surface area, low cost, facile fabrication and fast adsorption–desorption towards target gases. Applications of such gas sensors encompass monitoring systems in the health and environment sectors, in many cases with the performance using heterostructures being higher than that obtained with the corresponding pristine materials. Architectures based on n–n, n–p, and p–p semiconducting oxides have been used in chemiresistive gas sensors. Also discussed in the review were the fabrication methods which include solvothermal, hydrothermal and electrospinning techniques, with which different shapes and morphologies could be obtained for tailoring the sensing properties. The main challenge with regard to fabrication methods is the need of upscaling for the various heterostructures such as core–shell, layered, and 1D–1D, 1D–2D, and 2D–2D heterostructures. Fortunately, these heterostructures typically have a lower optimum working temperature than their pristine materials, which allows to partially mitigate the diffusion mechanism [25].
Upon surveying the limitations of the heterostructures for gas sensors, we identified those mainly related to the operation temperature, selectivity and stability. Strategies to improve selectivity of these heterostructures include: (i) incorporating suitable additives, (ii) temperature control, (iii) using appropriate filters, (iv) UV-light illumination [332]. Materials should be selected which possess high catalytic activity against the target gas, and complex structures should be designed without affecting the properties of the heterostructures, such as surface area, porosity, electrical conductivity. Noble metals such as gold and palladium, for example, have catalytic activity against CO and H2 gas [333, 334], which can be increased upon controlling morphological parameters such as size and shape. The combination of metal oxides and 2D materials such as MXenes or conducting polymers is promising, but the sensing mechanism has not been determined accurately. Sensing efficiency can be achieved by electronic and chemical sensitization to regulate charge carrier concentration with electrons being transferred from metal ions to MOHs. Such heterostructures should therefore be designed with materials with different work functions. The selectivity problem may be overcome by using a set of microsensor arrays, particularly with the use of advanced data analysis methods, including machine learning.
In spite of the difficulties mentioned about the operation temperature, many examples exist of RT sensors. Operation under high humidity is still a serious issue, as is the response time. The power consumption problem may be solved by miniaturizing the sensors using microfabrication (microelectromechanical systems) techniques. These micro-level sensors can be fabricated by incorporating hotplates with a sensitive sensing element. Since humidity affects the operating temperature, it is essential to develop a gas sensing material that resists humidity interference. MOFs can provide new perspectives for interference for these sensors.
Another avenue to pursue is to fabricate flexible, wearable devices, especially for healthcare [335–338]. Among the challenges in this topic is the use of polymer or cellulose materials in the substrates [1], which is restrictive for most metal oxide materials because of their low glass transition temperature. This requires another synthesis strategy with a low-temperature chemistry method. For example, one may post-transfer the nanomaterial to the flexible electrodes by drop-casting [283], preferably at RT. In addition, the sensing material must endure mechanical strain without affecting the sensing performance [339]. As for scaling up devices, screen-printing with nanocomposite inks may be a viable alternative. The search for the solution to these problems offers a myriad of possibilities.
As a conclusion, we take the view that MOHs may have a tremendous impact on chemical sensing. This will require experimental and theoretical work to determine sensing mechanisms and exploit new materials such as transition metal dichalcogenides, MXenes, black phosphorous, and other carbon materials.
Acknowledgments
This work was carried out with financial assistance from the Brazilian funding agencies: São Paulo Research Foundation-FAPESP (2014/23546-1, 2015/14836-9, 2016/23474-6, 2018/22214-6) and National council for scientific and technological development—CNPq (308570/2018-9).
Data availability statement
No new data were created or analyzed in this study.
Author contributions
All the authors have contributed equally to this work.
Conflict of interest
The authors declare no conflict of interest.