

Abstract
Transiently evoked otoacoustic emissions (TEOAEs) are routinely used in the hearing assessment of the auditory periphery. The major contribution of TEOAEs is the early detection of hearing losses in neonates, children, and adults. The evaluation of TEOAE responses by specific signal decomposition techniques offers numerous advantages for current and future research. One methodology, based on recurrence quantification analysis (RQA), can identify adult subjects presenting sensorineural hearing impairments. In two previous papers, the RQA-based approach was successfully applied in identifying and classifying cases presenting noise and age related hearing losses. The current work investigates further two aspects of the previously proposed RQA-based analysis for hearing loss detection: (i) the reliability of a Training set built from different numbers of ears with normal hearing, and (ii) the threshold set of values of the key hearing loss detecting parameter RAD2D. Results: The Training set built from 158 healthy ears was found to be quite reliable and a similar but slightly minor performance was observed for the training set of 118 normal subjects, used in the past; the proposed ROC-curve method, optimizing the values of RAD2D, shows improved sensibility and specificity in one class discrimination. Conclusions. A complete and simplified procedure, based on the combined use of the traditional TEOAE reproducibility value and on values from the RQA-based RAD2D parameter, is proposed as an improved automatic classifier, in terms of sensitivity and specificity, for different types of hearing losses.
Export citation and abstract BibTeX RIS

Original content from this work may be used under the terms of the Creative Commons Attribution 4.0 licence. Any further distribution of this work must maintain attribution to the author(s) and the title of the work, journal citation and DOI.
1. Introduction
Otoacoustic emissions (OAEs) are nonlinear signals (Kemp 1978) which can be recorded in the external ear canal; at present, they are widely used in neonatal hearing screening (Cianfrone et al 2018, Sheng et al 2021) and in various clinical applications related to the identification of hearing losses in children and adult subjects. A sub-class of OAEs, evoked by transient stimuli, are called transiently-evoked otoacoustic emissions (TEOAEs). A specific parameter, termed as TEOAE reproducibility -WWR-, is used for the evaluation of whether a TEOAE signal can be accepted as valid, within a specific frame of screening criteria. In previous papers, a statistical analysis of TEOAE signals, based on estimates of Principal Component Analysis (PCA) via a Recurrence Quantification Analysis (RQA) approach, was proposed as a means to early identify subjects with hearing losses (HL) (Zimatore et al 2020a, 2020b). The proposed approach used two subsets of data: (i) a subset of TEOAE signals from normal subjects, assigned to a Training Set; and (ii) a second subset of TEOAE signals recorded from pathological or suspected-pathological ears, assigned to a Test Set. The data from the previously published papers suggested that the proposed methodology could early detect the hearing impairment at the 4 kHz-notch (cases presenting noise induced hearing losses - NIHL) and other TEOAE signal alterations resulting from age-related hearing losses (ARHL). In particular, the parameter RAD2D, which takes in account the Euclidean distance from the origin of principal component reference system, was defined in those papers as a threshold parameter able to discriminate between normal and pathological signals. The combined use of the WWR and RAD2D values resulted in an improved classification in terms of sensitivity and specificity, for both pathological conditions (NIHL and ARHL).
The present paper aims: (i) to test possible improvements in the classification procedure by increasing the number of normal subjects (Training set) and to evaluate whether the achieved results are significantly dependent on the Training set used; (ii) to find an automatic procedure resulting in an optimized selection of the RAD2D value (previously identified from the mean value of the Testing set, see Zimatore et al 2020a, 2020b). The latter is a crucial step in the optimization process, because RQA is a non-linear method in which the correct choice of the input parameters is not always trivial and can influence the results (Henriques et al 2020).
The paper is structured as follows: (i) a validation of the Training set is conducted by reckoning PCA on different sets employing different subsets of signals from normal hearing subjects (specifically from 100, 80 and 40 TEOAE responses) of the 118 signals used in the previous papers, and from a combination of different responses from normal hearing adults (specifically, 222, 158, 104 and 40 TEOAE responses) collected in different experimental sessions; then, the results are compared in terms of classification efficiency (sensitivity and sensibility) with the first Training set; (ii) an automatic procedure is proposed, based on a statistical approach, which optimizes the RAD2D threshold value. The work-flow and additional details are reported in Supplemental Materials A-D.
2. Methods
2.1. Subjects
The present study was carried out on volunteers some of whom had subjective complaints concerning their hearing. A total of 337 TEOAE responses were collected during several experimental sessions and were classified in two groups: a Training set and a Test set, composed by 158 and 182 TEOAEs, respectively. Only normal hearing subjects were considered in the Training set, according to the hearing threshold definitions presented in previous papers (Zimatore et al 2020a, 2020b). The 158 TEOAE responses of the Training set were composed by the 118 responses used in Zimatore et al 2011, and Zimatore et al 2020a, 2020b, and from 40 normal responses, purposely collected for this paper. In the Test set the 182 TEOAE responses were collected from 83 subjects presenting an ARHL, 35 subjects presenting a NIHL and 64 normal subjects. ARHL and NIHL are treated as two distinct classes of hearing deficits. The normal subjects included in the Test and Training sets were not the same.
The 182 TEOAE responses in the Test set were initially classified by their corresponding pure-tone hearing threshold. The TEOAE WWR estimate was automatically provided by the acquisition software (ILO92 device, Otodynamics UK, running software version ILO 6.1). Examples of the TEOAE responses captured by the acquisition software are shown in Supplementary materials-E, figure E.1 (available online at stacks.iop.org/BPEX/8/055021/mmedia). The TEOAE responses were saved as sets of time series which were subsequently analyzed by the RQA-based method. The values of the RAD2D parameter were derived by the RQA-based method, consisting in the evaluation of the RQA parameters and subsequent elaboration through the PCA analysis. Then, the values of the RAD2D parameter were derived in the PCA plane (see section 2.2). Table 1 reports the WWR and RAD2D parameters with the corresponding mean and standard deviations (sd) for the TEOAE responses from the Training and Test set cases. A t-test confirmed that these parameters were significantly different between the NIHL and ARHL groups with respect to the Normal group of the Test set (see table 1).
Table 1. RWWR and RAD2D parameters for the TEOAE responses from the Training and Test set cases.
| Training set | Test set | |||||
|---|---|---|---|---|---|---|
| Normal | Normal | NIHL | ARHL | Normal | ||
| n | (118) | (158) | (35) | (83) | (64) | |
| WWR | mean | 93.9 | 91.3 | 56.5 | 40.5 | 84.3 |
| sd | 4.0 | 6.5 | 27.2 | 31.3 | 16.5 | |
| RAD2D | mean | 1.2 | 1.2 | 2.4 | 3.2 | 1.5 |
| sd | 0.7 | 0.7 | 1.3 | 1.6 | 0.9 | |
| Two-tailed t test a | p < 0.01 | p < 0.01 | ||||
2.2. Analysis
2.2.1. Recurrence quantification Analysis (RQA)
RQA can be defined as a graphical, statistical and analytical tool used by several disciplines from physiology (Zbilut et al 2002, Marwan et al 2013, Zimatore and Cavagnaro 2015, 2020a, 2021) to earth science (Zolotova and Ponyavin 2007, Marwan et al 2009, Zimatore et al 2017) and economics (Crowley and Schultz 2011, Orlando and Zimatore 2020a, 2020b). The RQA-based method employed in the analysis of TEOAE responses is explained in detail in previous papers (Zimatore et al 2020a, 2020b). For sake of clarity, a supplementary material explains the procedure; additionally, details can be found at http://www.recurrence-plot.tk/ (Zbilut et al 2002) and at http://homepages.luc.edu/cwebber.
Considering that each TEOAE response is composed by 512 points, the RQA parameters were used with the following settings: start = 70, lag = 1, embedding = 10, radius = 15, line = 8, rescaled to meandist (mean distance).
2.2.2. Principal component analysis (PCA)
PCA is a common statistical technique (Bartholomew 1984) applied in many different contexts (Zimatore et al 2020a), and provides interesting features such as: (i) a reduction of the dimension of the data, without any consistent loss of information; and (ii) the ability to clearly separate the independent features which characterize the data set.
In this paper the TEOAE responses were processed by RQA first, then by PCA. In particular, PCA was performed on the three main RQA measures: the percent of recurrence (REC), the percent of determinism (DET) and the Shannon entropy (ENT). Following these two analyses, the two-dimensional parameter RAD2D was calculated for each TEOAE signal as the Euclidean distance from the origin of the principal component reference system (for additional details see the Supplementary materials). In figure 1 the TEOAE responses of the Training test signals are shown in the plane PC1 versus PC2. A circle of radius (RAD2D) equal to 2 selects the 96% of normal responses (p < 0.05).
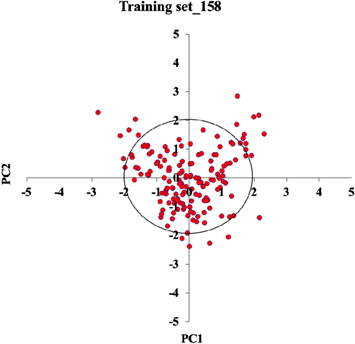
Figure 1. PC1 versus PC2 plot of the signals in the Training set composed by 158 TEOAE responses. A circle of radius 2 sd, in the case of normal distribution, selects the 96% of Normal signals (p < 0.05).
Download figure:
Standard image High-resolution image2.2.3. Receiver operating characteristics (ROC)
The ROC curve is a performance measurement for a classification. When there is a need to check or visualize the performance of a multi-class classification problem, the ROC curve (sensitivity versus 1-specifivity for different cut-off values) can estimate the best (i.e., optimized) value for the threshold, on the basis of various clinical observations (Zou et al 2007). In this paper, the ROC curve metric was applied at various RAD2D threshold settings.
2.2.4. Experimental procedure in five steps
The proposed procedure for the analysis of the TEOAE responses in the Test set, is the following:
- I.The RQA parameters (REC, DET,ENT) are estimated from the TEOAE data of the Training set.
- II.The PC1 and PC2 components (and factor loadings) of the RQA parameters are estimated from the Training set.
- III.The RQA parameters are calculated from the TEOAE data of the Test set.
- IV.The PC1* and PC2* components of the RQA parameters are obtained from the factor loadings of Training set. From those the RAD2D values are calculated.
- V.The RAD2D and WWR values are concurrently used to optimize the discrimination of the TEOAE responses from normal versus subjects with hearing deficits.
The PCs at point IV are named PC1* and PC2* because are not estimated from the Test set but are the result of the product of the RQA measures multiplied by the factor loadings reckoned from the TEOAEs in the Training set.
In this paper, considerable attention was dedicated on steps I, II and III, in order to investigate the suitability of the data assigned to the Training set and to test the invariance of the previously achieved results, with respect to different size Training sets. Subsequently, a new optimized definition of the RAD2D threshold level was proposed, confirmed by the visual ispection of a WWR versus RAD2D plot (Steps IV e V).
3. Results
3.1. Training set validation
To evaluate possible bias effects due to sample-size, the Training set made by 118 TEOAE responses used in previous papers (Zimatore et al 2020a, 2020b), was subdivided in various smaller sample sub-sets. The data reported in table 2 show the factor loading values of the first three PCA components, evaluated from the RQA parameters with 118 TEOAE responses (in italics) and three sub-sets of 100, 80 and 40 responses, respectively. The value of the explained variance (PVE) shown in table 2, presents the percentage of explained variability and the amount of information embedded in each component. The table shows that the PCA factor loadings correlate well between the 4 RQA estimates and the correspondings PCA components, since for the latter their amplitude and signs do not change across the different sub-sets (i.e. for the samples of 118, 100, 80 and 40 responses). The PVE of the PC1 corresponds to approximately 89% in all cases, with a maximum variation of 1.6% between the Training sets of 118 and 80 samples. The remaining variability is encoded in PC2 and PC3, with a maximum variation among the different Training sets of about 27.6% on PC2 (118 versus 40). PC2 encodes about 7%–9% of the signal variability. Since, the PVE of the PC3 component corresponds to approximately 3%–4% of the total PVE (1/30 of PC1), its values can be neglected in the definition of the RAD2D.
Table 2. PCA Factor loadings (values) for the main RQA parameters recurrence (REC), determinism (DET) and Shannon entropy (ENT). These were calculated from 3 sub-sets of the group of 118 normal TEOAE responses (i.e. sets of 100, 80, 40 samples), used in previous papers as the Training set; the percent of explained variance (PVE) in percentage is reported for every subset.
| 118 | PC1 | PC2 | PC3 |
|---|---|---|---|
| REC | 927 | 373 | 039 |
| DET | 948 | −,225 | 227 |
| ENT | 955 | −,139 | −,263 |
| PVE (%) | 88,970 | 6,963 | 4,067 |
| 100 (118) | PC1 | PC2 | PC3 |
| REC | 927 | 373 | 039 |
| DET | 948 | −,225 | 227 |
| ENT | 955 | −,139 | −,263 |
| PVE (%) | 88,689 | 7,446 | 3,865 |
| 80 (118) | PC1 | PC2 | PC3 |
| REC | 908 | 417 | 030 |
| DET | 944 | −,236 | 229 |
| ENT | 953 | −,163 | −,255 |
| PVE (%) | 87,511 | 8,549 | 3,940 |
| 40 (118) | PC1 | PC2 | PC3 |
| REC | 930 | 349 | 110 |
| DET | 934 | −,337 | 121 |
| ENT | 975 | −,011 | −,221 |
| PVE (%) | 87,949 | 8,880 | 3,171 |
To better explore the possible sample size induced-variability, larger samples were also generated, containing 222, 158, 118, 104, and 40 responses (222 = 118 + 64 + 40, 158 = 118 + 40, 104 = 64 + 40, in italics the data from the original Training set of the 118 responses). The 64 normal responses belong to the Test set data. The corresponding PCA factor loading values are shown in table 3.
Table 3. Factor loadings for the main RQA measurements: recurrence (REC), determinism (DET) and Shannon entropy (ENT) calculated from 5 different Training sets; the percent of explained variance (PVE) in percentage is reported for every set.
| 222 | PC1 | PC2 | PC3 |
|---|---|---|---|
| REC | 921 | 389 | 022 |
| DET | 956 | −,162 | −,246 |
| ENT | 950 | −,213 | 226 |
| PVE (%) | 88,829 | 7,430 | 3,742 |
| 158 | PC1 | PC2 | PC3 |
| REC | 926 | 378 | 017 |
| DET | 950 | −,202 | 237 |
| ENT | 953 | −,165 | −,252 |
| PVE (%) | 88,966 | 7,034 | 4,000 |
| 118 | PC1 | PC2 | PC3 |
| REC | 927 | 373 | 039 |
| DET | 948 | −,225 | 227 |
| ENT | 955 | −,139 | −,263 |
| PVE (%) | 88,970 | 6,963 | 4,067 |
| 104 | PC1 | PC2 | PC3 |
| REC | 921 | 386 | 048 |
| DET | 962 | −,125 | −,241 |
| ENT | 948 | −,248 | 198 |
| PVE (%) | 89,149 | 7,530 | 3,321 |
| 40 | PC1 | PC2 | PC3 |
| REC | 917 | 398 | 012 |
| DET | 958 | −,175 | −,226 |
| ENT | 955 | −,206 | 215 |
| PVE (%) | 89,047 | 7,715 | 3,238 |
Considerations similar to those reported for table 2 can be derived. The factor loading values of the PCA components are invariant with respect to the number of subjects (for an n>40) in the Training set. The data of table 3 suggest that each set containing at least 40 normal subjects can be used as Training set.
For the following analysis, a Training set made by 158 TEOAE responses was used.
3.2. ROC curve
The PCA analysis of the RQA measurements derived from the Training data set, provides an estimation of the PCA factor loading values. As explained in 2.2.1, once the factor loading are calculated, each TEOAE in the Test set can be drawn as a point in the PC1*vsPC2* plane by using the factor loadings obtained from the Training set plane. The RAD2D value is estimated from the Euclidean distance of that representative point, from the origin of the PC1*vsPC2* plane. The one class discrimination was performed on RAD2D.
From the Test set RAD2D values, the sensitivity and the specificity values were calculated. The sensitivity is defined as the proportion of patients with a hearing deficit who test positive (ratio TP/(TP + FN)) and the specificity as the proportion of patients without a hearing deficit who test negative (ratio TN/(TN + FN)), with true positive (TP), false negative (FN) and true negative (TN) assessed for the 182 TEOAE responses belonging to the Test set considering the case classification based on the audiometric data.
In figure 2, sensitivity and specificity estimates are shown for different RAD2D values, ranging from 1 to 3.
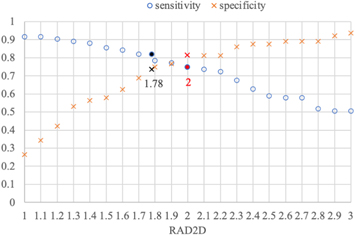
Figure 2. Sensitivity (orange crosses) and specificity (blue circles) versus RAD2D. When RAD2D is equal to 1.9, the same value for the two parameters is obtained. In black and red the values corresponding to RAD2D = 1.78 (a data value estimated in our previous papers) and RAD2D = 2, respectively. The latter RAD2D value selects the 96% of Normal TEOAE responses (see figure 1).
Download figure:
Standard image High-resolution imageThe data suggest that a range of values around RAD2D = 1.9 can optimize the values of sensitivity and specificity. Figure 2 highlights two different RAD2D values: (i) the 1.78 value, which was reported in previous papers on RAD2D-based discrimination and the value of 2, which selects the 96% of Normal responses (see comments in figure 1).
To discriminate between TEOAE responses from normal and hearing impaired ears, the choice of the RAD2D cut-off value is crucial and different oprimizing criteria can be used.
In order to define the RAD2D threshold automatically, a plot of sensitivity versus specificity was considered, as reported in figure 3 (ROC curve). In the figure, the point closest to (0,1) represents the maximum of sensitivity and specificity. Accordingly, the RAD2D threshold can be chosen corresponding to this point: the point closest to the upper left of the ROC plot is RAD2D = 2.0, which is shown with the red diamond character. This value is the radius of 'normality' (or reference circle) shown in of figure 1.
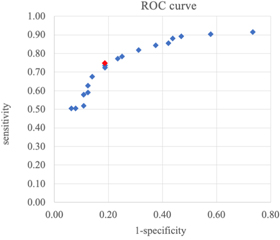
Figure 3. ROC curve: the y-axis shows the sensitivity values while the x-axis depicts the values of 1- specificity. The plot reports 32 different RAD2D's values (blu diamonds), the red one is the closest to the top left corner (in %) and corresponds to the value RAD2D = 2.0.
Download figure:
Standard image High-resolution image4. How to improve the classification by a WWR versus RAD2D plot
As introduced in the previous papers (Zimatore et al 2020a, 2020b) the combined use of the traditional TEOAE waveform reproducibility value (WWR >70%), and the RAD2D estimate demonstrated a better classification in terms of sensitivity and specificity for subjects presenting hearing deficits (NIHL and ARHL) with respect to the traditional use of WWR alone.
Once the threshold value for RAD2D is defined, it is possible to draw a line, corresponding to that value, in the WWR versus RAD2D plot, as in figure 4 (RAD2D value = red line). Even a visual inspection of the WWR versus RAD2D plot confirms these criteria: a vertical line at RAD2D equal to 2 can well select on the right those TEOAE responses, assessed by WWR as pass (negative), because they score >70% even if they belong to ears with hearing deficits. For example, if this TEOAE response belongs to a subject with ARHL or NIHL losses, then the result is a false negative (verified by the audiometry data).

Figure 4. WWR versus RAD2D for the TEOAE responses of the Test set. Four rectangular areas are defined: in every area it is possible to observe the points corresponding to different TEOAEs (green circles for Normal; blu circles for ARHL and red cicles for NIHL groups, respectively) (A) left top, TEOAE with high WWR and low RAD2D; (B) right top, TEOAEs with both high WWR and high RAD2D; (C) left bottom, TEOAE with both low WWR and RAD2D; (D) right bottom, TEOAE with low WWR and high RAD2D. Two vertical lines correspond to RAD2D = 1.78 (blu line) and 2 (red line). (From the Training set of 158 normal TEOAE responses).
Download figure:
Standard image High-resolution image
In figure 4, all the signals represented by blu and red points in (A) and (B) are defined as false negative because correspond to a wrong identification of WWR with respect to the audiogram. In particular, in the right top area (B) of figure 4, the 6 red points indicate 6 ears screened as 'Pass' by WWR (>70) but identified as 'fail' by the new RQA-based post-processing TEOAE analysis.
4.1. Screening hearing assessment
For a general screening hearing assessment the RAD2D threshold value can be choosen to be below 2, in order to further reduce the false negatives selected by WWR.
Table 4. The classification of Test set signals is shown by using WWR and concurrently RAD2D equal to 1.78 and to 2.00 (as explained in 3.1 a Training set of 158 TEOAE responses was used).
| Negative | Positive | ||||||
|---|---|---|---|---|---|---|---|
| FN | TN | FP | TP | ||||
| WWR > 70 | 35 | 57 | WWR < 70 | 7 | 83 | ||
| RAD2D < 1.78 and WWR > 70 | 24 | 63 | RAD2D > 1.78 and WWR < 70 | 1 | 94 | ||
| RAD2D < 2 and WWR > 70 | 19 | 60 | RAD2D > 2 and WWR > 70 | 4 | 99 | ||
| Specificity | Predictability | Sensitivity | Accuracy | FP Rate | Error Rate | F | |
| WWR > 70 | 89% | 92% | 70% | 77% | 11% | 23% | 0.80 |
| WWR&RAD2D(1.78) | 98% | 99% | 80% | 86% | 2% | 14% | 0.88 |
| WWR&RAD2D(2) | 94% | 96% | 84% | 87% | 6% | 13% | 0.90 |
In table 4 the improvement of one class discrimination with both WWR and RAD2D is shown with respect to specificity, sensitivity (or recall), as well as predictibility (or precision) (ratio TP/(TP + FP)) and accuracy (ratio (TP + TN)/(TP + TN + FP + FN)).
By using the combination of the two parameters, the specificity, sensitivity, predictability, and accuracy values are increased. From table 4 and figure 4 the differences observed between WWR and RAD2D + WWR are relevant; while the differences between RAD2D threshold values around 1.9 (figure 2) are subtle. Even though RAD2D = 2 is chosen by ROC curve criteria, since for a hearing screening is preferible to have less False Negatives with more False Positives (because these cases can successively be re-test), a RAD2D value of 1.78 can be used.
Moreover, in table 4, the FP Rate = FP/FP + TN, the ErrorRate = (FP + FN)/(TN + TP + FP + FN), and the Fscore = 2*Recall*Precision/(Recall+Precision) are reported.
These last metrics enforce the results obtained: by choosing RAD2D < 1.78 and WWR > 70 we obtained a better classification than with the other conditions investigated (the FP Rate is minor and the Error rate and F score are quite similar to RAD2D < 2), but much better than an criterion based only on the WWR threshold.
5. Discussion
From a purely theoretical point of view, it is worth noting that the ability of RQA to predict pathological states is in line with the fact that RQA is based upon the change in the correlation structure of the observed phenomenon, and this change precedes the actual event (Gorban et al 2010 and 2021). As in other physiological time series, i.e. in heart-rate time series, a high variability and consequently a low value of determinism characterize healthy subjects; on the contrary diseases and fatigue (Zimatore et al 2020a, 2020b, 2021) cause a lower variability and higher determinism.
RQA is a simple analysis, since RQA descriptors are nothing else than statistical indexes describing the distribution of pairwise Euclidean distances between the rows of embedding matrix. The difficulties in RQA-based methods are relative to both the interpretation of results and the choice of input parameters, corresponding to correlation level judged as relevant for the case at hand. These tasks request the usual artisan-like experience needed in science work, not dissimilar by the relevance judgement of an effect size so to decide the number of subjects needed for any experimentation (Kraemer et al 2003).
In this work, first we test the reliability of the Training set by changing the sample size. The results showed that the PCA factor loadings are invariant with respect the number of subjects (no size effect) and for different Training sets. Furthermore, by increasing the number of responses up to 158, no significant differences were observed in the estimates of sensitivity, sensibility and number of False Negatives (FN) (data not shown).
The definition of a threshold parameter, in order to optimize the discrimination between ears from normal and hearing deficit cases, was investigated. The ROC curve suggests a threshold value of RAD2D = 2 to detect hearing losses confirming that 96% of normal ears (p < 0.05) fall into a circle with radius 2 (i.e. 2 standard deviations). The discover by RAD2D of false negative TEOAE responses (real values are assessed on the basis of the audiometric test) should be considered in terms of an early detection: when WWR can not reveal ears with hearing issues, the subtle structure evidentiate by RQA analysis can identify underlying hearing deficits.
The WWR versus RAD2D plot shows that the number of False Negatives discovered (points of rectangle B) is increased in respect to the other values of RAD2D.
The criteria of ROC curve suggests the cut-off value automatically, however it should be noted that the value of RAD2D can be changed on the basis of the aim of each specific study: as example, in early evaluations or longitudinal studies, the threshold can be moved to reduce the FN or to improve the identification of false positive subjects (FP), respectively.
5.1. Limitation
A limitation of this study is the moderate number of TEOAE responses which does not permit an extensive flexibility with the fine-tuning of parameters for an automatic selection algorithm. It should be noted that a collection of large TEOAE sets is not a mundane task. Although TEOAEs can be easlily recorded in clinical practise, there is an inherent variability to the TEOAE signals caused by multiple factors (age, gender, health status etc), which make the collection of large coherent samples, a rather challenging task; these factors can be controlled if a rigourous and specific protocol design of the research is established. In this context, a larger dataset could provide more flexibility in terms of the selection algorithm, but it will probably require a multi-centric approach.
6. Conclusions
RQA-based approach can help identifying adult subjects with hearing impairment with a consequently increase of predictability. In fact, the combined use of traditional TEOAE waveforms' reproducibility parameter and RAD2D improved classification in terms of sensitivity, specificity, predictability, and accuracy for different types of hearing losses.
Data availability statement
The data that support the findings of this study are available upon reasonable request from the authors.
Abbreviations
ARHL: age-related hearing loss; HL, hearing level; IH, impaired-hearing; NH, normal hearing; NIHL: noise-induced hearing loss; OAE; otoacoustic emission; PCA, principal component analysis; PTT, pure-tone threshold; RAD2D, two-dimensional radius in PC1/PC2 plane; RP, Recurrence plots; RQA, recurrences quantification analysis WWR, whole waveform reproducibility (repro); TEOAE, transiently evoked otoacoustic emission; TP, true positive, FN, false negative; TN, true negative; FP, false positive;
This study was approved by the University of Ferrara, Ethics in Research Committee, under protocol number 160387.