

Abstract
In interior cardiac computed tomography (CT) imaging, the x-ray beam is collimated to a limited field-of-view covering the heart volume, which decreases the radiation exposure to surrounding tissues. Spectral CT enables the creation of virtual monochromatic images (VMIs) through a computational material decomposition process. This study investigates the utility of VMIs for beam hardening (BH) reduction in interior cardiac CT, and further, the suitability of VMIs for coronary artery calcium (CAC) scoring and volume assessment is studied using spectral photon counting detector CT (PCD-CT). Ex vivo coronary artery samples (N = 18) were inserted in an epoxy rod phantom. The rod was scanned in the conventional CT geometry, and subsequently, the rod was positioned in a torso phantom and re-measured in the interior PCD-CT geometry. The total energy (TE) 10–100 keV reconstructions from PCD-CT were used as a reference. The low energy 10–60 keV and high energy 60–100 keV data were used to perform projection domain material decomposition to polymethyl methacrylate and calcium hydroxylapatite basis. The truncated basis-material sinograms were extended using the adaptive detruncation method. VMIs from 30–180 keV range were computed from the detruncated virtual monochromatic sinograms using filtered back projection. Detrending was applied as a post-processing method prior to CAC scoring. The results showed that BH artefacts from the exterior structures can be suppressed with high (≥100 keV) VMIs. With appropriate selection of the monoenergy (46 keV), the underestimation trend of CAC scores and volumes shown in Bland-Altman (BA) plots for TE interior PCD-CT was mitigated, as the BA slope values were −0.02 for the 46 keV VMI compared to −0.21 the conventional TE image. To conclude, spectral PCD-CT imaging using VMIs could be applied to reduce BH artefacts interior CT geometry, and further, optimal selection of VMI may improve the accuracy of CAC scoring assessment in interior PCD-CT.
Export citation and abstract BibTeX RIS

Original content from this work may be used under the terms of the Creative Commons Attribution 4.0 licence. Any further distribution of this work must maintain attribution to the author(s) and the title of the work, journal citation and DOI.
1. Introduction
In interior computed tomography (CT), the field-of-view (FOV) is focused on the studied organ, e.g., in cardiac imaging applications, the x-ray beam is collimated to the heart (Wang and Yu 2013). This results in a reduced radiation dose to the surrounding tissues (Wang et al 2019, Juntunen et al 2020b). Also, cost savings to the imaging hardware can be attained, as the detector size can be reduced. The disadvantage of this imaging geometry is that truncated projection data cause artefacts in the reconstructions, such as halo effects and cupping artefacts (Ohnesorge et al 2000, Kyrieleis et al 2011). These artefacts are often mitigated using sinogram extension methods, such as padding and adaptive detruncation methods, or iterative reconstruction (Sourbelle et al 2005, Yu and Wang 2009, Kyrieleis et al 2011, Kudo et al 2013).
Coronary artery calcium (CAC) quantification is often applied for the assessment of coronary artery disease (CAD) (Raggi et al 2000, Detrano et al 2008). CAD grade is determined from an unenhanced CT scan, from which the CAC is quantified using the Agatston scoring method (Agatston et al 1990). Agatston scoring has been proposed as a CAD screening tool. However, for screening, the radiation dose of the protocol has to be optimized (Greenland 2004). Consequently, interior CT could be applied for this screening application as it effectively reduces the radiation dose to the surrounding tissues.
Spectral CT imaging in CAD assessment has been applied for contrast-enhanced imaging to quantify and differentiate iodine and calcifications in CT angiography (CTA) (Boussel et al 2014). For example, virtual non-contrast imaging shows the calcified regions in iodine contrast-enhanced CT or CTA images, enabling calcium scoring (Song et al 2016). In CTA, 50 keV virtual monochromatic images (VMIs) have been shown to provide equivalent or improved visualization of coronary arteries with halved iodine contrast agent dose (Yunaga et al 2020).
In cardiac imaging, VMIs have also been applied to reduce image artefacts arising from coronary stents and also for better visualization of the stent regions (Hickethier et al 2017). Recently, Qin et al (2019) demonstrated that subtraction of stents from virtual non-contrast (VNC) images enhanced the in-stent lumen visibility in dual-layer spectral CT. In addition, high-resolution photon counting detector (PCD) CT improved the coronary stent lumen visibility compared to dual-energy CT (DECT), and VMIs enabled estimation of iodine and gadolinium concentration estimation from the stent region (Symons et al 2018). In PCD-CT, the beam hardening artefacts are more prominent in the low energy images (Inkinen et al 2020), and in cardiac imaging, the surrounding bony structures i.e. ribs and spine cause beam hardening in low energy PCD-CT images if not corrected. One approach to reduce beam-hardening artefacts is to use VMIs (Kuchenbecker et al 2015, Inkinen et al 2020).
A few studies focus on performing CAC scoring with PCD-CT using human or anthropomorphic phantoms (Symons et al 2019, Juntunen et al 2020b). Symons et al (2019) showed the CAC scoring performance is similar as with the conventional CT, and further, the image quality can be improved with the PCD-technology. In our prior work, we showed using a table-top PCD-CT setup that interior PCD-CT can be used for CAC scoring when sinogram extension is applied (Juntunen et al 2020b).
This study is a continuation of our prior work aiming to investigate the spectral imaging properties of PCD-CT in interior geometry, which has not been addressed previously. Specifically, we investigate if VMIs can reduce beam hardening artefacts in interior tomography from the surrounding bony tissues. To our knowledge, no prior research has addressed the influence of VMI on the reduction of beam hardening (BH) artefacts originating from tissues outside the FOV. However, prior studies have shown that the VMI can be applied in the reduction of the beam hardening effects in DECT (Angelo et al 2019). In addition, we perform CAC scoring to VMI, while seeking the optimal virtual monoenergy which produces results most comparable to the ground truth results obtained from PCD-CT in a non-interior tomography setting.
2. Materials and methods
The sample collection and data processing framework have been presented in more detail our previous studies (Juntunen et al 2020a, 2020b) (figure 1).

Figure 1. Image processing workflow. First, the raw projection data is calibrated using signal-to-equivalent thickness (STC) correction (a). Second, material decomposition is performed in projection domain to polymethyl methacrylate (PMMA) and calcium hydroxylapatite (CaHA) basis (b), prior sinogram detruncation the data is reshaped to match clinical CAC scoring protocol (3 mm slice thickness) (data not shown in workflow) and subsequently detruncated (c). Then virtual monoenergy projections are constructed using equation (5) (d), and finally reconstructed with FBP with detrending as an optional post-processing method for CAC scoring (e).
Download figure:
Standard image High-resolution image2.1. Sample collection
In total 18 coronary artery samples were collected from nine cadavers by a pathologist. The sample extraction was carried out during a routine medical autopsy, and the protocol was approved by the Ethics Committee of Northern Ostrobothnia Hospital District (Permission: 40/2018). These samples, with approximately 2 cm length, were wrapped to dampened tissue towels and placed in a 9 cm custom-made epoxy resin cylinder phantom with a sample tube at its center. This cylinder phantom, containing the artery sample, was measured using a table-top PCD-CT setup (Juntunen et al 2020b). The rod phantom was subsequently positioned in an anthropomorphic torso phantom (008 C, CIRS, Inc., Norfolk, VA, USA), and the phantom was measured in an interior PCD-CT geometry.
2.2. PCD-CT imaging
The PCD-CT setup consisted of an x-ray tube from a C-arm (Philips BV29, Philips Healthcare, Netherlands), a motorized rotation stage (NR360S/M, Thorlabs, Inc., Newton, New Jersey), and a flat-panel PCD (Flite FX15, XCounter AB, Danderyd, Sweden). The source could not be operated with the peak kilovoltage of 120 kVp, routinely used for CAC scoring, so a peak kilovoltage of 100 kVp and a tube current of 3.0 mA were utilized.
The x-ray source-to-detector and source-to-isocenter distances were set to 88.9 cm and 58.8 cm, respectively. The rotation stage was operated at 1.5 °/s angular velocity, while the PCD recorded 15 frames/s. Six frames were averaged per degree producing projections with 1° increments at 432 mAs exposure. The energy thresholds of the PCD were set at 10 keV and 60 keV. The detector divided the data into low-energy (LE, 10–60 keV) and high-energy (HE, 60–100 keV) bins.
2.3. Projection data pre-processing
For calibrating the PCD, the signal-to-equivalent thickness calibration (STC) was used (Jakubek et al 2005, Vavrik et al 2006). The STC technique maps the measured photon count into an equivalent thickness of a material that is used in the calibration process. Polymethyl methacrylate (PMMA) plates were used in calibration. Plates with thicknesses 5.3 cm, 10.6 cm, 15.9 cm, 21.2 cm, 26.5 cm, and 31.8 cm were measured during calibration. The phantom measurements were corrected into an equivalent thickness, using the correction method discussed in several previous studies (Jakubek et al 2005, Vavrik et al 2006, Jakubek 2007, Juntunen et al 2020a) (figure 1(a)).
Subsequently, the pre-processed and STC-corrected projection data was mapped into a corrected number of counts (λ) in energy bin i using
where Φ, Ri , D, and E indicate the source spectrum, energy response of the detector for energy bin i, the detection efficiency of the CdTe layer, and the photon energy, respectively. Am is the projected mass density (PMD) of the mth basis material:

where l indicates the path and ρm
is the density of the basis material (m) in the reconstruction voxel (u). The mass-attenuation coefficients ( ) were retrieved from the NIST database (Hubbell et al
1996).
) were retrieved from the NIST database (Hubbell et al
1996).
2.4. Material decomposition
A projection-based material decomposition (MD) approach could theoretically reduce BH (Bornefalk et al 2015), so it was utilized in this study.
In the MD algorithm, the composition of basis materials PMMA and calcium hydroxylapatite (CaHA) that would yield the same number of counts as the measurement were determined. Mathematically, a cost functional was minimized by solving

where λmeasurement and λ(A) indicate the measured and simulated counts. A is a vector containing the decomposed projected mass densities of PMMA and CaHA (A = (APMMA , ACaHA )). This minimization problem was solved using a Gauss-Newton method with 30 iterations (Ducros et al 2017, Juntunen et al 2020a) (figure 1(b)).
2.5. Adaptive detruncation
The adaptive detruncation method was utilized to extend the material decomposed PMMA and CaHA basis sinograms (Sourbelle et al 2005, Kolditz et al 2011). In the used implementation of the method, the patient shape is estimated as an ellipse, with minor and major axes corresponding to the estimated size of the patient in PA and lateral directions, respectively. The size of the phantom was estimated using the method presented in (Juntunen et al 2020b). The truncated data are extended to this shape estimate by fitting a square-root function to either side of the truncated sinogram

where ξ is the detector pixel, and a, b, and c are fit parameters. The fit parameters are obtained by enforcing consistency of sinogram and sinogram gradient values between the true and extended sinogram, and by forcing the sinogram to zero using the patient shape estimate.
2.6. Virtual monochromatic projections
The detruncated CaHA and soft tissue (PMMA) basis projections (ACaHA , APMMA ), were used to obtain virtual monochromatic projections (p) as:

VM projections were calculated for the energies (E) {30, 40, 46, 50, 60, 80, 100, 120, 140, 160, 180} keV. The estimated effective energy through the cardiac rod and torso were 46 keV and 52 keV, respectively (figure 2). These were determined from the Beer–Lambert law with Φ(E) as the source spectrum by solving the linear attenuation coefficient of PMMA and its corresponding energy E.

Figure 2. Simulated transmitted spectrums without attenuating medium (black), through cardiac rod (red) and through torso (blue). The simulations were conducted using Beer-Lambert law with PMMA as attenuating material.
Download figure:
Standard image High-resolution image2.7. CT reconstruction
Detruncated total energy (TE) projections (cardiac rod and torso), and VM projections (torso) were reconstructed using filtered back projection (FBP). The ASTRA (v 1.8, iMinds-Vision Lab, University of Antwerp, Belgium) (van Aarle et al 2015, 2016) and Spot (v.1.2) (van den Berg and Friedlander n.d.) toolboxes in MATLAB (v. 9.4, The MathWorks Inc., Natick, MA, 2018) were applied for reconstructions. FBP was chosen as it is used in the clinical Agatston scoring protocol. The same filter kernel was applied as in our previous study by Juntunen et al 2020b (Hann filter and moving average filter with 4.2-pixel window). Finally, detrending was applied as a post-processing method to uniform the FOV regions similarly to our previous study. Houndsfield unit (HU) conversion for reconstructions was performed using the attenuation value of the surrounding epoxy resin instead of water attenuation.
2.8. Image quality assessment and coronary artery calcium scoring
The image quality of the reconstructed virtual monoenergy images (VMIs) was evaluated by assessing the standard deviation (SD) from a circular region (diameter = 50 pix) susceptible for beam hardening artefact (figure 3, blue annotation), and by assessing the uniformity as standard deviation from the uniform circular region (diameter = 50 pix) from each sample (figure 3, red annotation). In addition, the horizontal and vertical HU profiles were evaluated from a single sample (figure 3).
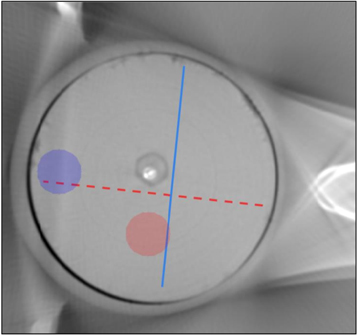
Figure 3. Profile annotation for the cupping evaluation. Red annotation is the vertical profile and blue annotation is the horizontal annotation.
Download figure:
Standard image High-resolution imageThe coronary calcium scoring was performed using the Agatston scoring method in which the calcium volume is weighted with a density factor that is dependent on the maximum HU value of the slice {<147 HU: 0, 147–199 HU: 1, 200–299 HU: 2, 300–399 HU: 3, ≥400 HU: 4}(Thomas et al 2006, Nakazato et al 2009). The calcium volume was segmented using a thresholding method with 147 HU as the threshold value instead of the typical 130 HU to account for the lower peak kilovoltage (100 kVp) of the scan (Nakazato et al 2009). The sum of the slicewise scores was evaluated for each sample. The scores and volumes between reference TE PCD-CT and interior PCD-CT with TE, and VMIs were compared using Bland-Altman (BA) plots, Pearson correlation and regression-slope values.
3. Results
3.1. Assessment of image uniformity and beam hardening
The beam hardening artefact arising from the ribs outside the field of view was present in the TE images in the interior region (figure 4). This artefact was diminished at high VMIs (≥100 keV) (figure 4, table 1). However, VMIs show ring artefacts that arise from the MD. This phenomenon deteriorated the image uniformity with VMIs, and consequently, TE had the best uniformity (table 1). When comparing VMIs, the best image uniformity was achieved with 60 keV and 80 keV (table 1).

Figure 4. Illustration of the BH artefact (yellow box) arising from the ribs. With increasing monoenergys the artefact is diminished from the interior CT images reconstructed with FBP from detruncated sinograms. Image windowing is set to [−500 1000].
Download figure:
Standard image High-resolution imageTable 1. Image quality assessment for beam hardening (BH) (figure 3 blue annotation) and uniformity (figure 3 red annotation) for total energy (TE: 10–100 keV) image and at different VMIs (mean ± SD).
| Energy (keV) | BH (HU) | Uniformity (HU) | BH a (HU) | Uniformity a (HU) |
|---|---|---|---|---|
| TE | 36 ± 8 | 15 ± 2 | 22 ± 5 | 12 ± 4 |
| 30 | 103 ± 26 | 65 ± 10 | 93 ± 219 | 64 ± 8 |
| 40 | 62 ± 14 | 36 ± 6 | 51 ± 9 | 34 ± 4 |
| 46 | 45 ± 9 | 25 ± 4 | 34 ± 5 | 22 ± 3 |
| 50 | 41 ± 8 | 22 ± 3 | 29 ± 4 | 20 ± 2 |
| 60 | 31 ± 6 | 17 ± 2 | 21 ± 4 | 15 ± 2 |
| 80 | 25 ± 6 | 17 ± 3 | 18 ± 4 | 15 ± 3 |
| 100 | 24 ± 6 | 17 ± 3 | 19 ± 4 | 17 ± 3 |
| 120 | 24 ± 6 | 18 ± 3 | 20 ± 5 | 18 ± 3 |
| 140 | 24 ± 6 | 18 ± 3 | 20 ± 5 | 18 ± 3 |
| 160 | 24 ± 6 | 18 ± 3 | 21 ± 5 | 18 ± 3 |
| 180 | 24 ± 6 | 19 ± 3 | 21 ± 5 | 18 ± 2 |
a Denotes detrended. † Smaller SD value means more uniform region.
The cupping artefact was not mitigated when the virtual monoenergy was increased (figure 5(a)). Detrending reduced cupping for all monoenergies and TE reconstructions (figure 5(b)).
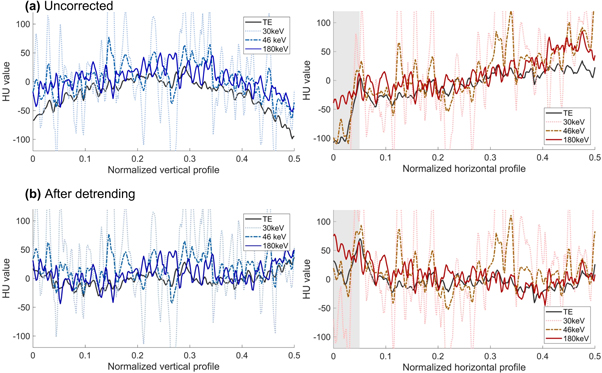
Figure 5. Left: Horizontal profiles of different virtual monenergies over the homogeneous region. Right: Vertical profiles of different virtual monoenergies over the homogeneous region. The spikes showing in the 30 keV and 46 keV images are caused by ringing artefacts. The grey region highlights the beam hardening area of the image.
Download figure:
Standard image High-resolution image3.2. Calcium scoring
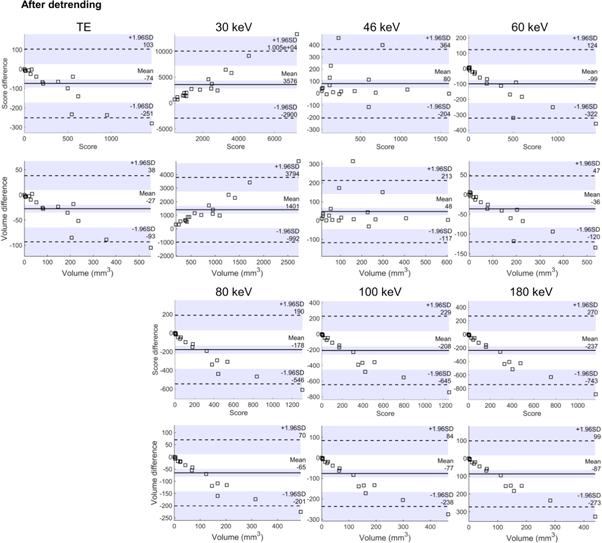
Strong correlations of both calcium score and volume between reference measurement (TE measurement of the rod) and TE measurement of the torso were found (table 2). The 46 keV VMI had the best overall correspondence with the reference method (BA slope values and correlation). The BA plots (figure 6) and slope analysis in table 2 showed that with the TE images, both the volumes and scores had a decreasing linear trend with volumes and correlations. This showed that calcifications with high volumes were underestimated in detruncated reconstructions. With the 46 keV virtual monoenergy, this trend was eliminated (figure 6).
Table 2. Correlation coefficients and Bland-Altman (BA) plot slopes for total energy and virtual monoenergies (detrended data). The 46 keV (bolded) gave the closest result to the non-interior PCD-CT TE when all parameters were taken into account.
| Energy | Score correlations | Volume correlations | BA slope score | BA slope volume |
|---|---|---|---|---|
| TE | 0.99 a | 0.99 a | −0.21 | −0.21 |
| 30 keV | 0.18 | 0.18 | 1.84 | 1.84 |
| 40 keV | 0.42 | 0.35 | 1.11 | 1.22 |
| 46 keV | 0.94 a | 0.86 a | −0.02 | −0.02 |
| 50 keV | 0.98 a | 0.95 a | −0.09 | −0.11 |
| 60 keV | 0.99 a | 0.99 a | −0.27 | −0.27 |
| 80 keV | 0.98 a | 0.98 a | −0.51 | −0.50 |
| 100 keV | 0.97 a | 0.98 a | −0.65 | −0.64 |
| 120 keV | 0.97 a | 0.98 a | −0.75 | −0.73 |
| 140 keV | 0.97 a | 0.98 a | −0.79 | −0.77 |
| 160 keV | 0.97 a | 0.98 a | −0.80 | −0.78 |
| 180 keV | 0.97 a | 0.98 a | −0.80 | −0.79 |
a values are statistically significant p < 0.0001. † Slope values are determined from the BA-plots (figure 6).
Figure 6. Bland-Altman plots for the Agatston score and volumes for total energy images (TE) and virtual monoenergies. Detrended data is visualized.
Download figure:
Standard image High-resolution image
4. Discussion
This study investigated virtual monochromatic imaging of the heart in interior PCD-CT using cardiac phantom and ex vivo coronary artery samples. VMI was observed as an effective BH reduction strategy in interior tomography as the BH artefacts arising from bony regions outside the region of interest were effectively reduced by increasing the virtual monoenergy. In addition, when VMIs were applied to coronary artery scoring and compared to the reference non-interior TE PCD-CT measurements, the monoenergy 46 keV was found to be the closest estimate to the reference based on the BA-plot slope values.
Similarly, as in our prior study (Juntunen et al 2020b), the reconstructed images had cupping artefacts and the VMIs did not reduce these artefacts. These artefacts are likely due to the interior geometry as the adaptive detruncation algorithm cannot fully compensate for the lack of missing projection data. In addition, Compton scattering may also cause cupping in this study. Since the MD algorithm does not account for scattering, it cannot compensate for cupping caused by this phenomenon. In contrast, the calibration method affects the scatter-to-primary ratio of the scan (Juntunen et al 2020a), and consequently, could be considered as an artefact reduction strategy for scattering-induced cupping.
Interestingly, however, the BH artefacts, originating from the bony regions outside the volume of interest, were also suppressed in the interior geometry. The suitability of VMIs in BH reduction has not been applied for interior geometry in previous research even though several studies exist for conventional full field of view geometry (Yu et al 2012).
The PCD-CT system was capable of acquiring the spectral information within single scan enabling the inclusion of VMIs in the imaging workflow. Although the virtual monoenergy 46 keV was the closest estimate to BA-plot slope values, the image uniformity was severely deteriorated due to the varying tilewise responses of the detector. The manifested ringing artefacts may render the diagnostic utility of this VMI energy insignificant. However, at higher monoenergies, the ringing artefacts were substantially reduced. An alternative diagnostic pipeline to obtain more quantitatively accurate CAC score estimates is to optimize the virtual energy in which the CAC scoring is performed, and the optimal diagnostic image could be TE image or higher VMI with less artefacts.
In addition, spectral CT and VMIs may have substantial potential for contrast-enhanced cardiac imaging since they would allow the CAC scores to be directly determined from the CTA acquisition, removing the need for a separate non-contrast scan. In previous research, virtual non-contrast imaging and VMI with 70 keV have strongly correlated with the CAC scores of the conventional non-contrast scan (Yamada et al 2014, Song et al 2016). In contrast, in this study, the VMI of 46 keV produced the strongest correlation between the TE measurement of the rod and the VMI of the torso. Since the reference phantom (rod) is smaller than a torso, and the kVp is reduced to 100 kVp, the VMI yielding the strongest correlation was reduced compared to the previous studies (Yamada et al 2014, Song et al 2016). Interestingly, 46 keV was determined as the effective energy, producing the same signal as the polychromatic x-ray spectrum for the rod phantom. This may be the underlying reason why VMI of 46 keV produced the strongest correlation.
The main limitations of the present study include lower kVp setting compared to the clinical routine (100 kVp versus 120 kVp), the difference between the phantoms used for the reference PCD-CT, and interior PCD-CT phantoms, HU estimation from soft tissue equivalent material, and fixed phantom size. Unfortunately, the x-ray tube used in this study could not produce a tube voltage of 120 kVp. However, we compensated for this by adjusting the HU threshold range to 147 HU as suggested by (Nakazato et al 2009). As our PCD size was limited, the reference scan was performed without the torso phantom, and the sample was imaged in a smaller custom epoxy resin cylinder (dia. 9 cm). This resulted in a difference in the transmitted spectrums, which influences the HU values of the calcifications. More specifically, the x-ray beam is hardened more with the torso phantom, resulting in smaller HU values for the calcifications. Another limitation is the HU calibration, as we approximated the water value to be similar to soft tissue equivalent epoxy resin. Therefore, it is important to compare torso phantom measurements in interior and non-interior PCD-CT setups in future studies. The utilization of a clinical prototype PCD-CT scanner could be exploited for this assessment (Boccalini et al 2021).
We used a fixed 147 HU threshold for all virtual monoenergies. However, the threshold could be adaptively adjusted for each virtual monoenergy using controlled phantom measurements with known calcium attenuation properties. This would improve the calcium scoring accuracy for VMIs. Also, a comparison with known calcium shape, size, and attenuation properties could be used to assess the HU variability with different VMI energies.
The low energy VMIs had prominent ring artefacts which dimished when the VM energy was increased. We chose not to utilize ring artefact correction for this study to highlight the effects of different VMIs with respect to image quality. For clinical usage, ring artefact correction should be applied (see for example (Lifton and Liu 2019)).
The ex vivo coronary artery samples were placed inside an anthropomorphic phantom, so no variability in body size was included in our assessment. However, the CAC score for non-spectral CT depends on the phantom size. Comparable outcomes have been demonstrated for clinical CT, where a patient size-specific calibration factor has been discussed for conventional CAC scoring (Oudkerk et al 2008). Instead of using a size-specific calibration parameter, we see the potential for using VMI for CAC scoring to reduce the impact of patient size and will investigate this as future work. Promising results on a comparable subject have been demonstrated using dual-source CT, with which VMIs provided more consistent HU values for varying patient sizes compared to conventional CT (Yu et al 2011, Michalak et al 2016). Furthermore, the effect of cardiac motion should be assessed as well. Although cardiac CT was studied, future applicability of VMIs to, e.g., in dentomaxillofacial and extremity CBCT, where the kVp range is often limited and the small FOVs result in interior tomography geometry warrants for investigation.
5. Conclusion
The beam hardening artefacts in interior tomography, which originate from the beam hardening of tissues outside the FOV, can be reduced by increasing the virtual monoenergy (≥ 100 keV). With the appropriate selection of the monoenergy (46 keV) the underestimation of CAC scores and volumes was diminished. Therefore, spectral CT imaging with VMIs may be exploited in CAC scoring assessment in interior CT.
Acknowledgments
The authors acknowledge financial support from Business Finland (project no. 1392/31/2016), Academy of Finland (project no. 316899).
Data availability statement
The data generated and/or analysed during the current study are not publicly available for legal/ethical reasons but are available from the corresponding author on reasonable request.