

Abstract
Purpose. Radiation epidemiology studies of childhood cancer survivors treated in the pre-computed tomography (CT) era reconstruct the patients' treatment fields on computational phantoms. For such studies, the phantoms are commonly scaled to age at the time of radiotherapy treatment because age is the generally available anthropometric parameter. Several reference size phantoms are used in such studies, but reference size phantoms are only available at discrete ages (e.g.: newborn, 1, 5, 10, 15, and Adult). When such phantoms are used for RT dose reconstructions, the nearest discrete-aged phantom is selected to represent a survivor of a specific age. In this work, we (1) conducted a feasibility study to scale reference size phantoms at discrete ages to various other ages, and (2) evaluated the dosimetric impact of using exact age-scaled phantoms as opposed to nearest age-matched phantoms at discrete ages. Methods. We have adopted the University of Florida/National Cancer Institute (UF/NCI) computational phantom library for our studies. For the feasibility study, eight male and female reference size UF/NCI phantoms (5, 10, 15, and 35 years) were downscaled to fourteen different ages which included next nearest available lower discrete ages (1, 5, 10 and 15 years) and the median ages at the time of RT for Wilms' tumor (3.9 years), craniospinal (8.0 years), and all survivors (9.1 years old) in the Childhood Cancer Survivor Study (CCSS) expansion cohort treated with RT. The downscaling was performed using our in-house age scaling functions (ASFs). To geometrically validate the scaling, Dice similarity coefficient (DSC), mean distance to agreement (MDA), and Euclidean distance (ED) were calculated between the scaled and ground-truth discrete-aged phantom (unscaled UF/NCI) for whole-body, brain, heart, liver, pancreas, and kidneys. Additionally, heights of the scaled phantoms were compared with ground-truth phantoms' height, and the Centers for Disease Control and Prevention (CDC) reported 50th percentile height. Scaled organ masses were compared with ground-truth organ masses. For the dosimetric assessment, one reference size phantom and seventeen body-size dependent 5-year-old phantoms (9 male and 8 female) of varying body mass indices (BMI) were downscaled to 3.9-year-old dimensions for two different radiation dose studies. For the first study, we simulated a 6 MV photon right-sided flank field RT plan on a reference size 5-year-old and 3.9-year-old (both of healthy BMI), keeping the field size the same in both cases. Percent of volume receiving dose ≥15 Gy (V15) and the mean dose were calculated for the pancreas, liver, and stomach. For the second study, the same treatment plan, but with patient anatomy-dependent field sizes, was simulated on seventeen body-size dependent 5- and 3.9-year-old phantoms with varying BMIs. V15, mean dose, and minimum dose received by 1% of the volume (D1), and by 95% of the volume (D95) were calculated for pancreas, liver, stomach, left kidney (contralateral), right kidney, right and left colons, gallbladder, thoracic vertebrae, and lumbar vertebrae. A non-parametric Wilcoxon rank-sum test was performed to determine if the dose to organs of exact age-scaled and nearest age-matched phantoms were significantly different (p < 0.05). Results. In the feasibility study, the best DSCs were obtained for the brain (median: 0.86) and whole-body (median: 0.91) while kidneys (median: 0.58) and pancreas (median: 0.32) showed poorer agreement. In the case of MDA and ED, whole-body, brain, and kidneys showed tighter distribution and lower median values as compared to other organs. For height comparison, the overall agreement was within 2.8% (3.9 cm) and 3.0% (3.2 cm) of ground-truth UF/NCI and CDC reported 50th percentile heights, respectively. For mass comparison, the maximum percent and absolute differences between the scaled and ground-truth organ masses were within 31.3% (29.8 g) and 211.8 g (16.4%), respectively (across all ages). In the first dosimetric study, absolute difference up to 6% and 1.3 Gy was found for V15 and mean dose, respectively. In the second dosimetric study, V15 and mean dose were significantly different (p < 0.05) for all studied organs except the fully in-beam organs. D1 and D95 were not significantly different for most organs (p > 0.05). Conclusion. We have successfully evaluated our ASFs by scaling UF/NCI computational phantoms from one age to another age, which demonstrates the feasibility of scaling any CT-based anatomy. We have found that dose to organs of exact age-scaled and nearest aged-matched phantoms are significantly different (p < 0.05) which indicates that using the exact age-scaled phantoms for retrospective dosimetric studies is a better approach.
Export citation and abstract BibTeX RIS

Original content from this work may be used under the terms of the Creative Commons Attribution 4.0 licence. Any further distribution of this work must maintain attribution to the author(s) and the title of the work, journal citation and DOI.
1. Introduction
In the decades after treatment, childhood cancer survivors are at high risk for developing treatment-related late effects due to high survival rates for pediatric cancers (>84%) and long-life expectancy (Travis et al 2011, Armstrong et al 2016, Gibson et al 2018). Radiation epidemiologic studies of childhood cancer survivors seek to establish dose-response relationships between specific late effects and the dose from radiotherapy (RT) to the organ in which the late effect occurred (Travis et al 2011). Most childhood cancer survivor cohorts include survivors treated in the pre-computed tomography (CT) era of RT and organ doses must, therefore, be estimated by reconstructing RT treatment fields on surrogate anatomy. The most used surrogate anatomy for retrospective RT reconstruction is computational phantoms.
In the last 50 years, computational phantoms have experienced dramatic advancements, beginning with the ICRU spherical models (ICRU 1992a) and simple first-generation stylized phantoms at discrete ages (ORNL 1966) to the advanced age-scalable computational phantoms (Howell et al
2019) and to the highly realistic patient-dependent hybrid computational phantom libraries (Zaidi and Tsui 2009, Lee et al
2010, Segars et al
2010, Xu 2014). Taking advantage of the modeling flexibility, the reference size hybrid phantoms were modified into body size-dependent phantoms such as the phantom library developed by the University of Florida and National Cancer Institute (UF/NCI) consisting of 158 pediatric phantoms of various heights and weights (Geyer et al
2014). When using such phantom library to retrospectively reconstruct RT treatment of a childhood cancer survivor with no CT images, a phantom of nearest height and/or weight of the survivor can be selected as a surrogate. This approach is only feasible when both the height and weight of a survivor are known (Kalapurakal et al
2018), which, however, is not always the case in historic RT records. Therefore, the age at the time of RT treatment is commonly used as a surrogate for height and weight where reference size phantoms are adopted. Since the reference size phantoms are usually available at discrete ages (e.g., newborn, 1, 5, 10, 15, and adult), the nearest available discrete age would be selected for RT reconstruction for a survivor. For example, the 5-year-old reference size phantom would be selected for a survivor that was 3.9-year-old at the time of RT treatment. The age discrepancy further increases the uncertainty in the dose reconstruction as the organ size of a 5.0-year-old is larger than that of a standard 3.9-year-old, which could result in both underestimation and overestimation of organ dose depending upon the field size, organ size, and its proximity to the fields. For the same field size across 3.9- and 5.0-year-old phantoms, the dose to partially in-beam organs of 5.0-year-old would be an underestimation because larger fraction of organ would be out of the field. For out-of-beam organs of 5.0-year-old, the estimation would still be an underestimation as organs will be farther from the treatment field. Furthermore, if the field size is determined by anatomical landmarks, the dose estimation in the case of 5.0-year-old could be an overestimation because the scatter contribution to organ dose would be increased. Dosimetric uncertainties can translate to uncertainties in risk estimation, which in some instances can be as much as 70% (V Bezin et al
2017).
Bezin et al
2017).
Since age is generally the only height and weight surrogate available in historic RT records, age-based scaling of computational phantoms is frequently used in RT epidemiology studies. The MD Anderson Late Effects Group developed and validated a computational phantom (used in over 120 radiation epidemiology studies) that can be scaled to any age from infant to adult (Stovall et al 2006, Howell et al 2019) based on age-scaling functions (ASF) that were developed from growth data of 4,127 U.S. infants, children, and youths through 18 years of age (Snyder et al 1977). This capability is compatible with what is typically available in historic RT records and also allows for the scaling of the computational phantom to the exact age of the survivor at the time of RT treatment. Recently, the MD Anderson phantom and the ASFs were implemented and validated in the Digital Imaging and Communication in Medicine (DICOM) standard (Gupta et al 2020). This adaptation makes it possible to use ASFs to scale other DICOM-formatted phantoms. The main purposes of this investigation were to (1) conduct a feasibility study to scale reference size discrete age phantoms from the UF/NCI phantom library to both discrete and continuous-valued ages that are common in RT epidemiologic studies of childhood cancer survivors and (2) to evaluate the dosimetric impact of using exact age-scaled phantoms as opposed to nearest-age matched phantoms. Hereafter, we have interchangeably used discrete aged phantoms to represent reference size UF/NCI phantoms.
2. Materials and methods
2.1. The University of Florida/National Cancer Institute (UF/NCI) computational phantom library
We adopted the UF/NCI computational phantoms to test our age-scaling methods. The phantom library consists of two groups: the reference size phantoms and the body size-dependent phantoms. The reference size phantom library was developed from the manual segmentations of high-resolution CT scans of cadavers and patients at different discrete ages from 6 days to 35 years (Lee et al 2010). The phantoms were originally scaled to match the 50th percentile heights, arm lengths, acromial breadth, and body regions circumference from several reference datasets as reported in Lee et al (2010) and Johnson et al (2009). The organ volumes were represented by a single volume which precluded its comparison with International Commission on Radiological Protection (ICRP) 89 data as autopsy data are primarily reported in terms of wall and internal contents of the organs. Therefore, the single organ volumes were later separated into organ wall, tissue, blood, and air for discrete aged phantoms. Furthermore, skeleton, muscles, lymph nodes, and blood vessels were added to make the phantom more anatomically realistic. With the incorporation of updated organs and additional structures at discrete ages, the ICRP adopted the UF/NCI pediatric male and female phantoms (age: 6 days, 1, 5, 10, and 15 years) in ICRP 143 report (ICRP 2020). Later, the heights of the phantoms were up-/down-scaled, and the circumference of the body regions was modified (by adding fat layer) to create a library of 158 pediatric and 193 adult phantoms of varying heights and weights i.e. body-mass index (BMI) (Geyer et al 2014). These phantoms were later converted to DICOM-RT format, with accompanying CT images and segmented organ structures, using the DICOM-RT Generator developed in Griffin et al (2019).
For our feasibility study, we used reference size male and female UF/NCI phantoms at ages 1, 5, 10, 15, and 35 years as this phantom set allows us to validate our age scaling methodologies at discrete ages and also allows us to scale the phantoms to continuous-valued ages that are common in RT epidemiological studies of pediatric survivors. We excluded the newborn phantoms because the neck is flexed in these phantoms, which results in an inherent error due to the difference in neck orientation; we are only interested in scaling errors from our ASFs.
For our dosimetric assessment, we obtained one reference size 5-year-old UF/NCI phantom and seventeen body-size dependent phantoms that were created from the reference 5-year-old phantoms. We selected the age of 5 years in our study because this is the closest age to the median age of Childhood Cancer Survivor Study (CCSS) cohort (Leisenring et al 2009, Robison et al 2009), which is adopted in this study to obtain continuous valued-ages that are common in RT epidemiologic studies (as described in detail in section 2.4). The age, number, height, and weight of the phantoms used in this study are shown in table 1.
Table 1. Parameters of UF/NCI phantoms selected in this study.
| Number of phantoms | Heights (cm) a | Weight (kg) | |||||
|---|---|---|---|---|---|---|---|
| Age (year) | M | F | M | F | M | F | Type |
| Phantoms used in the feasibility study | |||||||
| 1 | 1 | 1 | 76.4 | 76.4 | 10 | 10 | Reference |
| 5 | 1 | 1 | 110.3 | 110.3 | 19 | 19 | Reference |
| 10 | 1 | 1 | 139.9 | 139.9 | 32 | 32 | Reference |
| 15 | 1 | 1 | 166.0 | 161.9 | 56 | 53 | Reference |
| Adult (35) | 1 | 1 | 174.8 | 163.6 | 73 | 60 | Reference |
| Phantoms used in dosimetric assessment studies | |||||||
| 5 | 9 | 8 | 95.3–115.5 | 95.3–115.5 | 15–30 | 15–30 | Body-size dependent |
a Heights were measured from DICOM file. M = male and F = female.
2.2. Modification of MD Anderson Late Effects Group scaling methodologies for UF/NCI phantoms
2.2.1. Original MD Anderson Late Effects Group scaling methodologies
Our baseline 3D phantom (hereafter called the generic phantom) consists of body regions that define the head, neck, trunk, legs, and arms, and 25 organs (Stovall et al
2006, Howell et al
2019). Phantom scaling methods are described in detail in Gupta et al (2020) and will be summarized here. The generic phantom is scaled by body region and direction-specific ASFs, which account for non-uniform growth of the generic phantom to any arbitrary age in right-left (RL) or x, anterior-posterior (AP) or y, and inferior-superior (IS) or z directions. Furthermore, our ASFs are gender-neutral and use measurements for male body regions at the age of 15 and 18 to scale the phantoms. Since the ASFs are body region-specific, the organs located within each body region are scaled with the same ASFs as the body region. The ASFs have two components and hence, scaling is executed in two - steps. In the first step, the body region and direction-specific scaling factors are determined based on the target age. For the ages 
 {0.1, 1, 3, 5, 10, 15, 18 years}, we use discrete scaling functions,
  which was originally estimated from 50th percentile body measurements reported by Snyder et al (1977). Since the discrete ages are constrained up to 18 years, our ASFs account for growth up to 18 years and is constant afterwards i.e. ASFs of 18-year-old are used to perform scaling involving age >18.0. For any other ages, we perform linear interpolation in between closest discrete ages to estimate the continuous valued age scaling function,
  In the second step,
  or
or  are incorporated in the body region and direction-specific transformation equations which transform the 3D points with respect to the reference lines and boundaries of body regions. For example, in the RL directions, points were transformed about x = 0, and in the AP direction, points were transformed with respect to the anterior boundary of the body regions. This enables accurate scaling and localization of the 3D points of each body region and organ. Lastly, since the body regions and organs are in point format, the points for each structure are converted to surface contours using convex hull algorithms (Cormen et al
2009
).
are incorporated in the body region and direction-specific transformation equations which transform the 3D points with respect to the reference lines and boundaries of body regions. For example, in the RL directions, points were transformed about x = 0, and in the AP direction, points were transformed with respect to the anterior boundary of the body regions. This enables accurate scaling and localization of the 3D points of each body region and organ. Lastly, since the body regions and organs are in point format, the points for each structure are converted to surface contours using convex hull algorithms (Cormen et al
2009
).
2.2.2. Modifications in scaling factor estimation
Since the UF/NCI phantoms are available at discrete ages, we developed a protocol to apply our ASFs to scale the UF/NCI phantoms from discrete ages to our generic phantom dimensions and then scale from the generic phantom dimensions to any arbitrary age. Therefore, the scaling function,  in a head-first-supine orientation, is obtained by taking the ratio of scaling functions
  of a specified body region,
  in a direction,
  at an arbitrary target age,
  and
and  of the same
  in the same direction but at the original discrete age,
  as shown in equation (1).


 {left to right (x), anterior to posterior (y), and inferior to superior (z)}

 {head (h), neck (n), trunk (tr), arms (ar), legs (lg)}

 {0.1 (1 month), 1, 3, 5, 10, 15, 18}, and
 lies in the age intervals {[0, 1), [1, 3), [3, 5), [5, 10), [10, 15) and [15, 18)}
The ratio in equation (1) is obtained for each body region  in all three directions, which results in three scaling factors
  in RL, AP, and IS directions, respectively.
2.2.3. Modification in transformation equations
Two factors drive the modification of our original transformation equation: the availability of the UF/NCI phantom in DICOM format and adoption of the RayStation treatment planning system (TPS), which is currently used in our clinic. The body regions and organs of the UF/NCI phantom are in 3D region of interest (ROI) format in RayStation and the TPS has the 'TransformROI3D' function where scaling, rotation, shear transformation, and translation factors are entered in the first three rows of 4 × 4 affine transformation matrix  as shown in equation (2). Since the transformation that we performed in RayStation only involves scaling and translation, all other components are equal to zero. Furthermore, the aforementioned operations (except translation) represent the orientation of ROI in space, but the translational component (4th column) represents a position in space. To accommodate this, the affine transformation matrix is internally represented in the homogenous coordinate systems in the TPS, where 3D coordinates (x, y, and z) are represented by quadruplet (x, y, z, and 1). Therefore, 1 and 0 are added for translational and other operations, respectively, in the 4th row of T.

where,  are the scaling factors (from equation (1)) that scale an ROI in the RL, AP, and IS directions, respectively.
 and
and  translate an ROI in the RL, AP, and IS directions, respectively.
To adapt our original transformation equations (Gupta et al
2020) correctly in the 'TransformROI3D' function, we modified our original approach which we will summarize here. We first performed scaling of ROIs using scaling matrix  (equation (3)) where rotational and translational elements are zero. We then translated the scaled ROI using
  (equation (4)) where scaling and rotational elements are zero. Equations (3) and (4) are the modified versions of equation (2).


If R is the matrix representing N 3D coordinates (x, y, and z) of an unscaled 3D ROI of the patient in the RL, AP, and IS directions, then the scaled ROI  at an arbitrary age
  is obtained by

Where 1 is added in the 4th row of R and represents 3D coordinates of ROI in homogeneous coordinate system. The above operation results in displacements in the centroids (center of mass) of the body regions and organs as each body region and its corresponding organs undergo non-uniform scaling. To remedy this, we first correct the centroids of the body region and then the centroids of the organs (also presented in figure 1). For body regions, we first determine the centroid of the scaled head ROI. Then, we translate it back to centroid before scaling. We then translate all other scaled body regions to the mid-plane (in AP and RL directions) of the scaled head ROI using  The translations in IS direction, for correct body region stacking, is determined by scaling the distance between the centroids of unscaled head and body regions ROI as described in more detail in Gupta et al (2020). Organs ROI are translated with respect to centroids and the anterior and upper boundary of the body region they belong to. This results in the accurate scaling of the original depth of organs in all directions. Therefore, the centroids (
 ) of the scaled organ ROI, o, are given by:
where,
 and
and  are the centroids of the scaled and unscaled body region,
  , in the RL direction, respectively. The
  and
and  signs accounts for the organs located in the right and left directions, respectively, from the mid-plane of the patient.
 are the centroids of unscaled organ,
  , in the RL, AP, and IS directions, respectively.
 are the anterior boundaries of scaled and unscaled body regions,
  , in the AP direction.
 are the upper/superior boundaries of scaled and unscaled body regions,
  , in the IS direction.
Once  is calculated, the organ ROIs are translated to their correct centroid using
Although UF/NCI phantoms were used in this study, the above methodologies can be applied to any DICOM-compatible phantom or whole-body patient anatomy for which ROI of the body regions and organs of interest are available.
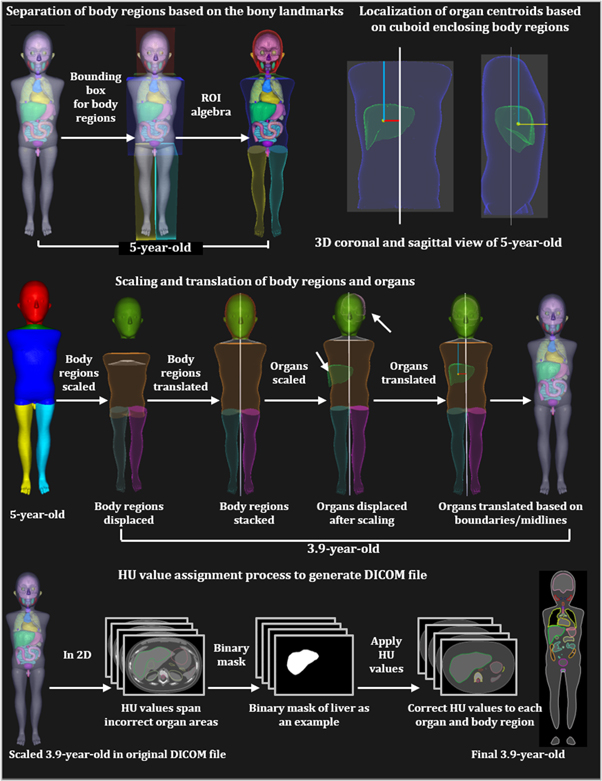
Figure 1. Steps used in the scaling process of the UF/NCI phantoms to arbitrary ages. Scaling of a reference size 5-year-old to 3.9-year-old is shown as an example.
Download figure:
Standard image High-resolution image2.3. Scaling of computational phantoms to arbitrary ages
To perform the scaling and generating of DICOM files of the scaled phantoms, DICOM files of the original phantoms are imported into the RayStation v10B TPS. We developed Python scripts that can scale any whole-body CT-based anatomy from one age to another as long as we have organ contours/ROI or points representing the ROI. This task is accomplished with three different in-house Python scripts using the following steps. A general overview of the steps for downscaling a 5-year-old to a 3.9-year-old is presented in figure 1.
- 1.Data preparation: The current and target ages of the phantom or patient anatomy are entered in the Python script. A quality check is performed to ensure that the phantom is in head-first-supine orientation and the names of all organs within the phantom match a name from the list of names that are defined in the script.
- 2.Body region separation: Since the UF/NCI phantom does not have the body regions defined, we divided the whole-body ROI into head, neck, trunk, arms, and legs based on bony landmark measurements performed on the phantom. For example, the boundary of the head and neck is at the intersection of the 2nd and 3rd cervical vertebrae. The separation was performed using ROI algebra in the RayStation TPS.
- 3.Localization of organ centroids: Distances between the organ centroids and the boundary of body regions are calculated. In the RL, AP and IS directions, the distance is calculated with respect to the midline of the patient, the anterior boundary of the cuboid enclosing the body regions, and the upper boundary of the cuboid enclosing the body regions, respectively. The calculated distances are scaled using equation (1).
- 4.
- 5.Post-processing: The boundaries of body regions in the AP, RL and IS direction are checked for discontinuity, gaps, or any unanticipated translation. The manual translation is performed for such cases. Steps 2 through 4 involve multiple ROI algebra operations, which could result in small holes in the contours, contour overlaps, and fragments. This is fixed by using the 'Simplify contours' function in RayStation.
- 6.Assignment of Hounsfield unit (HU) values: Once the phantoms are scaled in the TPS, the size of the body regions/organs changes in each slice, and as a result, the contour/ROI boundaries do not cover the same voxels of the CT scan. Because of this, the HU values originally assigned to each voxel no longer represent the scaled anatomy. To assign the correct HU values to each voxel, the DICOM files are exported and are processed with our Python script. The following lists the sub-steps within step 6.
- a.Using the polygon function of the skimage.draw Python module (Van Der Walt et al 2014), we trace the boundary of contours on the slices of CT scan. Using the traced boundary, we create masks on each slice and then we record the voxel locations.
- b.For discrete ages, we obtain HU values from the DICOM RT generator software (Griffin et al 2019). For continuous-valued age, we perform linear interpolation to estimate the HU values.
- c.For each scaled organ ROI, we assign same HU values to each voxel that reside within the ROI boundary.
The result of step 6 is a CT scan with voxels that are assigned HU values based on the ROI boundary that a voxel resides in.
- 7.Quality Check: DICOM files are imported into RayStation TPS and are visually inspected by the user for artifacts and discontinuity of the voxel HU values at ROI boundaries. Contours are simplified and holes are removed. Afterward, the DICOM files are ready for the dose calculations.
2.4. Feasibility and validation study
For the feasibility study using our ASFs, we downscaled both male and female discrete-aged phantoms (5, 10, 15 and 35 years) to the nearest lower discrete ages (1, 5, 10 and 15 years), resulting in 8 scaled phantoms (4 male and 4 female), and validated the scaled phantoms with the original UF/NCI phantoms available at that age, i.e., ground-truth phantoms. For example, the 5-year-old male phantom was scaled to the size of a 1-year-old phantom and was validated with a ground-truth 1-year-old male phantom. To show the feasibility of scaling discrete-aged phantoms to continuous valued-aged phantoms, we downscaled the nearest age-matched discrete-aged phantoms to three different ages, representative of the CCSS expanded cohort. Specifically, both male and female 5-year-old phantoms were downscaled from reference size UF/NCI phantom library to 3.9-year-old phantoms (median age at RT for Wilms' tumor patients in CCSS expanded cohort). Similarly, both male and female 10-year-old phantoms were downscaled to 8.1 and 9.0-year-old phantoms (median ages at RT for craniospinal tumor patients and for entire CCSS expanded cohort, respectively). A total of 14 phantoms were downscaled using two methods; 8 phantoms scaled to nearest lower discrete age and 6 phantoms scaled to median ages based on CCSS participants' ages at RT.
We used two approaches to validate the scaling of phantoms. In the first approach, we compared the overlap and organ displacement parameters between the scaled and ground-truth UF/NCI phantoms at discrete ages. In the second approach, we compared the anthropometric parameters of scaled phantoms with ground-truth phantoms, and with reference data from the Center for Disease Control and Prevention (CDC) (Centers for Disease Control and Prevention 2020).
2.4.1. Quantitative assessment of body region/organ overlap and displacements at discrete ages
The main goal of quantifying the overlap and the displacement was to determine the body-regions/organs that are most and least affected by scaling, in terms of their size and position. To quantify the overlap between two ROIs of a body region/organ, we first performed rigid registration between the scaled and ground-truth phantoms at discrete ages using the centroid of the trunk body region. Using built-in functions within RayStation v10B, we calculated the Dice similarity coefficients (DSC) and mean distance to agreement (MDA) for the whole-body, brain, heart, liver, pancreas, and kidneys between the scaled and ground-truth phantoms. The DSC is a measure which calculates the overlap between two ROIs. The values of DSC ranges from 0 to 1 with 0 indicating no overlap and 1 indicating complete overlap (Dice 1945). A DSC value of 0.7–0.8 is considered good agreement (Dice 1945, Mattiucci et al 2013, Thomson et al 2014). The MDA estimates the average similarity between the two ROIs by estimating the positive average distance between the point per voxel on the surface of two ROIs (Brock et al 2017). A value of MDA = 0 cm represents that the boundaries of two ROI is perfectly overlapped, and MDA > 0 cm represents waning overlap.
To estimate the displacements in the body regions/organs, we calculated the Euclidean distance (ED) between the centroids of the body regions/organs of scaled and ground-truth reference size UF/NCI phantoms using the equation below-
where,  and
and  are the centroids of body regions/organs ROIs in ground-truth and transformed (scaled) phantom, respectively.
2.4.2. Quantitative assessment of anthropometric parameters at all ages
The goal of assessing the anthropometric parameters was to gauge the standing heights and organ masses of the scaled phantom with respect to reference data. First, we compared the standing heights of the scaled phantoms with those of the ground-truth phantoms at discrete ages and reference data from CDC at all ages. Specifically, we calculated the percent difference (equation (10)) between the standing heights of scaled phantoms, and (1) heights of the ground-truth phantoms, and (2) CDC-reported 50th percentile heights for all 14 scaled phantoms.
Second, we compared the scaled organ masses with the masses from ground-truth phantoms at discrete ages. First, we estimated the mass of organs by taking the product of the organ volumes from RayStation and ICRU 46 reported reference densities (ICRU 1992b). We then calculated the percent difference (equation (10)) between the masses of scaled organs and ground-truth phantom organs. The calculation was performed for brain, heart, lungs, liver, stomach, and kidneys and all of the male and female discrete-aged phantoms, as ground-truth UF/NCI phantoms are unavailable for 3.9-, 8.0-, and 9.1 years. For lungs and kidneys, combined masses of left and right organs were compared.

Where, S and G are the anthropometric parameter (height or mass) of the scaled and ground-truth phantoms or CDC data (height only).
2.5. Difference in organ dose due to scaling- Wilms' Tumor RT plan example
In historic RT cohorts, dose reconstructions are based on treatment parameters abstracted from the RT records, including field size and field location (based on anatomical landmarks). In such studies, patients' heights and weights or CT images are not always available. Thus, if one were to do the dose reconstructions for survivors at continuous-valued ages, the nearest age-matched phantom would be selected, and the coded field would be reconstructed on that phantom. In this scenario, a patient's coded field size would not be adjusted in size for the differences in age between the patient and the closest age-matched phantom. However, in contemporary treatments, RT records include patients' height and weight and CT images at the time of RT. In this scenario, with the anatomical information, the field sizes could be appropriately adjusted to better align with the anatomical landmarks from the RT records. Therefore, in our dosimetric assessment, we considered both scenarios and performed a dosimetric assessment between the exact age-scaled and nearest age-matched discrete-aged phantoms by designing typical RT plans in RayStation TPS for Wilms' tumor as this is one of the common pediatric cancers in the CCSS.
In the first study, we downscaled a reference size 5-year-old phantom to a 3.9-year-old and constructed right flank fields identical in size on both the 3.9-year-old and 5-year-old phantoms. Specifically, 6 MV AP/PA right flank fields were simulated on a 3.9-year-old with the superior field border at 2 cm below the liver/heart boundary, the inferior border at the 5th lumbar vertebrae, the right border at a 1 cm margin enclosing the liver, and the left border enclosing the vertebral bodies. A total of 20 Gy was administered to the isocenter placed at midplane in AP/PA direction. We then measured the size of the simulated field and reconstructed an identical pair of AP/PA flank fields on a 5-year-old phantom. The volume receiving  15 Gy (V15), and the mean dose to pancreas, liver, and stomach were calculated. Absolute difference and percent difference were calculated for both phantoms' RT plans.
In the second study, we scaled a cohort of seventeen body size-dependent UF/NCI phantoms (9 male and 8 female) created from the 5-year-old reference phantom to 3.9-year-old and simulated the same standard Wilms' tumor 3D conformal RT plan on all 34 phantoms. All of the treatment parameters were the same as the 3.9-year-old of the first study except the field size, which varied to maintain identical field borders. Specifically, the superior and inferior field borders were set at 2 cm below the liver/heart boundary and the level of the 5th lumbar vertebrae, respectively. The medial field border was set enclosing the thoracic vertebrae. Dose to organs that were either fully or partially in-beam was calculated. Here, we compared the percent of volume receiving  15 Gy (V15), mean dose, and minimum dose received by 1% (D1) and 95% (D95) between the 5-year-old phantoms and the corresponding 3.9-year-old phantoms. Organs included the pancreas, liver, stomach, left kidney (contralateral), right kidney, right and left colons, gallbladder, thoracic vertebrae, and lumbar vertebrae. To determine if the dose and dose-volume metrics were significantly different between treatment plans for the different phantoms, we performed a non-parametric Wilcoxon rank sum test (Wilcoxon 1945) using the SciPy package of the Python programming language. Medians, standard deviations, and p-values (p < 0.05 is significant) are reported for each metric.
3. Results
3.1. Feasibility of scaling UF/NCI phantoms to continuous-valued ages
The feasibility of downscaling the reference size UF/NCI phantoms to any arbitrary age using our ASF and transformation function is demonstrated in figure 2. The figure shows the downscaled phantoms in standing positions next to their nearest age-matched discrete-aged phantom. An important finding of the scaling is that the structural integrity of the phantoms is maintained after the scaling, i.e., all of the organs and body regions remained intact with no unexpected organ displacement or gaps between body regions.
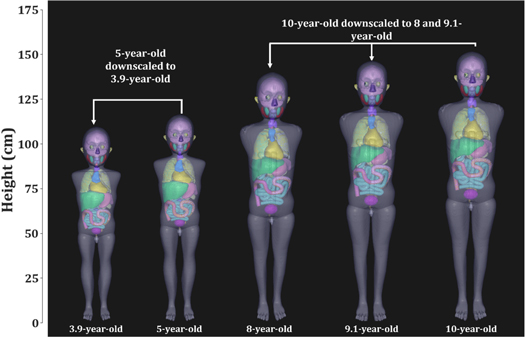
Figure 2. Downscaling of UF/NCI nearest age-matched discrete-aged pediatric male phantoms (5-year-old and 10-year-old phantoms) to median ages at the time of RT (3.9 years for Wilms' tumor, 8 years for all individuals treated with cranial RT, and 9.1 years for all individuals from the CCSS expanded cohort treated with RT).
Download figure:
Standard image High-resolution image3.2. Quantitative assessment of overlaps and displacements due to scaling at discrete ages
The DSC, MDA, and ED between the scaled and ground-truth reference size phantoms at discrete ages for the whole-body ROI and organ ROIs are presented in figure 3. The whole-body and brain showed good ROI overlap with median (range) DSCs of 0.91 (0.86–0.92) and 0.86 (0.58–0.91), respectively. The heart and liver showed average agreement after scaling with a median DSC of 0.70 (0.61–0.78) and 0.74 (0.38–0.80), respectively. The kidneys and pancreas had the poorest overlap agreement with low DSC values of 0.58 (0.45–0.74) and 0.32 (0.01–0.62), respectively.

Figure 3. (a) Dice similarity coefficients (DSC), (b) mean distance to agreement (MDA), (c) Euclidean distance (ED) between the scaled and ground-truth phantoms at discrete ages for whole-body and five different organs are shown. Means are represented by white square boxes.
Download figure:
Standard image High-resolution imageAdditionally, the liver, pancreas, and heart showed larger MDA values compared to the other organs. Specifically, the median (range) MDA for liver, pancreas, and heart were 0.73 cm (0.43–1.79 cm), 0.78 cm (0.47–2.29 cm), and 0.68 cm (0.47–1.1 cm), respectively, while the median MDAs for the whole body, brain, and kidneys were 0.65 cm (0.47–0.93 cm), 0.51 cm (0.34–1.7 cm) and 0.62 cm (0.29–0.98 cm), respectively. However, those differences are not very meaningful as the box plot overlaps mostly.
The brain showed the smallest range of ED displacements with a median ED of 0.97 cm (0.58–3.67 cm), while the pancreas, whole-body, heart, kidneys and liver showed median EDs to 2.03 cm (0.72–3.82 cm), 1.35 cm (1.04–2.3 cm), 1.33 cm (0.39–1.9 cm), 1.04 cm (0.41–2.79 cm), and 0.97 cm (0.58–4.09 cm), in case of whole-body, heart, liver, pancreas and kidneys, respectively. The liver showed the highest ED displacement (4.09 cm) among all organs.
3.3. Comparison of anthropometric parameters
The overall trends in standing heights and the percent difference/absolute difference between the standing heights of the scaled phantom and reference data (UF/NCI and CDC) are shown in figure 4 and table 2 at all studied ages. Figure 4 shows that the scaled heights of the phantoms follow a similar trend as the ground truth phantoms and reference heights for age <10 years. However, at ten years, we observed a bifurcation in the scaled male and female heights. In table 2, the overall heights of the scaled phantoms were within 2.8% (3.9 cm), and 3.0% (3.2 cm) of ground-truth UF/NCI and CDC reported 50th percentile heights, respectively. Higher disagreement was observed for scaling involving the age of 15 and 35 (adult) phantoms and/or female phantoms. For all other cases, the agreement was observed within 2.7% (2.7 cm).
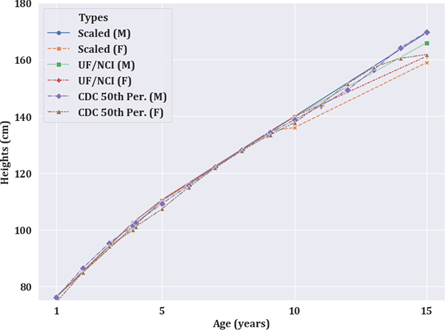
Figure 4. Trend of standing heights of scaled phantoms with respect to original UF/NCI phantoms and CDC reported 50th percentile heights for males and females.
Download figure:
Standard image High-resolution imageTable 2. Comparison of standing heights of scaled phantom heights with ground-truth UF/NCI phantom heights and with CDC reported 50th percentile heights.
| Scaled Heights (cm) | PERCENT DIFFERENCE (%) | |||||
|---|---|---|---|---|---|---|
| UF/NCI | UF/NCI | CDC | CDC | |||
| Age b | Male | Female | Male a | Female a | Male a | Female a |
| Discrete ages | ||||||
| 1 (5) | 76.2 | 76.2 | 0.4 (0.3) | 0.4 (0.3) | 0.1 (0.1) | 2.4 (1.8) |
| 5 (10) | 110.6 | 110.6 | 0.3 (0.3) | 0.3 (0.3) | 1.3 (1.4) | 3.0 (3.2) |
| 10 (15) | 139.9 | 136.0 | 0.0 (0.0) | 2.8 (3.9) | 0.8 (1.1) | 1.3 (1.8) |
| 15 (Adult) | 169.5 | 158.9 | 2.1 (3.5) | 1.9 (3.0) | 0.1 (0.2) | 1.8 (2.8) |
| Continuous-valued ages c | ||||||
| 3.9 (5) | 102.6 | 102.6 | 1.6 (1.6) | 1.6 (1.6) | 1.1 (1.2) | 2.7 (2.7) |
| 8 (10) | 128.3 | 128.3 | 0.2 (0.2) | 0.2 (0.2) | 0.1 (0.2) | 0.4 (0.5) |
| 9.1 (10) | 134.8 | 134.8 | 0.2 (0.2) | 0.2 (0.2) | 0.5 (0.6) | 1.0 (1.3) |
a Absolute difference is shown in the parenthesis (in cm). b Original age of the phantom that was used for downscaling is shown in parenthesis. c Linear interpolation was used to estimate the ground-truth heights of UF/NCI phantoms for non-discrete ages.
The scaled masses (in grams) of seven different organs and the percent or the absolute difference compared with ground-truth organ masses are listed in table 3 for all the discrete-age scaling. Overall, the scaled organ masses agreed within 31.3% of their ground truth organs masses. The maximum percent difference of 31.3% corresponded to an absolute difference of 29.8 g and was obtained for 1-year-old female heart. Furthermore, the maximum difference was −211.8 g (−16.4%) which was obtained for the liver of 15-year-old female. Most of the scaled masses were smaller than the ground-truth organ masses as represented by the negative differences. However, few scaled masses were larger than the ground-truth values mostly for 1-year-old.
Table 3. Comparison between scaled and ground-truth UF/NCI computational phantoms organ masses are presented. Both percent difference (PD) and differences are reported. Scaled masses and differences are in grams.
| 1-year-old | 5-year-old | 10-year-old | 15-year-old | |||||||||||||
|---|---|---|---|---|---|---|---|---|---|---|---|---|---|---|---|---|
| Organs | SM | SF | % UF/NCI M | % UF/NCI F | SM | SF | % UF/NCI M | % UF/NCI F | SM | SF | % UF/NCI M | % UF/NCI F | SM | SF | % UF/NCI M | % UF/NCI F |
| Brain | 896.1 | 896.3 | −4.7 (−44.7) | −4.7 (−44.5) | 1158.0 | 1158.1 | −6.2 (−76.5) | −6.2 (−76.4) | 1311.5 | 1199.5 | 1.3 (17.4) | −7.3 (−94.6) | 1326.7 | 1196.7 | −5.1 (−70.7) | −6.4 (−81.2) |
| Heart | 125.3 | 125.3 | 31.3 (29.8) | 31.3 (29.8) | 198.4 | 198.5 | −7.2 (−15.3) | −7.2 (−15.3) | 356.0 | 291.8 | −0.7 (−2.6) | −18.6 (−66.9) | 636.4 | 469.4 | −0.3 (−1.8) | −10.0 (−52.4) |
| Lungs | 106.9 | 106.9 | 11.8 (11.3) | 11.9 (11.3) | 174.3 | 174.2 | −4.2 (−7.6) | −4.2 (−7.7) | 373.7 | 357.2 | 18.9 (59.3) | −13.6 (42.8) | 669.1 | 547.9 | 0.0 (0.0) | −14.2 (−91.0) |
| Liver | 330.6 | 330.7 | 1.9 (6.2) | 1.9 (6.3) | 451.0 | 451.2 | −19.8 (−111.1) | −19.8 (−111.0) | 714.0 | 717.1 | −12.3 (−100.2) | −11.9 (−97.1) | 1391.5 | 1082.5 | 7.7 (99.0) | −16.4 (−211.8) |
| Stomach | 77.0 | 76.9 | −10.4 (−9.0) | −10.5 (−9.0) | 110.0 | 110.0 | −15.8 (−20.7) | −15.8 (−20.7) | 170.1 | 175.2 | −13.9 (−27.4) | −11.3 (−22.3) | 306.4 | 285.7 | −1.2 (−3.6) | −8.8 (−27.7) |
| Pancreas | 19.6 | 19.6 | 1.5 (0.3) | 1.6 (0.3) | 31.4 | 31.4 | −7.2 (−2.4) | −7.1 (−2.4) | 57.5 | 54.4 | 0.0 (0.0) | −5.4 (−3.1) | 105.2 | 91.1 | 0.7 (0.7) | −6.4 (−6.2) |
| Kidneys | 65.7 | 65.7 | −7.8 (−5.6) | −7.8 (−5.6) | 101.3 | 101.2 | −9.5 (−10.7) | −9.6 (−10.7) | 140.9 | 135.8 | −23.1 (−42.2) | −25.8 (−47.3) | 242.1 | 216.5 | −4.2 (−10.7) | −10.8 (−26.3) |
SM = Scaled male (in g), SF = Scaled female (in g), % UF/NCI M =% difference between scaled and ground-truth UF/NCI male, % UF/NCI F =% difference between scaled and ground-truth UF/NCI female, Differences are shown in parenthesis (in g), Negative represents ground-truth phantom masses are greater than scaled masses.
3.4. Comparison of Wilms' tumor RT plan dose of exact age-scaled and nearest age-matched phantoms
The results of the dosimetric study, in which the same field size and same isocenter were used for the Wilms' tumor treatment plans for a 3.9-year-old downscaled from a reference size 5-year-old and an original unscaled reference size 5-year-old phantom, are reported in table 4 and figure 5. The beam's eye view and isodose washes for the 3.9-year-old are shown in 5a and 5c, and those for a 5-year-old are shown in 5b and 5d, respectively. In the isodose washes, dose coverage of the organs differed between the 3.9-year-old and the 5.0-year-old. For example, different fractions of the pancreas and liver are enclosed within the 75% isodose line ( ). As a result, the absolute differences in V15 of pancreas and liver were 3.52% and 5.98%, respectively (table 4). Results for all organs and dose metrics are listed in table 4.
Table 4. Absolute and percent difference between the V15 and mean dose from 6MV Wilms' tumor RT plan (20 Gy to right kidney) between unscaled reference size 5-year-old and 5-year-old downscaled to 3.9-year-old.
| V15, in % | Mean Dose, Gy | |||
|---|---|---|---|---|
| Organs | Abs. diff | % diff | Abs. diff | % diff |
| Pancreas | 3.52 | 42.04 | 0.85 | 4.25 |
| Liver | 5.98 | 8.61 | 1.29 | 6.45 |
| Stomach | 0.00 | 0.00 | 0.11 | 0.55 |
% difference in mean dose is normalized to 20 Gy.

Figure 5. Digitally reconstructed radiograph of a Wilms' tumor plan for (a) a 3.9-year-old downscaled from a reference size 5-year-old and (b) an unscaled reference size 5-year-old. Isodose wash for liver, stomach, kidneys, and pancreas of (c) the downscaled and (d) the unscaled phantoms for 5% (cyan), 75% (blue), 95% (purple), 100% (yellow), and 110% (red) of the prescription dose. Except vertebral bodies, no bones were downscaled.
Download figure:
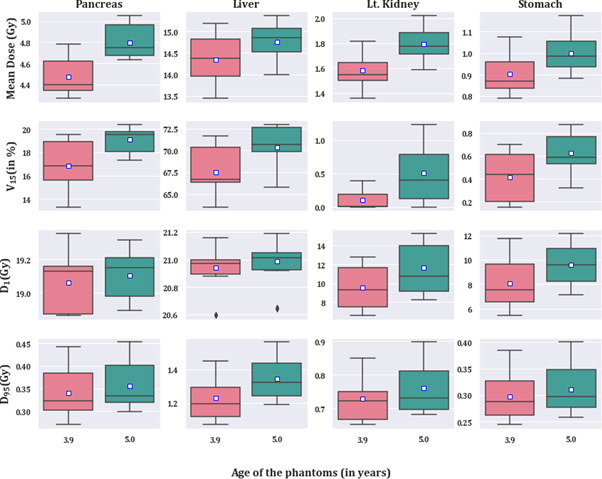
Standard image High-resolution imageResults from the dosimetric study where the field borders relative to anatomical landmark were consistent for all phantoms (resulting in different field sizes) are listed in table 5 and illustrated in figure 6. V15 and mean dose were significantly different between exact age-scaled and nearest age-matched phantom in all other organs except for the right kidney (target), right colon, and gallbladder. The contralateral kidney was significantly different between phantoms in all dose metrics except D95. Similarly, liver and pancreas were significantly different in all except D1 and D95, respectively. Figure 6 shows the distribution of metrics for selected near beam organs; pancreas, liver, contralateral kidney, and stomach. In all organs and metrics, the median and mean were higher in the case of the original 5-year-old phantom.
Table 5. Metrics investigated to establish the difference in dose from 6 MV Wilms' tumor RT plan (20 Gy to right kidney) in between 3.9-year-old and 5.0-year-old phantoms. Wilcoxon rank sum test was performed to determine if differences were statistically significant (p < 0.05 is significantly different).
|
V15 = percent of volume receiving  15 Gy; D1 is dose received by 1% of the volume; D95 is dose received by 95% of the volume. Blue label highlights the significantly different cases; Rt. and Lt. colon stands for right and left colon respectively. T. and L. vertebra stands for thoracic and lumbar vertebra. Med. indicates median.
Figure 6. Boxplot showing the V15, mean dose, D1, and D50 for pancreas, liver, left kidney, and stomach. All of the results presented here are significantly different (p < 0.05, N = 17) except D95 for left kidney, D1 for the liver, and D95 for the stomach. Mean is represented by the white box.
Download figure:
Standard image High-resolution image
4. Discussion
In this study, we have successfully scaled the realistic CT-based UF/NCI pediatric reference phantom to arbitrary ages using our ASFs, which is also a proof-of-concept that our ASFs can be used to accurately scale any CT-based anatomy. We have also established that dose to organs in between the cohorts of age-specific (continuous-valued age) and nearest discrete age-matched phantoms varies significantly (p < 0.05). This is an indication that using an exact age-scaled phantom is an important consideration for dose reconstruction studies. Our ASFs are functions of age, direction and body region, and are primarily used in retrospective organ dose reconstruction studies where phantom or patient's anatomy must be generated at the time of RT. Currently, there exists a different types of protocols for selecting phantom as surrogate anatomy: one would select phantom by matching the heights and weights of the patient or select the nearest age phantom or select the phantom based on the anthropometric parameter of the trunk from the CT scan at the time of treatment (Whalen et al 2008, Kuzmin et al 2018). However, for retrospective studies such as in the CCSS (N > 13000 with RT) where patients were treated in the pre-CT era, age is the only most common, and often the only anthropometric parameter that is available retrospectively. In such a many case, matching the height and weight of the phantom or matching the anthropometric parameter of the trunk is not feasible. One would attempt to select a nearest-age phantom instead of a continuous-valued age phantom; however, such protocols are associated with higher uncertainties in organ shape and size/volume, that can translate to uncertainty in organ dose reconstruction and hence in risk assessment (Kry et al 2007, Whalen et al 2008, Morton et al 2013). Our age scaling methodologies overcome these limitations as they can accurately scale any phantom of choice or CT-based anatomy to the patient's age at the time of treatment. Furthermore, our ASFs roughly require 3 min (as illustrated in the video in appendix 1 (available online at stacks.iop.org/BPEX/8/025010/mmedia)) to scale a phantom in TPS which also ensures it suitability in the large cohorts. Lastly, our ASFs have been used to scale our in-house phantoms for other cohorts such as the St. Jude Lifetime, Adult Life after Childhood Cancer in Scandinavia, and the Dutch Childhood Oncology Group over three-decade (listed in Howell et al (2019)).
Our feasibility study showed reasonable accuracy in the context of overlap and displacement metrics for the whole body and various organs. While the whole-body and brain showed the best DSC scores, the heart and liver scores were still acceptable as they showed median DSCs of 0.69 and 0.73, respectively which means 50% of the distribution are >0.7 which is considered a good DSC values (Dice 1945, Zou et al 2004). As reported in section 3.2, the pancreas and kidneys showed poor DSC agreement as the median DSCs were at 0.32 and 0.58, respectively, but this cannot be solely attributed to an error in transformation and scaling as the heart and liver should have also shown poor agreement because all organs in trunk use same scaling factors. It is important to note that the UF/NCI phantoms at different ages are not from the same/single patient, which introduces inter-patient variation in organ shape, size, and position (Lee et al 2010). Furthermore, another reason could be attributed to the sensitivity of DSC to the volume of the organ. For example, a 1 cm displacement could affect the pancreas/kidneys more than the brain which has a larger volume. The large ED for the liver and pancreas in our study was not unexpected as studies of adult patients have reported high range of motion for these organs. One study reported motion of up to 5.7 cm in the liver (Davies et al 1994, Langen and Jones 2001), while another study reported motion of up to 8 cm in liver and pancreas (Suramo et al 1984, Langen and Jones 2001). This organ displacement also contributed to the poor agreement we observed in DSC and MDA.
In the anthropometric assessment of scaled phantoms, we observed a bifurcation in the heights of scaled male and female phantoms starting at the age of 10 and 15 years because the heights of reference size male and female UF/NCI phantoms (ground-truth) only differ at the age of 15 and 35 years, and ASFs downscaled male and female phantoms at the same rate from their upper nearest discrete ages. Hence, there is a bifurcation of scaled height at 10 years even though the ground-truth male and female heights are the same at that age. In table 2, we observed that most of the higher disagreements were confined to scaling involving 15-, and 35-years old male and/or female phantoms. This is because we use gender-neutral ASFs and our ASFs assume constant growth after the age of 18 as late effects studies of childhood cancer survivors rarely involve scaling beyond 18-year-old and never beyond age 21. With regard to organ masses, we observed ground-truth organ masses, that were greater than scaled organ masses for most cases, but the scaled masses were also greater in few cases, mostly for 1-year-old-phantom. This could indicate that our ASF might be underestimating or overestimating the masses, but an exact conclusion cannot be drawn because there are inherent biases due to inter-patient variation in UF/NCI phantoms at discrete ages. Although the scaled masses highly deviated from ground-truth masses, the scaled masses for organs such as the brain, lungs, liver, and kidneys for 1-, 5-, and 10-year-old are well within the range of masses reported in the US population autopsy study by Molina et al (2019).
For the dose study, our investigation using the same field size on exact age-scaled versus nearest age-matched phantoms showed differences in V15 and mean dose up to 6% and 1.3 Gy (6.45%), respectively. We used the same field size because, in retrospective dose reconstruction, one would not modify the original field size when using an age-matched phantom instead of an exact-age phantom. The reason behind the differences is mostly the shape and position of the organs which varied across exact age-scaled and nearest age-matched phantom. In dose reconstruction studies, it has been found that organ shape, volume, position, dose reconstruction method, irradiation sources, etc are the major sources of uncertainty in dose estimation (V Bezin et al
2017). Furthermore, Kry et al (2007) estimated that a 50% uncertainty in dose estimation could result in a significant difference in risk of a second cancer. Therefore, an uncertainty of 6% in V15 or 6.45% in mean dose can potentially affect the risk estimation studies when they are combined with other sources of uncertainties. Additionally, a difference of 1.3 Gy can also affect the risk estimation study if the doses are finely binned and organ dose values (not the difference) falls at the edge of the bin. Those impacts will be pronounced when the cohort size is large. Furthermore, it is also important to determine the effect of scaling on the field size and hence on the organ dose. Our second study showed that V15 and mean dose were significantly different (p < 0.05) except for the organs that are fully inside the beam. This result was expected because those organs received roughly 100% of the prescribed dose in each case.
While we have successfully demonstrated the feasibility of scaling the phantoms to any arbitrary age using our in-house ASFs and have established the difference in dose between exact-age and nearest age-matched phantoms, our study also revealed that our ASFs need enhancements. Specifically, in the current study, the underestimation and overestimation of the organ masses (as shown in table 3) suggest our ASFs could be enhanced with gender-specific and organ-specific ASFs in addition to our current body region-specific ASFs.
Our current ASF-related enhancement includes the development of scaling factors based on the sex and percentile height of the U.S. male and female population. We are combining our ASFs and CDC-reported male and female percentile specific-heights to generate gender and percentile specific ASFs. This will allow us to scale the phantom based on these sex and percentile heights, which will be available in modern CCSS cohorts. Furthermore, for modern cohorts in the CCSS, the survivor data will be present in the CT scans, where we can measure body region-specific parameters such as size, volume, and circumference. We can use those parameters to estimate the BMI of the patients and develop modulation factors to generate cohort specific ASFs. Finally, our group is enhancing/developing individual organs (e.g., heart, colon, etc) within our in-house phantom, which involves the incorporation of modulation factors into scaling methodologies. For example, Shrestha et al (2020) introduced a modulation factor based on inherent differences in the trunk size of a UF/NCI phantom and our DICOM phantom to develop a new CT-based hybrid cardiac model before integrating it into the generic phantom. This enhanced cardiac model was recently used to update the radiation related cardiac disease risks for pediatric cancer survivors treated with RT (Shrestha et al 2021).
5. Conclusion
We have successfully implemented our ASFs to scale UF/NCI phantoms from one age to another age and have validated the scaling process with reasonable accuracy in terms of geometric and anthropometric parameters. We have also established that there exists a significant difference in dose to organ between populations of exact age-scaled continuous-valued phantoms and nearest age-matched discrete aged phantoms. The implementation and validation allow us to scale - UF/NCI phantoms or any CT-based patient anatomy for RT epidemiological study using cohorts where age is the main parameter.
Acknowledgments
The manuscript was edited by Sarah Bronson, ELS, of the Research Medical Library at The University of Texas MD Anderson Cancer Center. We thank Cameroon Ditty, RaySearch Americas, for helping us with facts about ROI scaling in RayStation TPS.
Data availability statement
The data that support the findings of this study are available upon reasonable request from the authors.
Funding
The MD Anderson Late Effects Group (PI: Dr Rebecca Howell) receives funding through a subcontract with Childhood Cancer Survivor Study, ID: RFA-CA-15-502, NIH/NCI, PI-Gregory T Armstrong.