

Abstract
Objective: Understanding the induced current flow from transcranial direct current stimulation (tDCS) is essential for determining the optimal dose and treatment. Head tissue conductivities play a key role in the resulting electromagnetic fields. However, there exists a complicated relationship between skull conductivity and participant age, that remains unclear. We explored how variations in skull electrical conductivities, particularly as a suggested function of age, affected tDCS induced electric fields. Approach: Simulations were employed to compare tDCS outcomes for different intensities across head atlases of varying age. Three databases were chosen to demonstrate differing variability in skull conductivity with age and how this may affect induced fields. Differences in tDCS electric fields due to proposed age-dependent skull conductivity variation, as well as deviations in grey matter, white matter and scalp, were compared and the most influential tissues determined. Main results: tDCS induced peak electric fields significantly negatively correlated with age, exacerbated by employing proposed age-appropriate skull conductivity (according to all three datasets). Uncertainty in skull conductivity was the most sensitive to changes in peak fields with increasing age. These results were revealed to be directly due to changing skull conductivity, rather than head geometry alone. There was no correlation between tDCS focality and age. Significance: Accurate and individualised head anatomy and in vivo skull conductivity measurements are essential for modelling tDCS induced fields. In particular, age should be taken into account when considering stimulation dose to precisely predict outcomes.
Export citation and abstract BibTeX RIS

Original content from this work may be used under the terms of the Creative Commons Attribution 4.0 licence. Any further distribution of this work must maintain attribution to the author(s) and the title of the work, journal citation and DOI.
1. Introduction
Transcranial direct current stimulation (tDCS) is a non-invasive technique that induces and modulates neural activity in the human brain. A constant low direct current is delivered via two electrodes: a positive (anodal) electrode placed above the target region, and a negative (cathodal) electrode placed contralaterally, facilitating depolar- and hyperpolarisation of neurons, respectively [1, 2]. The effect and application of tDCS on brain function is dependent on the applied region, frequency, duration, and intensity of stimulation. Altering these parameters allows individualised therapeutic and investigative intervention [3]. Understanding the current flow to target brain areas is therefore essential for determining brain stimulation parameters and hence desired clinical outcomes.
Computational models are standardised tools for predicting current flow throughout the brain during neuromodulation [4]. Current flow estimation depends, between other parameters, on the electrical conductivity of head tissues, which vary throughout the literature [5] and uncertainty of which can result in calculation errors. For example, uncertain electrical conductivity, specifically of the skull, has been revealed to influence tDCS electrical fields and substantially alter optimal tDCS stimulation protocol predictions [6]. Moreover, head model simplifications have been shown to play an important role in the determination of optimal tDCS doses. For example, Wagner et al [7] found that including the (traditionally neglected) spongiform bone compartment within the skull altered tDCS current flow. Geometrical simplifications have been previously employed due to the additional information required for accurate segmentation (e.g., computer tomography (CT) scans [8]). However, recent research, for example from Antonakakis et al [9], have developed methods for modelling spongiform bone using T2 weighted magnetic resonance imaging (MRI). Nevertheless, some of the most utilised software packages, such as SimNIBS [10] and ROAST [11], do not have the flexibility to utilise such segmentation. These generalisations, as a result of previous literature segmentation limitations, thus alter skull conductivity values and impact on the simulated electrical currents. Supplementing this, Fernández-Corazza et al [8], using electrical impedance tomography (EIT), revealed that skull conductivity was largely overestimated when not distinguishing between compact and marrow bone. Such overestimation resulted in higher transcranial electrical stimulation current intensities than when employing realistic skull conductivity. Furthermore, when the presence of spongiform bone was neglected, thinner skull regions resulted in higher field strengths [12]. When including the spongiform layer, however, the induced electric field through thicker skull regions was comparable to that of thinner skulls (i.e., high induced field strength) without spongiform bone. This therefore highlights the importance and impact of bone composition. Accompanying the discussed research, using generalised polynomial chaos expansion, Saturnino et al revealed tDCS induced electric fields were significantly impacted by scalp and skull conductivity uncertainties [13]. This suggests the importance of skull conductivity and geometry accuracy is not minimal for tDCS field simulations.
Various factors affect skull conductivity, including participant demographics and measurement methodology. One important modulator of conductivity variation is participant's age. Disparity in skull conductivity with age can be partially attributed to differences in skull composition during development. For example, bone ossification is not complete until approximately the age of 20, where the presence of 'soft' bone with higher water content has been shown to decrease from birth [14, 15]. Four fontanelles are additionally present in neonatal skulls (closing at approximately 18 months old [16]), as well as sutures connecting bone plates in children and adults. These sutures, some of which do not close until the age of 60 [17], can increase conductivity by providing a path of least resistance [18, 19]. The closing of both fontanelles and sutures suggest conductivity of the skull decreases throughout development. For healthy and normally developing adults, without the presence of bone disease (for example osteoporosis), increasing calcium content of skull bone with age has been suggested to result in 'hardening' of the bone and therefore a decrease in electrical conductivity [20, 21]. Foetal bones additionally typically contain red marrow (haemocytoblasts that can produce blood cells). This has a higher water content, and thus higher conductivity, than the yellow bone marrow (produced when haemocytoblasts are replaced with fat cells) commonly present in adult skulls [19, 20]. Total cranial thickness has also been revealed to increase with age and accompanied with decreasing scalp potentials, irrespective of spongiform proportion [22, 23]. In support of this, neonatal skulls were estimated to have higher conductivity in EEG simulation studies [24]. In addition, a decline with age was indicated when directly measuring skull pieces removed during surgery [25] and in E/MEG [9]. A recent meta-analysis, assessing reported human head conductivity values from over 55 papers, further revealed deviation in whole-skull conductivity values could be partially predicted by participant age (alongside other factors [5]). Accompanying this, the brain-to-skull conductivity ratio (BSCR) significantly increased with age, critically interpreted to be primarily due to deviations in skull, rather than brain conductivity. This is supported by Gonçalves et al's work, where brain (grey [GM] and white matter [WM]) conductivity remained relatively stable throughout the ages 25–41 years old, with deviating skull conductivity [26]. Furthermore, it is noted that that skull thickness [9] and the percentage of spongy bone [19] may additionally play a role in skull conductivity variation, particularly as a function of age [26].
Comprehending the influence of age on brain stimulation is particularly important to understand treatment and research outcomes for different age groups. For example, tDCS has been employed within older adult populations as a treatment for mild cognitive impairment (MCI) and Dementia [27, 28]. Further treatments for attention deficit hyperactivity disorder (ADHD) [29, 30] and autism [31, 32] have been applied across children and adolescents. More general applications, for example, treatments for depression and anxiety, are also increasingly applied from both paediatric to geriatric populations [33, 34]. However, the potential influence participant age has on tDCS treatment effects is seldom taken into account.
Despite evidence that skull conductivity deviates with age and may contribute to electric field dispersions, values are often assumed stable. For example, various papers have noted differences in induced tDCS fields with age [35–39], however none considered the additional impact of skull conductivity variation. This has been noted as a limitation of the respective studies [35–37] and differences are often assumed to be due to geometry alone. Furthermore, these existing papers are either limited by participant numbers [34], only consider one age group [30, 39], or separate age in a few pools only rather than continuously [37, 38]. The current paper therefore attempts to bridge this gap by characterising the influence that various estimated age-appropriate skull conductivity ranges has on tDCS induced fields using age-specific atlases to represent population heads. Alongside this, different tDCS intensities were considered to illuminate the potential importance of individualising tDCS dose as a function of age.
2. Materials and methods
2.1. Head models
Standard structural T1 and T2-weighted MRI's were obtained from the publicly available Neurodevelopmental MRI Database. This consisted of age-appropriate average MRI templates ranging from 2 weeks to 89 years old created from different databases of over 400 participants [40–44]. The data is publicly available for experimental and clinical research and is shared under a Creative Commons Attribution-NonCommercial-Noderivs 3.0 Unported License (CC BY-NC-ND 3.0; http://creativecommons.org/licenses/by-nc-nd/3.0/deed.en_US). Six age templates were chosen for the current study at 10, 20, 30, 40, 50 and 60 years old. These templates are based on more than 1000 images, over a large age-group, with an approximately equal number of males and females. They were verified for accuracy and repeatedly visually inspected and manually corrected throughout generation (see [40–44] for details). Age-specific templates were additionally evaluated to provide more accurate tissue segmentation compared to standard MNI atlas priors [44]. The quality of the templates was further analysed by comparing volumetric measures to literature data, finding similar values and supporting their correctness and usefulness [44]. Furthermore, the atlases were recently employed in a tDCS computational [39] and transcranial photobiomodulation simulation (t-PBM [45]) study and validated for use in individual modelling to demonstrate aging tDCS effects.
A volume conductor finite element (FE) head mesh was created for each model with the SimNIBS v3.1.2.[10, 46] 'headreco all' pipeline which runs all the reconstruction steps, including volume meshing [46–49]. The default parameters of the headreco pipeline were utilised. Mesh density was set as 0.5 (nodes per mm2), with bias regularisation factor for T2 correction as 0.01 and downsampling factor in the statistical parametric mapping (SPM) segmentation as 3. This pipeline segments the head into seven compartments: eyes, scalp, skull, CSF, GM, WM and air cavities (paranasal sinuses), without cutting at the base of the skull [50]. Each generated head model consisted of an average of 3.4M tetrahedra of size 1 mm3 (for visualisation of each head model see supplementary figure S2 (available online at stacks.iop.org/BPEX/7/045018/mmedia)). Generated head segmentations were overlayed onto the base MRI to inspect the accuracy of the produced head models. They were visually examined for inhomogeneities and irregularities to ensure normality of brain characteristics (figure S1 details the base MRI of each atlas). To aid in the justification of atlases, head compartment volumes for each in-skull tissue were calculated using the Matlab processing toolbox iso2mesh [51] and compared to literature values. The volumes for the current study are provided in table 1 and the comparisons to previous literature discussed briefly in the results section 3.1 and more extensively the discussion section 4.1. Electric field results were also compared to existing studies utilising individual participant MRIs to confirm they were within expected ranges (specifically ensured comparable to [13, 38]). Corroboration between outcomes employing atlases and those with individual MRIs provided further support for the generated templates.
Table 1. Summary of tissue compartment volumes (in mm3) for each head atlas model and proposed age-appropriate skull conductivity values (in S m−1) corresponding to each employed dataset.
| Skull conductivity ranges (S m−1) | ||||||||||
|---|---|---|---|---|---|---|---|---|---|---|
| Tissue compartment volume (×106 mm3) | Gonçalves et al | Antonakakis et al | Hoekema et al | |||||||
| Age (years) | Skull thickness (mm) | GM | WM | CSF | Min | Max | Min | Max | Min | Max |
| 10 | 5.63 | 0.6291 | 0.5597 | 0.2273 | 0.01 | 0.0167 | 0.0058 | 0.0152 | 0.0803 | 0.095 |
| 20 | 7.21 | 0.6347 | 0.5546 | 0.2165 | 0.0066 | 0.0137 | 0.0041 | 0.0123 | 0.0629 | 0.0784 |
| 30 | 6.84 | 0.5497 | 0.5858 | 0.222 | 0.0043 | 0.0112 | 0.0029 | 0.0106 | 0.0492 | 0.0647 |
| 40 | 6.67 | 0.5618 | 0.5687 | 0.257 | 0.0029 | 0.0092 | 0.0021 | 0.009 | 0.0386 | 0.0534 |
| 50 | 6.26 | 0.556 | 0.5775 | 0.2721 | 0.0019 | 0.0075 | 0.0015 | 0.0078 | 0.0302 | 0.044 |
| 60 | 5.93 | 0.5606 | 0.5807 | 0.3374 | 0.0012 | 0.0062 | 0.001 | 0.0067 | 0.0237 | 0.0364 |
The average whole skull thickness was also computed for each age atlas. First, a region of interest (ROI) was defined as the skull region, within a 20 mm radius, directly below the tDCS anode (C3, as described in section 2.2). The skull thickness of the ROI, defined for each head model, was estimated following a procedure outlined in [9]. Briefly, the skull compartments of each model were extracted, and outer and inner surfaces determined. The normal vectors and centre of gravity (CG) were established at each node of the skull segmentation. A positive scalar product of these indicated the corresponding node belonged to an outer surface skull point, whilst a negative product indicated the node belonged to an inner skull point. The thickness of the ROI was thus determined as the average value across the minimum Euclidean distance between each node of the outer surface and all nodes of the inner surface. The ROI whole skull thicknesses for each head model are presented in table 1.
2.2. Conductivity assignment
The existing literature was extensively searched for all papers reporting both skull conductivity and participant age. From these values, skull conductivity was modelled as a function of age based on three existing datasets found: Gonçalves et al [26, 52], Antonakakis et al [9], and Hoekema et al [25]. These papers were chosen as they were the only studies to report both participant age and skull conductivity, measured at body temperature, for at least five values, whilst also revealing a relationship between age and conductivity. These studies were deemed accurate based on a sound method employed in a previous study [5], which accounted for methodological and standardised error using an extensive checklist. Therefore, the three chosen papers were regarded as representative values of skull conductivity in the literature, the differences between them further highlighting conductivity variation. To extract these three studies, five was chosen as the minimum number of measurements presented so a function was able to be determined with the available data. Measurements from each dataset were separately employed to model aging skull conductivity, as the same method was used within each study. This allowed us to consider deviations between values to be due to participant demographics rather than methodology. In addition, these papers represent values measured by the three most employed methodologies (EIT, E/MEG and directly applied current), again enabling thorough representation of possible conductivity measurements throughout the literature. Gonçalves et al [52] utilised two different techniques, EIT and E/MEG. For comparison purposes and to avoid discrepancies due to methodology (as previously stated), values extracted with electrical impedance tomography (EIT) only were included. An additional paper found from Dabek et al [53] was not included to model the relationship between age and skull conductivity, as they revealed no clear dependencies on age (see Discussion). Each value was assigned a weight, reflecting a quality assessment outlined in a recent meta-analysis [5]. This considered both the systematic and random errors within each paper to allocate an accuracy confidence for each value. All values and their respective weights are available on the GitHub page https://github.com/Head-Conductivity/Human-Head-Conductivity. Two outliers were excluded from the Antonakakis et al dataset as the authors reported them as outliers in the original paper [9] and they were at more than two standard deviations from the mean.
Following the removal of outliers, for each of the three datasets, an exponential model of the mean as a function of age was determined. An exponential function within the Curve Fitting toolbox of Matlab was employed to fit a mean exponential curve for all values of each dataset. Each value was weighted according to [5] and thus accounted for limitations in methodology or variation within the extracted paper. Alongside this, a corresponding range that incorporated the majority of all recorded values was estimated (figure 1). This was considered as an average minimum and maximum range for each dataset using all presented conductivity values. An exponential curve was similarly fitted, as described above, but amended to incorporate all values from each dataset and thus represent a range falling between the two exponential fits. One value from the Antonakakis et al dataset fell outside of the exponential range, however, was incorporated in the generation of the model and exponential fit (see figure 1(b)). This was the only value that did not fall within the computed minimum and maximum range of conductivity values, for all the datasets. The exponential model was considered a best fit of the provided data. It ensures non-negative values and follows the described literature where conductivity is theorised to decline more rapidly from birth to adolescence and then slower [54]. An exponential relationship was also utilised by Wendel et al [55] from Hoekema et al's [25] measurements. This function provided the distribution of skull conductivity with age for each corresponding dataset. The resultant function (see figure 1) for each dataset was thus termed 'proposed age-appropriate skull conductivity' for the remainder of the current paper.
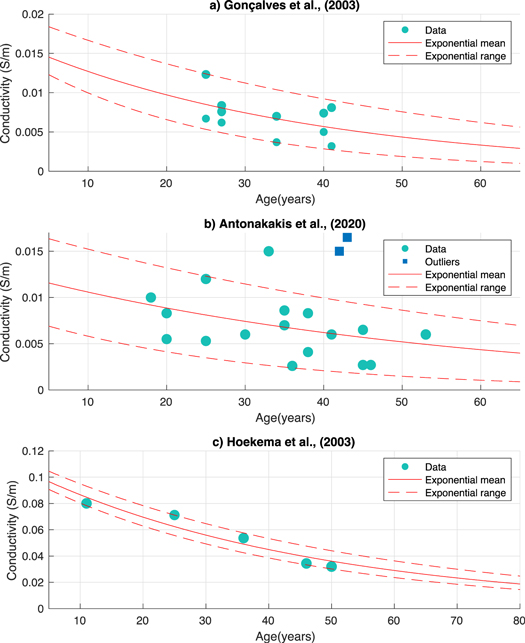
Figure 1. Distribution of skull conductivities according to the Gonçalves et al (1.a), Antonakakis et al (1.b) and Hoekema et al (1.c) datasets. Circles represent values from the respective papers, whilst squares are outliers as identified by the corresponding publication. The solid red line signifies the weighted exponential mean, whilst the dashed line denotes the weighted range (minimum and maximum) incorporating all values.
Download figure:
Standard image High-resolution imageThe SimNIBS software uncertainty quantification (UQ) was used to determine divergences in the tDCS induced electric field due to variation in conductivity (uncertainty parameters). This software makes use of the generalised polynomial chaos (gPC) expansion. Briefly, the UQ quantifies the uncertainty of input variables (conductivity) using a probability distribution. A polynomial representation of the output variable (i.e., the electric field), given the input variable (conductivity), was computed using the gPC expansion. An adaptive approach allows for fast convergence, where the iteration stops when a tolerance is reached. The error at each iteration step was evaluated using a K-means cross validation scheme (for a detailed explanation of the UQ see [12]). The UQ input variable was informed by the three conductivity distributions determined from each database. Minimum and maximum (given that the available data do not allow to make further assumptions) values were firstly extracted from the exponential fit range (as discussed in section 2.2) for each age (see table 1). These ranges were then utilised as the minimum and maximum parameters for a uniform conductivity distribution (input variable) in the UQ. These are thus referred to as 'proposed age-appropriate skull conductivities'. These values are an approximation of variation in skull conductivity as a function of age, according to three chosen datasets.
The UQ was calculated for the automatic standard simulation as provided in SimNIBS for motor cortex tDCS stimulation. This was to provide a frequently employed protocol that would thus represent and be transferable to many stimulation studies. This is using a 5 × 5 cm2 anode placed over C3 and a 5 × 7 cm2 cathode placed over AF4, the right supraorbital region (the mostly commonly used electrode size in experiments [56]). The placement of these electrodes was visually checked using the SimNIBS GUI to ensure the location on head models were as expected. Four different intensities were utilised for all UQ simulations and ages: 0.5, 1, 1.5, and 2 mA.
2.3. Experiments
Two sets of UQ tDCS simulations were carried out. The first employed the proposed age-appropriate skull conductivity ranges with all other tissues fixed. The second also utilised the proposed age-appropriate skull conductivity ranges but with scalp, GM and WM also varied and CSF conductivity fixed. Three final simulations, not using UQ, were conducted where all tissue conductivities had a fixed value. All simulations were carried out on each age atlas and for all four intensities. Each experiment is outline in more detail below.
For the first set of simulations, the proposed age-appropriate skull conductivity ranges for each of the three datasets were employed as the UQ input variable. The electrical conductivities of the scalp, CSF, GM and WM were fixed to 0.4137, 1.7358, 0.3787 and 0.1462 respectively [5]. These were the weighted mean measurements as assigned in [5] and provided in the GitHub page in section 2.2 and were therefore regarded as the most appropriate values within the available research. This first experiment elucidates the effect that changes in skull conductivity alone, according to participant age, has on tDCS induced electric fields, when all other tissue conductivities are fixed.
The second set of UQ simulations were conducted using the proposed age-appropriate skull conductivity values for each dataset and fixed CSF conductivity (1.7358 S m−1, as above), but with differing scalp, GM, and WM values. These were assigned as uniform distributions with minimum and maximum values from [5] using the same methodology as described in the UQ of section 2.2. Any deviation between values was therefore more likely to be due to participant variation rather than methodology. The ranges (as provided by EIT methods) were 0.25–0.42, 0.22–0.29, and 0.16–0.23 s m−1 for scalp, GM, and WM, respectively. CSF conductivity was fixed as it has been revealed to minimally deviate between participants [5, 57]. The second experiment aimed to show the effect that the proposed age-appropriate skull conductivity has on tDCS induced fields, whilst soft tissue is also unknown (a more realistic representation). As deviations in soft tissues are identical across all ages, any significant differences between ages would therefore be attributed to changing skull conductivity and head geometries.
The final three, non-UQ simulations utilised non-age-appropriate skull conductivities recommended in the literature: 0.0055 s m−1 [8], 0.01 s m−1 [58], and 0.016 S m−1 [5]. All other tissues were assigned the weighted mean from [5], as above. The results from these simulations allowed comparison to the previous two UQ simulations and thus highlighted the importance of adjusted and realistic conductivities for the most accurate representation. Differences between peak fields utilising the three standard skull conductivities (remaining stable for all ages) and the proposed age-appropriate model also allowed disentanglement of geometry and conductivity.
2.4. Analysis
For each age atlas, tDCS intensity and conductivity configuration, 1000 UQ calculated values were randomly extracted of the peak electric field at the 99th percentile in GM (measured in V m−1). The 99th percentile was chosen as the representative value of the peak field most commonly employed in the literature [13, 38], which displays the average of the peak field used (i.e., between the 95% and 99.9% percentile). This was repeated for GM volume (measured in mm3) with an electric field greater than 75% of the peak value (referred to as focality [47]). A skipped Pearson correlation analysis was carried out to explore any significant relationships between age and peak field or focality, as well as with CSF, GM and WM volumes. This is a non-parametric method, accounting for heteroscedasticity effects, as part of the Robust Correlation Toolbox [59]. The significant alpha level was set to 0.05 (p < 0.05 accepts the true hypothesis). Differences between these extracted values for each age atlas and conductivity configuration were determined using an analysis of variance (ANOVA; [60]). The p-values for both correlational analysis and ANOVA, were adjusted for multiple comparisons using the Benjamin-Hochberg false discovery rate (FDR) method, with the critical value equally set to 0.05 [61].
To determine which tissue's conductivity variation contributed most to the electric field uncertainty, the magnitudes of the global derivative-based sensitivity coefficients were calculated. The global derivative-based sensitivity coefficients quantify the average change in electric field with respect to each tissue's conductivity variation. They are calculated by means of the gPC coefficients and the respective basis functions' partial derivatives. The sensitivity coefficients are provided as an outcome variable within the UQ analysis. Further details on their determination can be found in [13]. The respective sensitivity coefficients of peak fields at the GM 99th percentile were calculated according to scalp, skull, GM and WM conductivity variation for each dataset and tDCS intensity. Coefficients were extracted as the respective absolute magnitude for the 99th percentile for each tissue. These sensitivity values were thus an evaluation of the sensitivity of electric field deviation due to varying tissue conductivity. Any differences between the sensitivity coefficients according to tissue type were determined by employing ANOVA and skipped Pearson correlation analysis, corrected for multiple comparisons (as in the method described above). This allowed determination of the most influential tissue for deviation in tDCS electric field with respect to changes in participant age and stimulation intensity.
3. Results
3.1. Head models
Following the assessment of head mesh quality, the original head model for the 10-year-old atlas was seen to generate thicker scalp regions than the MRI. This was manually corrected by employing a higher threshold for scalp segmentation, before the surface and volume meshing step of 'headreco' [46]. All resultant final overlayed meshes were accurate compared to the MRI (figure S1), and all volumes were as expected, i.e., there was no cortical smoothing, large CSF areas, or otherwise irregular appearances. Head meshes for all atlases are provided in figure S2. Electrode placement on the head models was also deemed normal and not impeded by scalp segmentation. Brain volumes were also calculated for the original MRI atlases to assess the ability of age-appropriate templates to represent previous findings of the aging brain (see table 1). Before tDCS simulation, the brain volumes in the current study were assessed for normality as presented in previous literature [60–67]. All volumes were found to be within the normal ranges as reported in the literature, a thorough discussion of this comparison can be found in section 4.1.
3.2. Peak fields
A negative correlation between tDCS induced electric peak fields at the 99th percentile and age using solely proposed age-appropriate skull conductivity was revealed for all tDCS intensities and datasets. The average skipped Pearson, r, correlation for all intensities was −0.9060, −0.8578 and −0.9544 for the Gonçalves et al, Antonkakis et al and Hoekema et al datasets, respectively (see figures 2(a), (c) and (e)). The correlational p-value was significant following multiple comparison correction. For all datasets, there was additionally a significant difference (one-way ANOVA p < 0.001 for all, after multiple comparison adjustment) and positive correlation between peak field and intensity for all ages. This decreased with age (see figures 2(a), (c) and (e); r > 0.82, r > 0.80, and r > 0.99 for Gonçalves et al, Antonakakis et al, and Hoekema et al datasets, respectively, for all ages). On average for the Gonçalves et al dataset (for all intensities) peak fields decline by a factor of 0.7806 per decade. As an example, peak fields for a 60-year-old atlas were analogous to peak fields in a 10-year-old atlas using triple the stimulation dose (1.5 mA in 60 years versus 0.5 mA in 10 years). For the Antonakakis et al dataset, peak fields typically decayed by a factor of 0.7985 per decade. Here the peak field for a 10-year-old was comparable to that of a 60-year-old when employing one third of the dose (0.5 mA to 1.5 mA for 10 versus 60-year-old atlas). The decline per decade for the Hoekema et al dataset was reduced with a factor of 0.8892, and similar peak fields for a 10-and 60-year-old employing twice the intensity (0.5 mA versus 1 mA and 1 mA versus 2 mA). Across all three dataset the average decline per decade was thus 0.82.
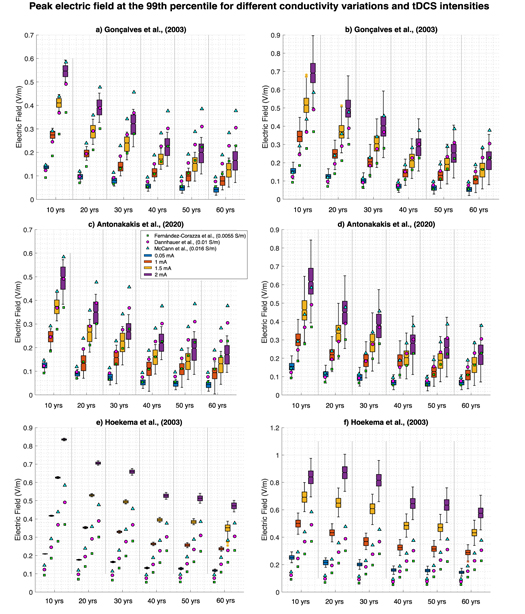
Figure 2. Variation in peak electric fields at the 99th percentile depending on tDCS intensity and subject's age. Figures 2(a), (c) and (e) display electric fields where proposed age-appropriate skull conductivity was varied alone and all other head tissues remained at the mean value, for the Gonçalves et al, Antonakakis et al, and Hoekema et al datasets, respectively. Figure 2(b), (d) and (f) show electric field where the skull conductivity was varied within proposed age-appropriate values and the remaining head tissues were varied in a stable way across ages, for the Gonçalves et al, Antonakakis et al, and Hoekema et al datasets, respectively. All boxplots show the minimum and maximum values (extended lines), where the filled box is the inter-quartile range and notch is the medium. Blue, orange, yellow and purple show results for tDCS intensities equal to 0.5 mA, 1 mA, 1.5 mA and 2 mA, respectively. Filled green squares, magenta circles, and blue triangles display the singular peak field value when head tissues are the mean value and skull conductivity is 0.0055 S m−1, 0.01 S m−1, and 0.016 S m−1, respectively (taken from the cited literature).
Download figure:
Standard image High-resolution imageThere were additionally significant differences between the three standard and proposed age-appropriate skull conductivities for all datasets with age (one-way ANOVA p < 0.001 for all, after multiple comparison adjustment). Dissimilarities increased with age for the Gonçalves et al and Antonakakis et al datasets and decreased for the Hoekema et al dataset (see figure 2 for comparisons). These disparities are a direct result of conductivity variation, rather than variation in head geometry. For head geometry, there was a significant negative correlation between CSF volume and peak field for all datasets and tDCS intensities as well as a positive significant correlation between GM volume and peak fields. No correlation was revealed for WM volume percentage. Furthermore, no significant correlation was revealed between peak field and skull thickness when including all age ranges. However, as skull thickness linearly declined for ages atlases 20–60 (where, thickness for the 10-year-old atlas was significantly lower, not higher than the 20-year-old atlas), an additional analysis was conducted excluding the 10-year-old data. These results revealed, for age atlases 20–60, significantly positive correlations between skull thickness and peak field for all intensities and datasets (average for all intensities, r = 0.83775, 0.6742 and 0.9146 for the Gonçalves et al, Antonakakis et al and Hoekema et al datasets, respectively).
Comparable results were revealed using proposed age-appropriate skull conductivities and GM, WM, and scalp varied identically across ages. For all datasets, there was a negative significant (following multiple comparison correction) correlation between peak fields and age for all intensities (average r = −0.8759, r = −0.7984 and r = −0.8753 for the Gonçalves et al, Antonakakis et al, and Hoekema et al datasets, respectively; figures 2(b), (d) and (f)). Alongside this, a significant difference between intensities and peak fields was found for all ages (one-way ANOVA p < 0.001 for all, following multiple comparison correction). This, again, decreased with age (skipped Pearson correlation r > 0.80, r > 0.75, and r > 0.97 for the Gonçalves et al, Antonakakis et al, and Hoekema et al datasets, respectively, and all ages). Correlations for both age and intensity were of the highest significance for the Hoekema et al dataset and lowest for the Antonakakis et al dataset (see figure 3). Correlations employing both varied skull and head tissue conductivities were marginally lower than varied skull conductivity alone for all datasets (see figure 3).
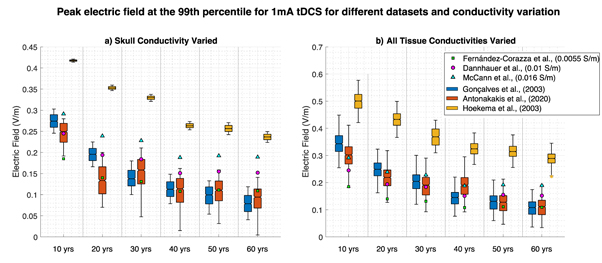
Figure 3. Variation in peak electric fields at the 99th percentile for 1 mA tDCS for varying ages, datasets and electrical conductivities. Figure 3(a) represents peak values where proposed age-appropriate skull conductivity was varied alone and all other head tissues remained at the mean value, for the Gonçalves et al (blue), Antonakakis et al (orange), and Hoekema et al (yellow) datasets. Figure 3(b) shows peak fields with proposed age-appropriate varying skull conductivity all other head tissues varied as stable across ages for the aforementioned datasets. Filled green squares, magenta circles and blue triangles display the singular peak field value when head tissues are the mean value and skull conductivity is 0.0055 S m−1, 0.01 S m−1 and 0.016 S m−1, respectively (taken from the cited literature).
Download figure:
Standard image High-resolution imageSignificant correlations were revealed between age and the sensitivity coefficients for the scalp, skull, GM and WM (p < 0.001 for all datasets and intensities, corrected for multiple comparisons). Figure 4 shows the sensitivity coefficient magnitudes at 1 mA tDCS. Values and subsequent correlations were similar for all four employed intensities. Skull conductivity deviation became the most significantly influential tissue with increasing age for the Gonçalves et al and Antonakakis et al datasets. There was a positive correlation between age and the sensitivity of the skull to peak field deviation, weaker for each respective dataset (skipped Pearson correlation average for all intensities, Gonçalves et al: r = 0.82145, Antonakakis et al: r = 0.5063 and Hoekema et al: r = 0.9387). Furthermore, a negative relationship was revealed between age and WM sensitivity (average for all intensities; Gonçalves et al: r = −0.8001, Antonakakis et al: r = −0.7320, Hoekema et al: r = −0.5978). This was repeated for GM sensitivity (for all intensities average; Gonçalves et al: r = −0.7834, Antonakakis et al: r = −0.7432, Hoekema et al: r = −0.5867) and scalp sensitivity (average for all intensities; Gonçalves et al: r = −0.8604, Antonakakis et al: r = −0.8051, Hoekema et al: r = −0.7472). Uncertainty in skull conductivity was the most influential tissue in the Antonakakis et al dataset and became the most influential for atlases over 30 years in the Gonçalves et al dataset.
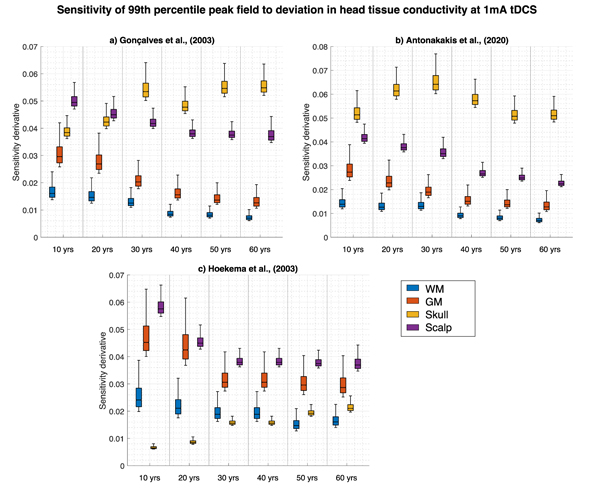
Figure 4. Global derivative-based sensitivity coefficient magnitudes of 1 mA tDCS induced electric field change at the 99th percentile with respect to deviations in WM (blue), GM (orange), proposed age-appropriate skull (yellow) and scalp (purple) conductivity for each age atlas. Figures display simulations employing the Gonçalves et al (4a), Antonakakis et al (4b) and the Hoekema et al (4c) datasets.
Download figure:
Standard image High-resolution image3.3. Focality
Figure 5 displays the GM volume (mm3) with an electric field greater than 75% of the peak value (i.e., focality) for different conductivity configurations, simulated at 1 mA tDCS. As can be seen, a significant difference was revealed between GM volume at different ages. This was across all three datasets and all four intensities when skull conductivity alone was varied (one-way ANOVA, p < 0.001 for all). The correlational analysis was insignificant. No differences were found between different intensities for any dataset or age. When skull and other head tissues were varied, focality significantly differed between ages for all datasets and intensities (one-way ANOVA, p < 0.001). There was a significant negative correlation between focality and age (identical for all intensities) for the Gonçalves et al and Antonakakis et al datasets (skipped Pearson correlation: r = −0.7531 and r = −0.8023, respectively). No differences were found between different intensities for any dataset or age. All intensities yielded the same GM volume when proposed age-appropriate skull and all other head tissue values were constant. Furthermore, no significant correlation was revealed between peak field and skull thickness when including all age ranges. However as in section 3.2, an additional analysis was conducted excluding data from the 10-year-old age atlas. Significantly positive correlations were thus revealed between skull thickness and focality solely for the Gonçalves (r = 0.7010) and Antonakakis (r = 0.8081) dataset (identical for all intensities).

Figure 5. Variation of GM volume with an electric field greater than 75% of the peak value for 1 mA for varying ages and conductivity values. Blue boxplots represent values where only proposed age-appropriate skull conductivity was varied for each dataset (5a)–(5c), whilst orange boxplot show simulations where both proposed age-appropriate skull ranges were utilised with all the head tissues varied as stable with age. Filled green triangles, magenta circles, and blue squares display the singular peak field value when head tissues are the mean value and skull conductivity is 0.0055 S m−1, 0.01 S m−1, and 0.016 S m−1, respectively (taken from the cited literature).
Download figure:
Standard image High-resolution image
4. Discussion
The current study revealed a significant negative correlation between atlas age and peak fields for simulated tDCS stimulation. This was mediated by proposed age-appropriate skull conductivity, irrespective of whether all other head tissue conductivities and tDCS intensity were varied. Deviations in skull conductivity were found to become the most influential tissue for peak field changes with increasing age for two datasets (Gonçalves et al and Antonakakis et al). Significant differences were also shown between tDCS focality and atlas age. However, there were only significant correlations when other head tissues were also varied (but stable across age). Focality increased (corresponding to lower GM volumes) with increasing age following scalp, GM and WM conductivity variation for two datasets (Gonçalves et al and Antonakakis et al). These results suggest skull conductivity, indicated to decline with age, is vital when modelling tDCS induced fields and these deviations should be accounted for. Such changes could account for varying clinical outcomes and suggest tDCS dose should be individualised and adjusted for age.
4.1. Atlas justification
Our atlas volumes corresponded with individual MRI volumes from the existing literature. Our results specifically revealed GM volume linearly decreased, whilst WM remained relatively stable with age, with slight decrease for the youngest and eldest atlases. This is comparable to previous research, where GM generally decreased with age, falling within 0.4–0.9L [62–71], whilst WM displays a 'bell-shaped' curve, ranging between 0.3–0.7 L [62–64, 66] and 'peaking' within the fourth decade [64, 66]. Moreover, CSF volume within our atlases was revealed to increase with age for which there is a multitude of support from the literature, where volumes have been reported to vary between 0.2–0.6 L [64, 67, 69]. Moreover, the use of atlases has previously been established in neuroimaging research, allowing capture of the population mean and variance as a function of age [69]. Atlases or templates have been utilised, for example, in MEG network analysis, revealing consistent results compared to using individual MRI [70]. Additionally, the Neurodevelopmental database utilised in the current study was recently employed and validated to build structural templates for use in infant cortical EEG [69]. This is in addition to recent use individual modelling with age in a tDCS computation [39] and t-PBM [45]. Head atlases have also been applied to represent average brains and determine tDCS parameters and responses that can generalise to a population. For example, a FE head model was created from a standard brain atlas to establish optimal tDCS positions [72]. Standard templates were additionally produced from multiple MRI's from participants of varying races, in order to determine the effect of race on tDCS current flow [73]. Although it is noted the use of head atlases has disadvantages, for example the blurring of sulci and gyri and smoothing of tissue interfaces, particularly at the pial surfaces. Despite this, templates are able to provide generalised information that is not due solely to individual differences between participants. The smoothing of the utilised atlases was also considered minimal. The inspection and comparison of our atlases to previous literature demonstrate the integrity of the provided head models and justify their use in the present tDCS simulation study.
4.2. Age and peak induced fields
The current results are in support of previous research from multiple participants. For example, using grouped ages, higher peak fields have been revealed in children, declining in adolescence and adulthood [37, 38]. This is in addition to findings of higher peak fields in young compared to older adults [38, 74]. Furthermore, a slight negative correlation for peak electric fields was displayed between the ages 21 and 55 [75]. Importantly, the discussed papers [37–39] have noted a limitation of their results is the exclusion of proposed age-appropriate skull conductivity values, which may exacerbate any relationship, as revealed in the current study. By including a range of ages across the lifespan, we were able to conclude results as correlational, rather than mere differences between pooled groups of ages. Likewise, we were able to assess induced field variation as being directly due to proposed age-appropriate skull conductivity deviations. As hypothesised, the decrease in skull conductivity, irrespective of scalp, GM and WM conductivity diversity, mediated the decline in peak electric fields with age. Not only was this effect not masked by other head tissue variability but remained for all tDCS intensities. Alongside this, changing scalp and skull conductivities, not accounting for age, has yielded similar electric field deviations across different tDCS montages [51]. This suggests our results can be applied to differing electrode placement parameters.
The significant correlation between the three standard and varying proposed age-appropriate skull conductivity values (varied alone and alongside soft tissue) revealed that most of the electric field uncertainty is a direct result of aging skull conductivity. As changes in skull conductivity were the only varying factor, this variability was concluded not to occur due to head geometry alone (see figure 2). From these results, differences were found to increase with age for the Gonçalves et al and Antonakakis et al datasets and decreased for the Hoekema et al dataset. Head geometry, nevertheless, exacerbated these findings. The opposing correlational effect for the Hoekema et al dataset is due to considerably higher conductivity values for the skull, compared to the three standard values and other datasets. This means that the decrease with age approached standard conductivities for Hoekema et al but deviated away for Gonçalves et al and Antonakakis et al. Our results additionally revealed skull conductivity to be of increasing importance with increasing age for peak field variation (see figure 4). This result was as expected as a more highly conductive skull, for younger participants, would allow more tDCS current to reach the brain and in turn increase electric fields. This effect is heightened in combination with geometry, e.g., paediatric skulls being considered significantly thinner than adult skulls [8, 37, 76]. As such, our current results equally revealed significant correlations with skull thickness and induced field, when the 10-year-old age atlas was excluded for analysis. This atlas, being from a paediatric population, had reduced skull thickness, as expected [8, 37, 76] due the skull still undergoing development. Therefore, correlational analysis was conducted for atlases 20 years and older. The resultant significant correlation between thickness and induced fields is indicative skull geometry may play a role in tDCS application. However, as induced fields were significantly correlated across all age ranges (10-years included), this parameter is not the sole contributor to deviating results. Skull thickness remains an important inclusion, particularly when considering how conductivity may vary. Previous research [9] has revealed, for example, skull thickness to positively correlate with conductivity, which is supported by [19]. Furthermore, a non-significant negative correlation between thickness and participant age was found [9] and it was mentioned skull thickness increases exponentially from birth to adolescence [77] then linearly decreases over time [78]. Hence, determining a clear and robust relationship requires essential further research. Skull thickness is therefore expected to play an imperative role in conductivity variation, particularly with age. Future studies should attempt to disentangle this relationship and provide additional conductivity data to allow for assumptions, such as correlation with age.
Brain tissue volumes also differed according to age template. This is reinforced by the significant relationship between induced fields and CSF and GM volume and the negative correlation between age and brain tissue sensitivity to field changes. Paediatric brains contain comparably less CSF than adults, which is supported by our head models. In these cases, current is less efficiently conducted via CSF, permitting a higher intensity of the remaining field. Moreover, children with lowered CSF have smaller extra-axial CSF space and shorter scalp to skull distances [39, 79, 80]. This may result in higher peak electric fields and increased current spread as a larger proportion of stimulated current is penetrating the brain and in part due to lessened electrical current shunting. This is thus hypothesised to increase induced fields under the tDCS electrodes [36]. Our results are enhanced by Laakso et al [75] who revealed reduced peak electric fields with age due to a positive correlation between age and CSF volume. They considered this a measure of brain atrophy. Following from this, an increased number of brain lesions is expected with age, which would further contribute to differing tDCS induced fields. The impact of lesions and their conductivity was beyond the scope of the current paper. Future studies, however, could incorporate lesions into field modelling, including conductivity estimates. Likewise, Ciechanski et al [37] suggested that declining GM-WM ratio with age, irrespective of any changes in their conductivity, may relate to tDCS induced field fluctuations. This was in addition to the contribution of alterations in WM microstructure and myelination processes. Future research could explore the influence diffusion characteristics, expected to change with age [67, 81], on tDCS induced fields.
The current research further elucidated the relationship between tDCS dose and age. Peak fields were approximately triple in the eldest (60 years old) compared to the youngest atlas (10-years-old) when dose was kept constant. Generally, peak electric fields following 0.5 mA in the youngest atlas was comparable to 1.5 mA in the oldest atlas. Our results are supported by previous similar studies. For example, stimulation intensity for adult ADHD treatment (2 mA, 0.8 V m−1) was double that required in children to produce similar electric fields (1 mA, 0.6 V m−1 [82]). A 0.7 mA in a 10-year-old with perinatal stroke additionally produced a peak brain current intensity equivalent to an adult receiving 1 mA [72]. Deviations in skull conductivity for this study [72], however, were not taken into consideration. Our results demonstrate the effect of variable skull conductivity is not minimal and exacerbates relationships between head geometry and induced tDCS fields.
In addition, experimental studies have evidenced the effect of age on clinical and research outcomes. For tDCS motor cortex stimulation, elderly participants (older than 60 years old) responses were delayed [83] or differed [84] to younger participants (younger than 25 years old). Furthermore, anodal stimulation over the dorsolateral prefrontal cortex (DLPFC) in adolescence increased pain perception, whereas stimulation over the motor cortex using the same intensity increased pain threshold in adults [85]. The authors suggested age as a central mediator for the tDCS response, providing an explanation for differing treatment outcomes for identical stimulation parameters. Importantly, their results support previous findings that intracortical inhibition increases with age [82]. Moliadze et al [35] revealed 1 mA cathodal tDCS produced a facilitating brain function in children, originally hypothesised to reduce cortical excitability (where anodal stimulation would increase excitability [35]). They suggested a 'ceiling effect' may exist that cannot be overcome by higher tDCS intensity. The proposed 'ceiling effect' threshold is dependent on age and therefore identical stimulation intensities may initiate long-term depression changes in adults, but long-term potentiation changes in children. In order to ensure comparable research and clinical outcomes across ages, it may be essential to individually adjust dosages.
The present study revealed an average scaling factor (between all three proposed age-appropriate skull conductivity datasets) of 0.82 per declining decade for induced peak fields. Datta et al [4] explored the effect that variation in head geometry has on peak electric fields and thus how doses can be normalised. They suggested the simplest approach would be to scale dosages according to peak electric fields, accounting for variation as a result of head geometry. Our results combine the influence of head geometry with skull conductivity to provide a suggestive scaling factor of 0.82 to tDCS dose per increasing decade. However, this value is arbitrary and still ensues large uncertainties, more evident across vastly different head models, and is merely a suggestive value. Additional research is essential to determine how to accurately adjust tDCS dosages and montage application for treatment optimisation.
In addition, future research is imperative to fully understanding the relationship between conductivity, electric fields and tDCS parameters [85]. A recent study, for example, revealed the current propagation from the scalp to the brain was unaffected by skull conductivity changes [86]. This was found to be due the concept of 'skull-transparency', where using specific current injection patterns without a priori skull conductivity values did not result in large induced field errors, as expected. Instead, they depended on the distance from the injection to the source and areas with high spatial frequency. This would be one solution to tDCS injection parameters without accounting for changing head conductivity. However, further research is required in this area and would be useful for tDCS treatment and research. Furthermore, a recent study also utilising gPC analysis, revealed uncertainty in scalp and skull conductivity significantly impact EEG inverse solutions [87]. This suggests the underlying relationship between electric current and skull conductivity is not minimal and can be extended to work in EEG. Further research could also employ analogous tDCS and EEG monitoring to explore such a relationship.
5. Age and focality
The current paper revealed no relationship between focality and age except when scalp, GM and WM conductivities were varied alongside proposed age-appropriate skull deviations. This result is as expected as focality has previously been hypothesised to depend on head geometry and GM/WM composition, rather than the contribution of skull conductivity [8, 51, 75, 88]. In support of this, the current study revealed a significant relationship (when excluding the 10-year-old atlas) between skull thickness and focality for two datasets (Gonçalves et al and Antonakakis et al). This suggests skull geometry, particularly thickness, potentially plays a larger role in tDCS focality than skull conductivity, more so than for tDCS field strength. The lack of correlation for all ages however, suggests (as discussed in section 4.2) skull thickness alone cannot account for tDCS variations (both focality and strength). A recent study confirmed the contribution of skull geometry, not conductivity, to focality, revealing changing scalp and skull conductivities had a greater effect on electric field magnitude than distribution [51]. This may also explain why a relationship was revealed when scalp, GM and WM conductivities were varied as these simulations allow for larger overall deviation and an increased likelihood of finding an effect. Mikkonen et al, [88] for example, found no variation in focality due to tDCS intensity, supporting the current results, but deviations in focality depending on tDCS montage, more specifically the size of the employed electrodes. Variation in electrode size was beyond the scope of the current paper, however future modelling studies may explore how tDCS montage in combination with age-appropriate geometry and conductivity affect focality.
5.1. Limitations
One limitation of the current study is that bone composition in the skull was not taken into consideration. Spongiform bone, more highly conductive than compact bone, is typically increased in thicker skull regions, which could increase tDCS induced field strengths [8]. The present study, however, did not to include spongiform conductivity as a varying factor as the current software (SimNIBS, the most frequently employed software [10], and ROAST [11]) are unable to automatically represent marrow segmentation. The majority of papers exploring tDCS electric fields do not account for marrow tissue, inclusion of which in our study would therefore not be representative of the current standard [10]. The aim of the present study was to explore tDCS induced fields in a way frequently employed and thus the most standard software was utilised and deemed appropriate for the current simulations. Furthermore, for accurate spongiform and suture segmentation, additional imaging information, such as that obtained through CT, is required, but often unavailable for brain stimulation treatment and research [8]. It is acknowledged, however, that segmentation is possible through MRI data (for example in [9]) and could be utilised in further studies. Nevertheless, segmentation stemming from MRI methods are dependent on water content and thus would present variable results according to spongiform bone composition. The current paper allows evaluation of skull conductivity variations when employing the simplifications most frequently used. Nonetheless, the impact of spongiform bone and skull sutures are important and additional information and modelling should be examined in the future.
Further to this, the meninges and blood vessels (most commonly segmented as CSF) may also impact tDCS induced fields, although to a lesser degree, and have been neglected in the current study [89]. For example, accounting for differing conductivity of the dura in tDCS simulation improved correlational accuracy with intracranial recordings [89]. Similarly, errors caused by neglecting blood vessels in EEG source analysis (employing similar underlying electrical biology as tDCS) were analogous to omitting CSF conductivity [90]. Following from this, CSF is frequently overestimated within the brain compartment (i.e., segmenting the meninges as CSF) and near the skull boundaries, notably of the occipital lobe, where the brain should contact the skull [89]. This is particularly evident for FEM modelling employing tetrahedral meshes, as in the current study, which typically overestimate CSF perimeters. Moreover, tetrahedral meshes may be prone to errors due to bad quality elements if not appropriately treated [91]. It is acknowledged that omitting segmentation of the meninges, blood vessels and not accounting for CSF overestimation may have impacted tDCS induced fields. Future studies could thoroughly check and enhance the quality of tetrahedral meshes or employ hexahedral domain discretisations and further analyse the effect such CSF overestimation, alongside accurate segmentation of the meninges and blood vessels has on tDCS. This may have a greater impact as a function of age, particularly considerating vast variation in CSF volume with age.
An additional limitation is that the utilised proposed age-appropriate conductivity ranges are based on limited data from the literature and do not accurately depict how skull conductivity changes with age. The existing literature was extensively searched for papers explicitly reporting skull conductivity and participant age. However, only papers reporting more than five measurements and where a relationship with age could be extracted were included. Consequently, not all skull electrical conductivities were represented, which may influence the resultant correlation with age. Despite reporting more than five values, Dabek et al [53] were excluded due to no relationship with age being stated and their utilised method (EIT) being represented from the Gonçalves et al dataset. More research, however, is essential to accurately determine the relationship of skull conductivity with age. Furthermore, values extracted from the Hoekema et al database were considerably higher (up to 10-fold) that those found in all other literature [5] and may skew results from this database. For example, the resulting peak fields stemming from Hoekema et al's proposed age-appropriate skull conductivities have a smaller range compared to the Gonçalves et al and Antonakakis et al datasets. The contribution of skull conductivity uncertainty to peak field changes is also lower for Hoekema et al versus the remaining two datasets. Both of these discrepancies are suggested to be due to a lower relative difference between skull conductivity values within the UQ simulations. Therefore, all effects are dimmed. Furthermore, the considerably higher conductivity measurements for the Hoekema dataset may be due to the fact measurements were acquired in vitro, compared to under in vivo conditions. Consequently, skull conductivity values may decay with time away from the biological host, as well as the influence of temperature. However, similar in vitro methods have been employed (for example in [19]) and conductivity values found within a similar range to the Antonakakis et al and Gonçalves et al datasets. Equally, the methodology in Hoekema et al was previously assessed and considered reliable [5]. Irrespective of the deviations, due to an identical method being employed for Hoekema et al's extracted measurements, any deviations were appointed to be due to participant demographics and therefore reliably depict how induced fields may change with age. This is thus irrespective of the particular skull conductivity values. Furthermore, it is noted that the calibrated bulk conductivity values extracted from Antonakakis et al are redefined based on a fixed compact and spongiform bone conductivity ratio (according to [92]). Compact bone was estimated from the procedure and spongiform conductivity assigned following a fixed ratio to calibrate whole skull conductivity. Therefore, Antonakakis et al accounted for differing bone composition conductivity and geometry within their whole skull estimations, which the other papers did not, making comparisons between the three methodologies incomplete. However, three methods under differing conditions were chosen to elucidate the variability within the literature and to represent the resultant changing tDCS induced fields. This was, firstly, as a hypothesised function of age (as shown by variability within the results for each dataset) and secondly, due to chosen methodology and skull conductivity values from the literature (shown by the variability between datasets). Nonetheless, supplementary research to determine the influence age has on skull conductivity, particularly of the layered skull, is essential.
Additional values would be imperative to understanding induced tDCS fields for participants beyond the ages discussed here. It is hypothesised that peak field would decay further for older ages, particularly in combination with brain atrophy and degradation and the higher likelihood of lesions.
6. Conclusion
The current study illuminated the importance of accurate and individualised head anatomy and proposed age-appropriate skull conductivity values in tDCS experiments. Induced peak tDCS field strengths were revealed to significantly negatively correlate with age for four different intensities employing three data-based proposed age-appropriate skull conductivity models. This was irrespective of whether GM, WM and scalp conductivities were additionally varied. Skull conductivity deviation was revealed to be the most important tissue with increasing age to peak field changes. Peak field also significantly negatively correlated with CSF volume and positively correlated with GM volume for all simulated parameters. An average scaling factor of 0.82 per declining decade for peak tDCS fields across all intensities and skull conductivities datasets was additionally elucidated. Precise conductivity values and individual head models taking into account participant age are therefore considered to be vital for full understanding of tDCS current propagation. Inaccuracies in both could contribute to deviations in tDCS clinical and research outcomes. Future studies are suggested to consider age when calculating tDCS dosage for paediatric and elderly participants and understanding the underlying physiological mechanisms responsible for such induced fields.
Acknowledgments
This work was supported by the Knowledge Economy Skills PhD Scholarship, Grant Number 512734.
Data availability statement
The data that support the findings of this study are available upon reasonable request from the authors.
Funding
Knowledge Economy Skills Scholarships (KESS) is a pan-Wales higher level skills initiative led by Bangor University on behalf of the HE sector in Wales. It is part funded by the Welsh Government's European Social Fund (ESF) convergence programme for West Wales and the Valleys.
Declarations of interest
None