

Abstract
Superparamagnetic iron oxide nanoparticles (SPIONs) are promising for clinical applications, because they have a characteristic nonlinear magnetic response when an external magnetic field is applied. This nonlinearity enables the distinct detection of SPIONs and makes measurements less sensitive to the human body and surgical steel instruments. In clinical applications, only a limited field strength for the magnetic detection is allowed. The signal to noise ratios (SNRs) of four nonlinear magnetic detection methods are compared. These methods include differential magnetometry and three variations of magnetic particle spectroscopy: frequency mixing, second harmonic detection and third harmonic detection. All methods were implemented on the same hardware and experimentally compared for various field strengths. To make the comparison fair, the same power was supplied to the excitation coil each time. In general, the SNR increases with increasing field strength. The SNR per drive field of all methods stabilizes or even decreases for field strengths above 6 mT. The second harmonic detection has the best SNR and the most room for improvement.
Export citation and abstract BibTeX RIS

Original content from this work may be used under the terms of the Creative Commons Attribution 4.0 licence. Any further distribution of this work must maintain attribution to the author(s) and the title of the work, journal citation and DOI.
1. Introduction
Superparamagnetic iron oxide nanoparticles (SPIONs) are used more and more in various (pre)clinical applications, such as a sentinel lymph node biopsy (Douek et al 2014, Taruno et al 2019), cancer diagnosis and therapy (Singh 2019), magnetic particle imaging (Wu et al 2019), hyperthermia (Kolosnjaj-Tabi and Wilhelm 2017) and magnetic resonance imaging (Jin et al 2014). For some applications, such as a sentinel lymph node biopsy, it is important to detect SPIONs inside the human body. Multiple handheld probes were developed to do so (Sekino et al 2018, Zada et al 2016, Waanders et al 2016, Cousins et al 2015, Karo and Sasada 2017). Figure 1 shows the use of such a probe.

Figure 1. Example of the use of a handheld probe during surgery. Transcutaneous measurements are performed to determine the location of the first incision.
Download figure:
Standard image High-resolution imageMost of these probes make use of first order (linear) magnetic detection. As a consequence, not only the magnetization of SPIONs is measured, but the measurements are also influenced by the diamagnetism of the human body and the magnetism of the surgical steel instruments. The probe developed in our research group makes use of differential magnetometry (DiffMag) (Waanders et al 2016, Visscher et al 2014). This method of nonlinear magnetic detection is specific for SPIONs. As a result, the tiny signal from SPIONs can be measured in the presence of human tissue and surgical steel instruments (Waanders et al 2016, van de Loosdrecht et al 2019).
Another advantage of DiffMag is that it allows the mechanical separation of the excitation and detection coils, which is impossible in conventional linear magnetic detection methods. The advantage of this separation is that it results in improved depth sensitivity when the size of the probe is restricted, for example in laparoscopic surgery (van de Loosdrecht et al 2019).
Besides DiffMag, magnetic particle spectroscopy (MPS) is a promising nonlinear magnetic detection method that is able to distinguish the SPION signal from the signals of the human body (Saari et al 2018, Wu et al 2019). MPS has been used to measure temperature (Wells et al 2017) and viscosity (Elrefai et al 2020), for biomolecule imaging (Zhong et al 2020) and to distinguish different SPIONs (Viereck et al 2019). There are various ways to carry out MPS, including frequency mixing (Nikitin et al 2018, Wu et al 2015, Ficko et al 2017), second harmonic detection (Jamil et al 2019, Tanaka et al 2017, Shi et al 2017, Yoshida et al 2011) and third harmonic detection (Mizoguchi et al 2016, Minard et al 2013).
Much is still unknown about the effects of exposure to low frequency electromagnetic fields (between 1 Hz and 100 kHz). However, there are risks of exposure to fields above a frequency dependent threshold. These include reversible effects on excitable cells, electric charge effects on the skin, and the stimulation of nerves and muscles (experienced as a tingling sensation). At higher levels there is the risk of irreversible cardiovascular effects and tissue burns. To avoid these negative effects, ICNIRP created guidelines for the safe use of electromagnetic fields (International Commission on Non-Ionizing Radiation Protection 2010). The ICNIRP posits a 0.12 mT maximum field amplitude for occupational exposure at a frequency of 2.5 kHz. This value is much lower than measurements on observation thresholds, which range from 7 mT for whole body exposure (Budinger et al 1991), 45 mT for stimulation of the underarm (Demirel and Saritas 2017), and up to 95 mT for stimulation of the wrist alone (Mansfield and Harvey 1993). Also, low field strengths are crucial for handheld detection to avoid heating of the probe, which might harm both the user (surgeon) and the patient.
We compared the signal to noise ratios (SNRs) of four nonlinear magnetic detection methods as a function of the excitation field strength. Clear differences between the four methods were found. We discuss the implication of this observation for clinical usability, where the maximum field strength is low.
2. Materials and methods
The SPIONs used in this paper are Magtrace® (Endomag, UK). Magtrace® is approved for clinical use; it is both CE marked and FDA approved for use in a sentinel lymph node biopsy in combination with the Sentimag® magnetometer (Alvarado et al 2019). It is a brown solution containing carboxydextran-coated SPIONs with a size of 59 nm (Pohlodek et al 2018). In all experiments, one sample containing 100 μg Fe in a total volume of 100 μl was used (in a concentration of 1 mg(Fe)/ml).
Four nonlinear magnetic detection methods are compared in this paper. These include DiffMag, and three variations of MPS: frequency mixing, second harmonic and third harmonic detection. All measurements were performed using the superparamagnetic quantifier (SPaQ) (van de Loosdrecht et al 2019) shown in figure 2. The SPaQ, including a co-axial magnetometer, enables measurements in a homogeneous excitation field. All methods were implemented with this device, as described in the following paragraphs.
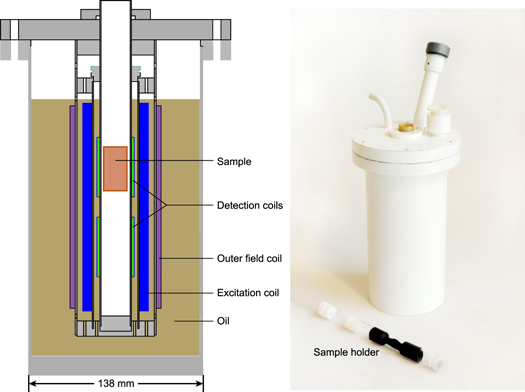
Figure 2. Schematic overview of the superparamagnetic quantifier (SPaQ). This figure was adapted from (Riahi et al 2020).
Download figure:
Standard image High-resolution image2.1. DiffMag
2.1.1. Excitation
The excitation sequence used for DiffMag consists of a continuous AC field (2525 Hz) and various DC offset fields. The sequence consists of four parts, each lasting 0.25 s: (1) no DC offset field, (2) a positive DC offset field, (3) no DC offset field and (4) a negative DC offset field, as shown in supplementary figure 1 (available online at stacks.iop.org/BPEX/7/015018/mmedia).
2.1.2. Data analysis
After data acquisition, the four parts of the DiffMag sequence are separated. A Fourier transform is taken for each part separately, as shown in supplementary figure 2. The height of the peak at the fundamental frequency is measured (P1, P2, P3 and P4) and the DiffMag signal is calculated using the following equation:

2.2. MPS: frequency mixing
2.2.1. Excitation
The excitation sequence used for frequency mixing consists of the sum of a high frequency (2525 Hz) and low frequency (30 Hz) sinusoidal field, as shown in supplementary figure 3.
2.2.2. Data analysis
After data acquisition, a Fourier transform of the complete signal is taken. As shown in supplementary figure 4, two peaks at a combination of the high and low frequencies arise due to the nonlinear behavior of the SPIONs:

The signal for frequency mixing is calculated using the following equation:

2.3. MPS: Second harmonic
2.3.1. Excitation
The excitation sequence for second harmonic detection consists of a continuous combination of an AC (2525 Hz) and DC field, which have equal field strengths, as shown in supplementary figure 5.
2.3.2. Data analysis
After data acquisition, a Fourier transform of the complete signal is taken. A clear peak at the second harmonic frequency (5050 Hz) can be observed, as shown in supplementary figure 6. The height of this peak is defined as the second harmonic signal:

2.4. MPS: third harmonic
2.4.1. Excitation
The excitation sequence for third harmonic detection consists of a continuous AC field (2525 Hz), as shown in supplementary figure 7.
2.4.2. Data analysis
After data acquisition, a Fourier transform of the complete signal is taken. A pronounced peak at the third harmonic frequency (7575 Hz) can be observed, as shown in supplementary figure 8. The height of this peak is defined as the third harmonic signal:

2.5. Measurements
All measurements were performed at an AC (in frequency mixing high frequency) field with a frequency of 2525 Hz, since this is close to the optimal particle response (van de Loosdrecht et al 2019). To make the comparison between the four methods fair, the power (the dissipation in the excitation coil, 〈I2 R〉) was kept constant for each method. The signal was measured at various powers, between 1 and 15 W. The corresponding field strengths for each method are shown in figure 3 and in supplementary table 1.

Figure 3. Field strengths used in measurements as a function of power for each method.
Download figure:
Standard image High-resolution imageSince the signal is defined differently for each method, it is not possible to compare them directly. To compare them, the SNR was computed using the following equation:

The measurements at 7 W are repeated 15 times for each method. Noise is defined as the standard deviation of these 15 measurements. In DiffMag and frequency mixing, the power was increased by increasing the DC (low frequency) field strength. In second harmonic detection, the power was increased by increasing both the AC and DC field strengths. In third harmonic detection, only the AC field strength was increased. To compare the SNRs of these methods, it was divided by the drive field (AC) amplitude, because the signal scales linearly with the amplitude of the drive field at low field strengths (Faraday's law).
3. Results
The resulting signal for each method as a function of the maximum total excitation field strength is shown in figure 4. In general, the difference between signal with and without sample increases with increasing maximum field strengths. Only for third harmonic detection is there a decrease in the signal for field strengths larger than 7 mT.
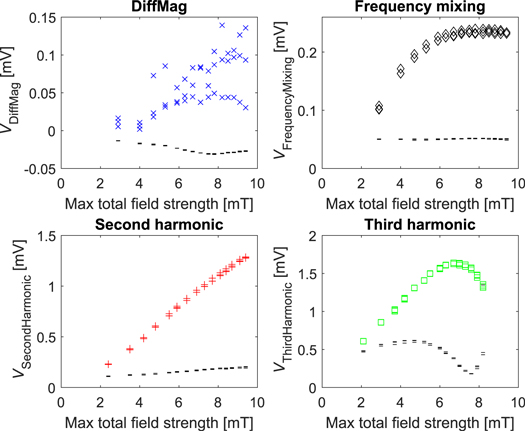
Figure 4. Signal as a function of maximum total excitation field strength, for different methods. The signal of an identical sample (symbols) as well as the signal of the empty holder (black bars) is shown. In general, the difference in signals with and without sample increases with drive field. However, the third harmonic method shows a steep decrease for field strengths over 7 mT.
Download figure:
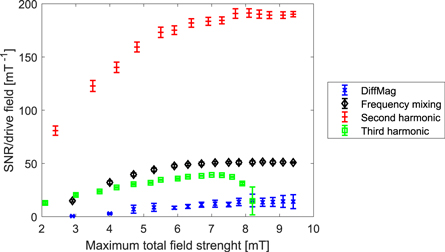
Standard image High-resolution imageNoise was calculated to be the following: DiffMag: 6.2 ± 1.2 μV, frequency mixing: 2.8 ± 0.6 μV, second harmonic: 1.2 ± 0.2 μV and third harmonic: 4.9 ± 1.0 μV. The SNR per drive field is shown in figure 5. In second and third harmonic detection, the drive field amplitude was increased with increasing power, whereas it was kept constant in DiffMag and Frequency mixing. The SNR improves with increasing drive field strength. Therefore, it was normalized to the drive (AC) field amplitude for the sake of a fair comparison.
Figure 5. SNR as a function of maximum total excitation field strength (measurement time 1 second). Second harmonic detection and frequency mixing have the best SNR. In general, there is an increase in SNR with increasing maximum field strength. For DiffMag, frequency mixing and second harmonic detection, the SNR stabilizes around 6 mT. Third harmonic detection shows a steep decrease in SNR after 7 mT.
Download figure:
Standard image High-resolution image
4. Discussion
In general, the SNR increases with increasing maximum field strengths. For DiffMag, frequency mixing, and second harmonic detection, the SNR per drive field stabilizes around 6 mT. For third harmonic detection, there is a drop in the SNR per drive field for field strengths larger than 7 mT. Since there is a drop in signal of the sample as well as of the empty holder, this is not a particle effect. In the third harmonic measurements the AC drive field strength as well as the detected signal are higher compared to any of the other methods. The current measurement in the excitation coil is correct, so we suspect an issue in the detection circuit.
For DiffMag and frequency mixing, the difference between signal with and without sample also stabilizes around 6 mT. This latter stabilization can be explained by the fact that the AC (or high frequency) field was kept constant for these methods, and the DC (or low frequency) field was increased to increase power. Since changes in the magnetic flux are measured with a coil (Faraday's law), an increase in the AC field strength is expected to increase the SNR. After saturation of SPIONs is reached, increasing the DC field strength has no effect on the measured signal.
Another factor that influences SNR is the drive field frequency. It should be noted that the noise floor is frequency dependent. In this study the AC frequency was kept constant for all methods to compare them. 1/f noise can be a big obstacle in magnetic sensors. Previous studies have shown that MPS can benefit from using higher frequencies (Wu et al 2019), leading to a lower noise floor and thus a potential increase in SNR.
Furthermore, DiffMag has a much larger spread between three consecutive measurements compared to the other methods. The origin of this increased spread might be related to the observation that DiffMag only considers differences in the amplitude of the ground harmonic (excitation frequency), whereas the other three methods derive the signal from other frequencies. As a result, DiffMag is more sensitive to changes in cross talk by the drive field, for instance by changes of the gradiometric coil position.
In medical applications, it is important to keep field strengths low. It is important to note that when the field amplitude is doubled, four times the power is involved (this is a quadratic relation). We have seen a stabilization in SNR per drive field for DiffMag, frequency mixing and second harmonic detection for field strengths above 6 mT. For third harmonic detection, a decrease in SNR per drive field was observed for field strengths above 7 mT. These results are promising for clinical applications, since none of the methods profit from large field strengths.
We were surprised by the low SNR of DiffMag compared to the other methods, since DiffMag works well in handheld detection in our experience. Measurements with our optimized software showed less spread between consecutive measurements. However, since the other methods were not optimized, it was decided to exclude these measurements from this paper. In the future, we will optimize both DiffMag and second harmonic detection to further compare them.
5. Conclusion
Nonlinear magnetic detection is promising for clinical applications because the characteristic nonlinear behavior of superparamagnetic iron oxide nanoparticles (SPIONs) already occurs at low magnetic field strengths (<10 mT), which makes it suitable for handheld detection. The field applied in these methods consists of a high frequency (AC) drive field and a low frequency (DC) bias field. We measured the SNR as a function of the maximum applied field. We determined that the difference between signal with and without sample of the four methods generally increases with increasing maximum applied field. Only for third harmonic detection is there a sharp decrease in the signal for fields above 7 mT. The SNR ratio improves with increasing drive field strength. For the sake of a fair comparison, we normalized the SNR to the drive field amplitude for all four investigated methods. In this comparison, second harmonic detection has the best SNR; it is about 4 times higher than for any of the other methods.
6. Recommendations
Generally, all methods will improve when the data acquisition (DAQ) system has a big dynamic range. To make use of the full potential of the DAQ system, it is important to minimize the interference of the excitation field. If we only 'see' the signal generated by the nanoparticles, the gain can be increased and the full dynamic range can be used.
The reproducibility of the measurements made by DiffMag can be improved by using active compensation, which is a way to get rid of the excitation field (van de Loosdrecht et al 2019). Furthermore, the ratio of AC and DC field strengths can be optimized for DiffMag. Also, the length of the parts with a DC offset field can be shorter than those of the parts without DC offset field. This way, the field strengths can be larger while the power dissipated in the excitation coil remains the same.
Frequency mixing can be improved by optimizing the ratio of AC and DC field strengths. In this study the AC field strength was kept constant, whereas increasing it is expected to improve SNR.
Third harmonic detection can be improved by using resonance circuits for the excitation as well as the detection coils. A resonance circuit reduces the power needed to obtain a higher field strength. Also, it is possible to use analog filtering to split the fundamental and third harmonic signals, which would allow a higher gain factor.
For second harmonic detection, the same improvements as for third harmonic detection can be made (resonance and analog filtering). However, the main gain would be in the use of permanent magnets. A constant DC offset is used and when doing this with a permanent magnet no power is needed.
In this work, the excitation frequency was set at 2525 Hz to avoid interference with the harmonics of the main power (harmonics of 50 Hz). However, the second harmonic frequency lies at 5050 Hz, which is the 101th harmonic of the main power net. Since the signal of the SPIONs is tiny, second harmonic detection might improve when a slightly different excitation frequency (for example 2535 Hz) is chosen.
To further analyze the full potential of the compared methods, it would be desirable to perform a frequency analysis. The ICNIRP guidelines describe a frequency dependent maximum allowed magnetic flux density (International Commission on Non-Ionizing Radiation Protection 2010). The optimal frequency will be dependent on three factors: (1) the maximum allowed magnetic flux density (lower threshold = less signal), (2) Faraday's law (twice the frequency = twice the signal strength, since changes in magnetization are measured), and (3) relaxation effects of SPIONs (at higher frequencies, the particles cannot keep up with changes in the field and no nonlinear signal is measured).
Acknowledgments
The authors would like to thank Professor John B. Weaver for useful discussions of this manuscript and Proof-Reading-Service.com for correcting the manuscript. Financial support from the Netherlands Organization for Scientific Research (NWO-TTW), under the research program Magnetic Sensing for Laparoscopy (MagLap) with project number 14 322 is gratefully acknowledged.