
Abstract
Submicron- and nano-sized starch can be employed as organic filler particles in composites. Starch with this size range can be used as an alternative filler for dental impression materials that are used to create an accurate replica or mold of the hard and soft oral tissues. In this work we selected glutinous rice flour as a starch source comprising a high amylopectin content. We carried out two different precipitation methods to reduce the particle size of glutinous rice flour and evaluated the changes on the particle size, morphological, crystallinity, and thermal properties. First precipitation method involved addition of ethanol into an aqueous phase consisting of flour and water, while in the second method (instant precipitation) we added the aqueous phase into the ethanol organic phase. We observed that both methods lead to the decrease of the glutinous rice flour crystallinity from 21.85% to around 4.30%–10.99%. The precipitation also decreased the gelatinization temperature of the treated filler particles from 87.7℃ to around 80.3–85.3℃. We found the morphological transition of glutinous rice flour from polyhedral to nearly spherical-shaped particles. First method resulted in agglomerated particles that were not perfectly distributed. While by employing the instant precipitation method we successfully reduced the particle size from 3411.5 nm to 259.5 nm. To conclude, instant precipitation method offers a simple route to reduce the particle size of glutinous rice flour to submicron-sized range.
Export citation and abstract BibTeX RIS

Original content from this work may be used under the terms of the Creative Commons Attribution 4.0 licence. Any further distribution of this work must maintain attribution to the author(s) and the title of the work, journal citation and DOI.
1. Introduction
In dentistry, a dental impression material is employed to create an accurate replica or mold of the hard and soft oral tissues [1]. It contains a polymeric matrix and various types of fillers [1]. The use of silica inorganic filler in some dental impression products has been associated with the risk of silicosis issue, a long-term lung disease caused by inhaling large amounts of crystalline silica dust [1]. Organic fillers can be potentially used as an alternative or substitute filler in impression materials [1–3]. Meincke, et al [4] incorporated methyl methacrylate with a size about 50 microns as organic filler in dental composite that resulted in low tensile strength. Another alternative is to use organic fillers from natural plant body sources consisting of starch that has many advantages such as being low cost, non-toxic, biocompatible, abundantly available, and biodegradable [5–10]. The size of organic filler particles must be suitable to fulfill the accuracy and consistency of the dental impression material. Typical organic filler from plant body sources has a wide range of sizes, generally in micron-sized range. Thus, we need to reduce the organic fillers to a submicron or nano size so it can be applied in filling thin areas of the mouth, such as in the subgingival area [1, 11].
One of starch-rich organic filler that can be potentially used in dental impression material is glutinous rice flour [3]. It has been extensively used as a food component since its carbohydrates are easily digestible due to the starch consisting almost entirely of amylopectin. The glutinous rice flour contained about 83.59% of starch, 7.78% of protein, and the rest were lipid, mineral substances, and vitamins [12, 13]. The ratio of amylose and amylopectin as well as the branching degree of amylopectin in flour/starch will affect the functional and physicochemical properties of the starch granules [14–17]. The morphology and size of starch granules are potential for dental filler applications [18]. The decrease of the particle size to nanoscale shall improve their functional properties as composites [7, 19, 20].
The particle size of starch-rich organic fillers can be reduced via the precipitation technique that involves nucleation theory [21–23]. This technique is simple, fast, and widely employed in nanomaterials synthesis [7, 19–22, 24]. Previous works reported precipitation technique by adding organic phase dropwise to the aqueous phase containing starch [21, 25–27]. Ma, et al [28] obtained starch nanoparticles with size ranges between 50–300 nm using this technique which then crosslinked with citric acid. Another option is to quickly add the aqueous phase of starch to the organic phase, inducing instant precipitation that results in nano-sized particles. Chin et al [29] prepared starch nanoparticles by precipitation of sago starch with diameters of 300–400 nm and successfully reduced the size to 30–150 nm by adding surfactant. Tan et al [30] reported the formation of acetylated waxy maize starch nanospheres with size of 249–720 nm using a nanoprecipitation method.
Although there are quite many reports on the precipitation methods, we found that glutinous rice flour as its source of starch has not been reported. Glutinous rice flour could be an alternative for fillers, owing to its unique characteristics, economic friendly, and suitable not only for applications in food but also in the pharmaceutical industry. Therefore, this glutinous rice flour would have the opportunity to be an organic filler for the dental impression by evaluating its morphology, size, structure, and thermal properties of filler size reduction using two different precipitation techniques.
2. Materials and method
2.1. Materials
Glutinous rice flour (Rosebrand ™) was obtained from the local market (Indonesia). Ethanol was of analytical grade (Sigma-Aldrich Merck). Bi-distilled water (Ikapharmindo Putramas) was used throughout. All chemicals were used as received.
2.2. Particle size reduction of glutinous rice flour
Particle size reduction of glutinous rice flour was carried out with two precipitation methods as seen in table 1 and figure 1.
Table 1. Sample preparation of glutinous rice flour using precipitation method: addition of organic phase into the aqueous phase (method 1) and instant precipitation (method 2). Native glutinous rice flour was used as a control sample.
| Samples name | Precipitation method | Powder to organic phase ratio (gr ml−1) |
|---|---|---|
| Control (native glutinous rice flour) | — | — |
| A | 1 | 8 : 300 |
| B | 1 | 8 : 150 |
| C | 1 | 1 : 37.5 |
| D | 2 | 0.01 : 20 |
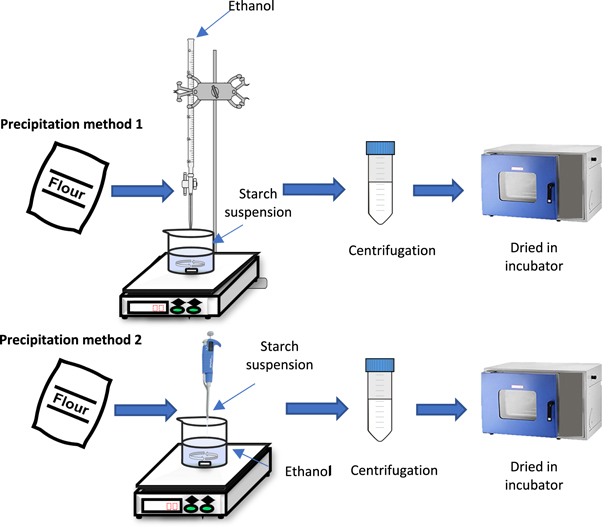
Figure 1. Sample preparation of glutinous rice flour using precipitation method 1 and 2.
Download figure:
Standard image High-resolution image2.2.1. Precipitation method 1(Addition of the organic phase into the aqueous phase)
Sample A was prepared from 8 g glutinous rice flour that was added into 150 ml of bi-distilled water. Gelatinization of glutinous rice starch mixture started by heating the samples at 58 °C–75 °C for 1 h with constant stirring, followed by addition of 150 ml dropwise ethanol to the gelatinized starch solution. Subsequently, the suspensions were cooled at room temperature. Next, another 150 ml of ethanol was added dropwise within 50 min with constant stirring [28]. Sample B was prepared similar to sample A, except without the second 150 ml of ethanol dropwise. Sample C was prepared by adding 1 g glutinous rice flour into 37.5 ml of bi-distilled water. The mixture was then heated for an hour to complete the gelatinization prior to the dropwise addition of 37.5 ml ethanol to the mixture. All suspensions were then centrifuged at 6000 rpm for 30 min. The settled filler particles were washed using ethanol to remove the water. After complete washing, the particles were dried at 37 °C to remove ethanol.
2.2.2. Precipitation method 2 (instant precipitation, addition of the aqueous phase into the organic phase)
Sample D was prepared using instant precipitation method by dissolving 0.1 g of glutinous rice flour in 10 ml of bi-distilled water at 58 °C–64 °C for 1 h. An aliquot of glutinous rice solution (1 ml) at room temperature was added dropwise into 20 ml ethanol and stirred for 30 min. The resulting mixture was then centrifuged at 6000 rpm for 30 min and rinsed thoroughly with ethanol. The sample was subsequently dried at 37 °C to remove ethanol [31].
2.3. Characterization
2.3.1. Scanning electron microscope (SEM)
The surface image was obtained using the SEM instrument JEOL–IT300 scanning electron microscope at an accelerating voltage of 30 kV, where the samples were coated with gold beforehand.
2.3.2. Particle size measurements
The average size and size distributions of native and treated glutinous rice flour particles were estimated by dynamic light scattering (DLS) using a Nano Particle Analyzer Horiba SZ-100 (Horiba, Japan) equipped with a Diode-pumped solid-state laser (532 nm) and a temperature-controlled cell holder. The intensity of the scattered light was detected at 90◦ to the incident beam.
2.3.3. Fourier transform infrared spectroscopy (FTIR)
FTIR spectra of native and treated glutinous rice flour particles were recorded on an FTIR spectrometer (Prestige 21 Shimadzu, Japan). The powdered samples mixed with dry KBr using a pellet procedure. A sample shuttle measurement was performed to interleaved the sample and background scan. The spectra were measured 40 times at a resolution of 4 cm−1 at a wavenumber of 4000 to 400 cm−1.
2.3.4. X-ray diffraction (XRD)
XRD analysis for the native glutinous rice flour and the resulted filler particles were carried out on an X-ray diffractometer (Rigaku SmartLab, Japan) equipped with a copper tube with the wavelength of 1.5406 Å, operating at 40 kV and 30 mA.
2.3.5. Thermogravimetric analysis (TGA)
TGA measurements were conducted via a synchronous thermal analysis (Hitachi STA7300, Japan). Approximately 3 mg of each sample was loaded into aluminium pan and heated from 45 °C to 450 °C at a heating rate of 10 °C min−1 [24]. All the measurements were done under a nitrogen atmosphere with a gas flow of 20 ml min−1.
2.3.6. Differential scanning calorimeter (DSC)
Gelatinization parameters of the filler particles samples were measured using a DSC 214; Polyma Merck Netzsch. Approximately 3–8 mg of sample was placed in an aluminium pan. The pan was hermetically sealed before DSC analysis. The scanning temperature range and the heating rates were 25 °C–120 °C and 10 °C min−1, respectively. In all measurements, the thermogram was recorded with an empty aluminium pan as a reference. During the scans, the space surrounding the sample chamber was flushed with dry nitrogen to avoid condensation. The temperatures reported are the onset (To), peak (Tp), and conclusion (Tc). The enthalpy of gelatinization (∆H), estimated by integrating the area between the thermogram and a baseline under the peak, was expressed in Joules per gram of dry particles [24].
3. Results
3.1. Morphological and size reduction of glutinous rice flour
SEM images of native glutinous rice flour (figure 2 Control) reveal a polyhedral shape while samples treated with precipitation method 1 (figures 2A–2C) demonstrate agglomerated particles that are not perfectly distributed. Sample A shows the initial formation of spherical morphologies with a size of about 600 to 800 nm. We observe transitional morphology that noticed by the orange mark on the SEM image of sample B from polyhedral to smaller spherical or oval. Furthermore, sample C shows an aggregation as seen in the yellow mark. Meanwhile, smaller particles are clearly observed from the precipitation method 2 in figure 2(D) that noticed by the yellow arrow compared to control. Although we still observe particles agglomeration that shown by the blue mark, the distribution as seen in figure 2(D) is more uniform compared to control and other treated samples.
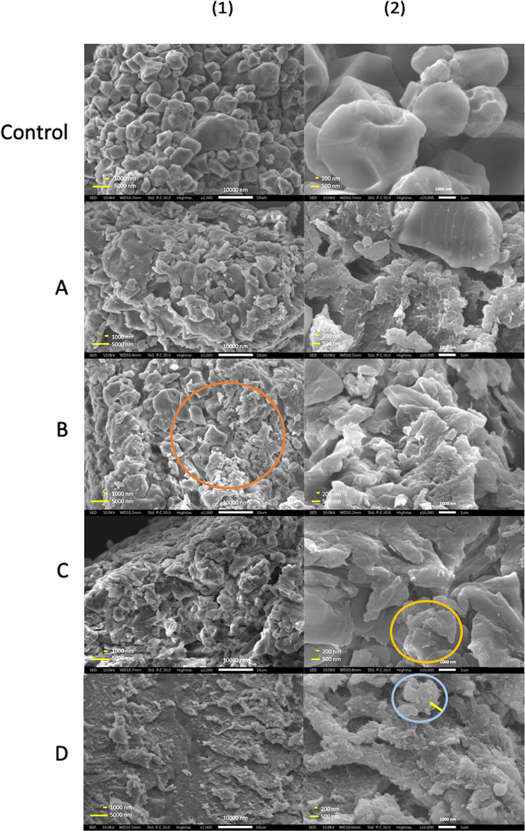
Figure 2. SEM Images of Native (Control) and Treated (Sample (A)–(D)) Glutinous Rice Flour, Showing Transition from Polyhedral to Agglomerated Spherical Morphologies. (1) and (2) Denote Different Magnifications.
Download figure:
Standard image High-resolution image3.2. Particle size analysis (PSA)
PSA results clearly confirmed the particle size reduction as previously shown by SEM images (table 2). The z-average shows the intensity-weighted mean diameter derived from the cumulant analysis [32] of mean peaks involved from each sample. We observe single distribution peak for Control, sample A, and D. Sample B and C show two distribution peaks (figure 3) so that the value of z-average calculated based on these peaks. The native glutinous rice flour has the z-average value of 3411.5 nm. While samples treated with precipitation method 1 show a slightly reduction to 3264.2 nm, 2599.1 nm and 2670.3 nm for sample A, B and C respectively. Sample D demonstrates the smallest z-average value, calculated to 259.5 nm with the lowest polydispersity index (PdI) accounted to 0.453. This PdI value indicates that sample D is more homogenous than other samples. The PdI values of more than 1 detect the polydisperse [32].
Table 2. Particle size of native glutinous rice flour and treated samples, measured by PSA and SEM images.
| PSA | SEM | ||||
|---|---|---|---|---|---|
| Sample | Mean peak 1 (nm) | Mean peak 2 (nm) | Z-average (nm) | PdI | Average particle size (nm) a |
| Control | 4912.5 | — | 3411.5 | 2.948 | 3938.4 |
| A | 5527.9 | — | 3264.2 | 1.310 | 1779.5 |
| B | 266.0 | 6523.0 | 2599.1 | 1.064 | 1659.0 |
| C | 215.7 | 6781.5 | 2670.3 | 1.157 | 1279.2 |
| D | 301.9 | — | 259.5 | 0.453 | 264.8 |
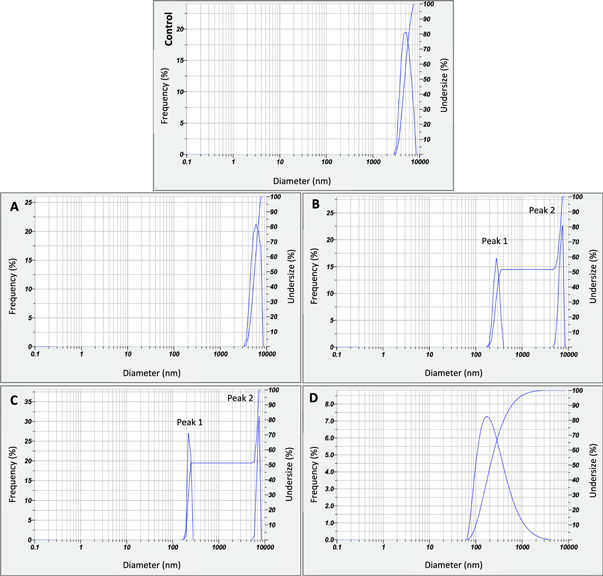
Figure 3. PSA distribution analysis of native (control) and treated glutinous rice flour samples (A)–(D). Samples B and C indicate two distribution peaks.
Download figure:
Standard image High-resolution image3.3. Crystallinity analysis
XRD diffractograms are displayed in figure 4. Control sample shows diffraction peaks at 2θ 15.8°, 17.1°, 18.3° and 23.1°, indicating the typical A‐type starch, which is similar to starch from rice flour [24, 33, 34]. The crystallinity of treated samples decreased from 21.85% (Control) to 7.41%, 10.46%, 10.99%, and 4.30% for sample A, B, C, D, respectively.
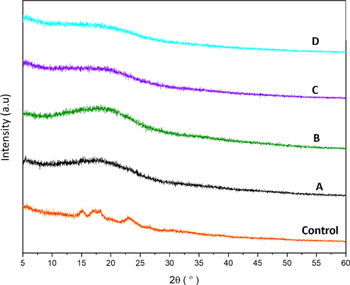
Figure 4. XRD Patterns of Native (Control) and Treated Glutinous Rice Flour (Sample A-D).
Download figure:
Standard image High-resolution image3.4. FTIR analysis
FTIR spectra are shown in figure 5. Control sample exhibits a strong absorption peak intensity at 3408.22 cm−1, corresponding to inter and intra-molecular hydrogen bonding of OH stretching vibrations [35]. The OH- functional group of treated samples shifts to a higher wavenumber, indicated by peak at 3425.58 cm−1 (sample A), 3427.51 cm−1 (sample B and C), and 3410.15 cm−1 (sample D). Zhang. et al [35] reported the shifting of OH- absorption band at 3400 cm−1 to a shorter wavenumber indicated a reduction in amorphous regions or an increase in the structural organization [35, 36]. In this study, we observed that the amorphous region increased, which marked with morphological structure change and aggregation of the treated glutinous rice flour. Sample D has shown a value that is close to the control sample of glutinous rice flour, so it could be a preference for a more suitable precipitation method in particles filler size reduction from glutinous rice flour.
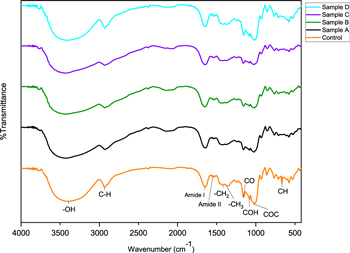
Figure 5. FTIR Spectra of Native (Control) and Treated (Sample A-D) Glutinous Rice Flour.
Download figure:
Standard image High-resolution imagePeak at 2931.80 cm−1 corresponds to the C-H stretching vibration from the glucose units of glutinous rice flour. This C-H functional group appears at 2926.01 cm−1 in samples A and C, at 2927.94 cm−1 in sample B, and at 2929.87 01 cm−1 in sample D. Hence, again sample D shows almost similar value to the control sample. In the area between the 1500–2000 cm−1 wavenumber [37], the absorption peak at 1641.42 cm−1 in all samples appear due to the presence of water bound to glutinous rice flour due to stretching vibrations and bending of hydrogen -OH groups from water. Meanwhile in sample D, the characteristic wavenumber at 1654.92 cm−1 shows C=O stretching vibrations in the –CHO functional group [24, 31, 35, 38].
Control and treated samples show peaks at 1413.82 cm−1 and 1375.25 cm−1 correspond to –CH2 and –CH3 bending vibration respectively. There is also stretching vibration at 1155.36 cm−1 for C–O bonds, at 1082.07 cm−1 for COH bonds, and at 1020.34 cm−1 for C–O–C bonding [24, 35, 39]. The fingerprint area at 928 cm−1attributed to COH bonds, at 861 cm−1 for COC symmetrical stretching and CH deformation, and there are also skeletal mode vibrations of the pyranose ring at 784, 738, 579.75, 530.3 cm−1 bands. Meanwhile, the fingerprint area at 667.37 cm−1 indicates the CH bending vibration that disappears in the treated samples. In this work we used flour rather than pure starch, so it still contains protein components that appear as peaks at 1640 cm−1 and 1530 cm−1. Band at 1640 cm−1 associated with amide I bond and 1530 cm−1 correlated to the amide II bond, which has N-H bending band [33, 40, 41].
We calculated the crystallinity of starch using FTIR, as can be seen in table 3. The prediction was determined by the ratio of absorbance of the bands at 1018/1047 cm−1 for semicrystalline and amorphous phase [41]. The high peak intensity at 1018 cm−1 [42] possess a shoulder at 1047 cm−1 and was quantified to predict the degree order of this sample. This treated samples show the prediction quite confirm the decrease in crystallinity from the XRD analysis [38, 41, 42]. Therefore, the decrease of crystallinity was indicated by ratio of absorbance changes after performing treatment of size reduction.
Table 3. Absorbance ratio from FTIR Spectra to predict crystallinity value of native (control) and treated glutinous rice flour.
| Samples Name | 1018.41/1047.34 cm−1a |
|---|---|
| Control | 1.177 |
| A | 1.070 |
| B | 1.068 |
| C | 1.062 |
| D | 1.146 |
3.5. Thermal analysis
The Thermogravimetric (TG) and Derivative Thermogravimetric (DTG) results are shown in figure 6. Control sample shows the main mass-loss step has occurred in the range of 270 °C to 320 °C and the maximum thermal degradation temperature was approximately 302 °C–308 °C.

Figure 6. TG and DTG Analysis of Native Sample (Control) and Treated Glutinous Rice Flour (Sample A-D), respectively.
Download figure:
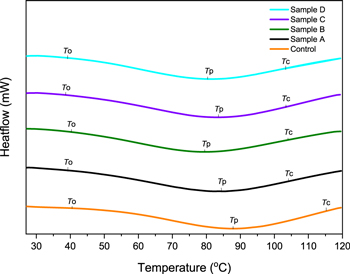
Standard image High-resolution imageWe study the behaviour of glutinous rice flour gelatinization using DSC. Table 4 denotes the values of onset temperature (T0), peak temperature (T p), conclusion temperature (T c), and gelatinization enthalpy (∆H). The thermograms recorded on native glutinous rice flour and treated filler particles prepared by precipitation method are shown in figure 7.
Table 4. Temperature and enthalpy of gelatinization of native (control) and treated glutinous rice flour.
| Sample | T0 (℃) a | Tp(℃) b | Tc (℃) c | ∆H (J g−1) d |
|---|---|---|---|---|
| Control | 40,6 | 87,7 | 116,2 | 183,5 |
| A | 39,8 | 85,3 | 104,6 | 200,2 |
| B | 40,6 | 80,3 | 104,8 | 202 |
| C | 39,5 | 83,6 | 104,6 | 219,3 |
| D | 39,7 | 80,5 | 104,6 | 236,2 |
a To , onset temperature; b Tp , peak temperature; c Tc , conclusion temperature; d∆Hgel , enthalpy of gelatinization.
Figure 7. DSC Thermograms Analysis of Native (Control) and Treated Glutinous Rice Flour (Sample A-D).
Download figure:
Standard image High-resolution image
4. Discussion
We have shown that precipitation method 1 and 2 resulted in the break of glutinous rice flour granular structure as seen in all samples (figures 2(A)–(D)) and lead to the reduction of the particle size. In sample A, we observed the morphology of particles change to spherical shapes. The phenomenon of both polyhedral and spherical morphologies appears in sample B. The transitional morphologies from polyhedral to spherical or oval could occur due to partial morphological changes caused by insufficient precipitation driven by dropwise ethanol addition. In sample C, the aggregation looks evenly distributed in all parts since an identical ratio was carried with sample A but used a lesser quantity, then changes happen more rapidly.
Amylopectin structure plays an important role in the morphogenesis of starch particles and support crystalline region framework in the glutinous rice flour. This allowed compatible double helix conformations to form branches of amylopectin chains and arranged together to form the crystalline areas of the smaller starch particles [14–17]. Although the particle is reduced to a smaller size, this glutinous rice flour is very easy to bind water molecules because of its branch points, which could form agglomerated particles. Ma, et al [28] added ethanol dropwise into a solution of corn starch and resulted in 50–300 nm corn starch size that depends on suspension stability [28]. In our case, we found that our dried glutinous rice samples A, B and C tend to agglomerate. It appears that the first precipitation method is still not as expected because the glutinous rice flour material tends to aggregate easily, so we carried out precipitation method 2 (the instant precipitation).
The precipitation method 2 employed in sample D showed that the organic phase tends to have a diffusion effect, whereas the polymer tends to collapse automatically to form nanoparticles that can encapsulate the active ingredients contained in the organic phase [21, 22]. Xiao et al [31] reported the reduction of starch particles using dimethyl sulfoxide (DMSO) as an organic solvent. They dried the sample by lyophilization process, resulting in starch particles with the size of about 100 nm. In our case, we employed a simple drying method by using an incubator at 37 °C that seemed to affect the agglomeration of the glutinous rice flour particles. We preferred not to use DMSO because of the risk of toxicity effect if it is not removed completely from the sample. Surfactants were not used during the precipitation process, which makes agglomeration occur rapidly on the resulting particles. In addition, when using DMSO and surfactant it is necessary to ensure the washing for removal is complete [29, 31].
PSA was carried out to analyze the particle size reduction of the samples while the samples were in colloidal phase. The reduction of the sample was almost the same as the range 20–500 nm of the blocket model described by Gallant, et al [43], which were gelatinized and precipitated by ethanol, which made size-reduction consistent with the blocket sizes from the native one. The development of particle size-reduction could happen by nucleation theory. It involves several steps, which are particle nucleation, growth, and aggregation [23]. The concentration of polymer reaches the critical limit of saturation, as a sign of nucleation, which will happen when the breaking of interface between the polymer and solvent by aqueous phase addition. The nucleation of the treated samples achieved its supersaturation at room temperature. The dropwise lead to an immediate increase of supersaturation in the mixture and make the system no longer stable and shall initiate the phase separation. As this separation leads to the decrease of particle size, the supersaturation begins to decrease and when it continues to drop, the particle starts to grow [44]. Growth occurs through condensation with a release of energy that will add the particles to the core. During the aggregation, it needs to maintain homogeneity control because a release of energy is also occurring. So that, the uniformity shall be achieved. Another consideration on using a stabilizer, such as a surfactant, should be considered in controlling the aggregation [21, 24].
The precipitation method 1 took a longer mixing time than particle formation time, which means particles already start to form before a complete mixing. The process would make different regions of supersaturation and shall explain the broad particle size formed that confirmed those two peaks in samples B and C. In the sample D, the mixing time is less than the particle formation time. The particles will take longer to form than reach a homogeneous mixing in the solution. It means that the system has reached the same supersaturation in every region before particle formation. It resulted in the smaller size of glutinous rice flour particles with a more homogenous size distribution.
The XRD diffractogram of treated glutinous rice flour shows the disappearance of A-type diffraction pattern peaks and change to V-type diffraction pattern. This result revealed that the precipitation process had transformed the glutinous rice flour into a more amorphous phase. The relative crystallinity of the treated samples had decreased because the crystalline regions of molecules cleaved and could originate from a single helical structure after dropwise delivery during the precipitation method [24]. The crystallinity value of native glutinous rice flour is 21.85%, similar to work reported by Nawaz, et al, calculated about 25.87% [21]. Meanwhile, the crystallinity of treated filler particles decreased for sample A (7.41%), sample B (10.46%), sample C (10.99%), and sample D (4.30%) compared to native glutinous rice flour. Sample B and C showed higher crystallinity than sample A probably caused by partial changes of ratio and amount of ethanol dropwise, which is lower than sample A. The filler size reduction in sample D shows the smallest relative crystallinity, which means more amorphous due to the destruction of crystal structure [27] of native glutinous rice flour after the treatment of instant precipitation.
Crystallinity prediction using FTIR absorbance ratio shows a high peak intensity at 1018 cm−1 rather than 995 cm−1 that mostly possessed by many types of starch [38]. This high peak intensity also similar from Lian, et al work, which studies retrogradation properties of glutinous rice flour materials [42]. Peak intensity at 995 cm−1 usually has a shoulder at 1018 cm−1 and 1047 cm−1 that indicates amorphous and crystalline characters. While in our study, the high peak intensity at 1018.41 cm−1 shall indicate crystalline order. The shoulder at 1047.34 cm−1 occurs as the amorphous domain, which makes the absorbance ratio calculated as 1018.41/1047.34 cm−1. The absorbance ratio of sample D shows a closer value to the control sample, but the XRD result confirmed lower crystallinity. All samples used flour instead of pure starch. The functional groups from other flour components could influence the resulting absorbance ratio. Therefore, the instant precipitation method on sample D could make the result unable to be compared directly with the absorbance ratio from other treated samples that used precipitation method 1. Crystallinity index predicted with FTIR resulted in rough calculation. Most of previous works reported FTIR crystallinity prediction using starch sample, while in our case we used flour samples (that contains not only starch). The trend in crystallinity value is more accurate determined by XRD.
Compared to the native glutinous rice flour, the thermal stability of treated filler particles samples prepared by precipitation decreased, following Qin, et al [24] that stated particle reduction and single helix crystal were imperfect for the cause of lower thermal stability. These results are different for the sample prepared by instant precipitation, which exhibited a small improvement in thermal stability probably caused by the density of crystal structures. The thermal stability from the TG results can measure the dehydration behaviour of dental impressions. The thermobalance of this analysis would help study the ability of a substance to maintain its mass under a variety of conditions. Even though larger particles take longer to decompose, the derivative curve with areas under the peaks is proportional to the mass change of the sample. And the peak temperature of the DTG curve has an inflexion point where mass is lost most rapidly. This peak would indicate the thermal stability of the dental impression materials when using the filler. From the curve, we can observe that sample D represents the higher temperature to dehydrate most rapidly to other treated samples, almost the same as the control sample. It means that sample D has good relative thermal stability that can lead to the dimensional stability of the dental impression materials [45].
The thermal properties of glutinous rice flour samples involve the starting increase temperature of paste viscosity as T0, the maximum viscosity temperature as Tp, and final temperature of viscosity increment as Tc, or defined as the completely gelatinized temperature of the granules [14, 18]. The results of DSC measurement indicated that T p values of treated glutinous rice flour decreased. Gelatinization temperature and enthalpy are related to crystallinity degree and amylopectin structure of starch granules [34]. The result agreed well with previous studies from Qiu, et al [33] and Hong, et al [46] that also reported that the change in the internal structure of starch granules could be from adequate input energy based on the treatment. It makes the amorphous region have less attractive forces and intra-molecular hydrogen bonds weaker, thus resulting in a lower temperature of gelatinization [33, 46]. From the DSC results, the T p values of sample B is lower than the other treated samples. The data supports the lowest ratio of powder to organic phase than another sample. And the quantity of amylopectin in the sample contributes to a faster gelatinization. The procedure would rapidly absorb water and generate water penetration quicker into crystalline areas [14]. The faster gelatinization that corresponds to SEM images also resulted in inhomogeneous particles. Knowing the gelatinization peak temperature of sample D would be very helpful if used as filler for dental impression materials since the lower peak temperature would be saving the time-consuming in the patient mouth for setting time to occur.
The gelatinization enthalpy indicates energy required by amylopectin for the phase transformation during DSC measurement [33]. The observation of enthalpy changes associated with gelatinization of starch/flour. As gelatinization involves the disruption of ordered regions in the granule, the magnitude of the enthalpy change is proportional to the amount of ordered structure [47]. However, the gelatinization enthalpy of the treated samples (200,2–236,2 J g−1) was higher than those of native glutinous rice flour (183,5 J g−1). It could be caused by the aggregation on the samples though size reduction of filler particles already improved, which probably also still have double helix structure rearrangements that lead to an increase in the gelatinization enthalpy than the control sample [24, 47].
5. Conclusions
In this study, we applied two different methods of precipitation to reduce the particle size of glutinous rice flour and evaluated their effect on the physicochemical properties. The precipitation result leads to the morphological changes of glutinous rice flour from polyhedral to spherical. Although agglomerated, the size of glutinous rice flour granules has reduced from 3411.5 nm to 259.5 nm. The instant precipitation method allows filler size reduction with lower gelatinization temperature and an improvement in the thermal stability of the glutinous rice flour. These organic fillers could be suitable for dental impression with the advantages of simple manipulation procedure in making dental impression materials. Further research needs to develop an alternative reinforcing sufficiently thin regions, such as filling the subgingival area.
Acknowledgments
The authors would like to thank the Faculty of Dentistry Integrated Lab, Universitas Padjadjaran for allowing us to do the experimental works during the current pandemic situation.
Data availability statement
The data that support the findings of this study are available upon reasonable request from the authors.