
Abstract
The aim of the present study was to evaluate and compare the effect of thermal-cycling, mechanical brushing and beverage storage on the colour changes and surface roughness of conventional heat-polymerized and CAD/CAM PMMA used to fabricate complete dentures. A total of 100 specimens measuring 10 mm in diameter and 3 mm in thickness were fabricated from conventional PMMA resin (Heat-cured, Major. Base.20, Moncalieri, Italy) and CAD/CAM blocks (Opera system, Principauté de Monaco, French). The specimens were subjected to a combined surface treatment involving thermo-cycling, mechanical brushing, and immersed in either artificial saliva (AS), coffee, tea, Coca-Cola, or lemon juice. Colour differences (ΔE) and surface roughness (Ra) was determined using a spectrophotometer and non-contact profilometer, respectively. The data were analyzed using IBM SPSS v.20 (α = 0.05). Factorial ANOVA showed that independent factors, namely material, beverages, and the interaction between independent factors, significantly influenced ΔE (F = 76.862; p < 0.001) and surface roughness (F = 71.685; p < 0.001). The overall highest and lowest colour differences was obtained for CAD/CAM PMMA (ΔE = 1.93 ± 1.29) and conventional PMMA (ΔE = 1.41 ± 1.39) resins, respectively (p = 0.061). Conventional PMMA (1.22 ± 0.20) demonstrated significantly increased roughness compared to CAD/CAM PMMA (0.91 ± 0.17) (p < 0.001). Pearson correlation showed a low degree of correlation, which was non-significant for both the PMMA (r = 0.015; p = 0.917) and C-PMMA materials (r = 0.097; p = 0.505). CAD/CAM milled PMMA resins demonstrated greater colour change and lower surface roughness compared to conventional heat-polymerized PMMA resins. Specimens in tea and coffee demonstrated maximum colour changes and were perceivable by the human eye. On the contrary, specimens immersed in low pH acidic beverages namely Coca-Cola and lemon juice demonstrated maximum surface roughness.
Export citation and abstract BibTeX RIS

Original content from this work may be used under the terms of the Creative Commons Attribution 4.0 licence. Any further distribution of this work must maintain attribution to the author(s) and the title of the work, journal citation and DOI.
Introduction
Poly (methyl methacrylate) (PMMA) resin has gained tremendous consideration due to its unique properties: low density, acceptable aesthetics, cost-effectiveness, ease of manipulation, and good physical and mechanical properties [1]. They have been used for more than 80 years and are still considered gold-standard to fabricate complete dentures (CD). Furthermore, 95% of CDs are fabricated using PMMA resin because it is easy to process, repair, and polish [2, 3]. On the contrary, PMMA resin have been inflicted with severe criticism because of their drawbacks such as inadequate mechanical strength, dimensional instability, risk of fracture, residual monomer toxicity and increased risk of denture stomatitis [4, 5].
For more than 50 years, PMMA resin has been processed using traditional flask-pack-press or compression molding techniques to fabricate CDs [6]. Over the years, as the performance of PMMA resin and related processing protocols (auto-polymerization, microwave processing, or injection-molding) has improved, this method has continued to evolve [6, 7], although the principle remained unaltered. The introduction of computer-aided design and computer-aided manufacturing (CAD/CAM) processes for fabricating CDs have significantly transformed the processing technique in recent years [8].
In CAD/CAM technology, CDs are fabricated by milling blocks of prepolymerized acrylic resin that are polymerized under high temperatures and pressure, without the need for time-consuming conventional processing methods [2]. Furthermore, CAD-CAM-fabricated CDs have enhanced material properties, reduced treatment appointments saving both patient and clinician time, cost-effectiveness because of reduced treatment time and since the data are digitally stored, it is easy to retrieve and fabricate new dentures if fractured or lost [6, 7]. The CAD/CAM technologies have been used to fabricate CDs since the 1990s; however, they are still considered relatively new technique because of the limited scientific evidence [2, 9].
Colour stability is one of the most significant clinical characteristic for all dental materials, and any colour changes from the basic standard indicate aging or material damage [2, 10]. Additionally, the colour instability of dentures might cause patient discomfort and a need for denture replacement [10]. The discolouration of dental materials over long-term clinical use are caused by stain accumulation, dissolution of material ingredients, water sorption, pigment degradation, and surface roughness [11, 12]. It is commonly recognized that beverages including tea, coffee, wine, acidic soft drinks and other artificial food colours can exacerbate the colour changes of denture resin materials [13].
Surface roughness is reported to be one of the key factors in denture-induced stomatitis [14]. Rough surfaces are more likely to cause halitosis and are more prone to staining than smooth surfaces, limiting patient comfort. Although microbial adherence and colonization are more common on non-shedding surfaces, dental prosthesis must have smooth texture to decrease plaque and microbial retention. The roughness threshold (RT) for dental prosthesis is 0.2 μm [5, 14], and values above the RT increases bacterial accumulation on the surfaces.
Mechanical brushing is a commonly practiced method of denture hygiene. Nevertheless, the continuous action of toothbrush bristle and toothpaste particles contributes to an increased roughness on the denture surface that could facilitate microbial accumulation, plaque retention and colour instability [13, 15, 16]. This could be further aggravated by the low pH of the commonly consumed beverages which has a detrimental effect on the denture surface in the form of resin matrix softening, eroding of denture surface and disintegration of the resin material particles [17].
The colour change and surface roughness of conventional PMMA resin is influenced by thermal-cycling (TC), denture hygiene habits, and interaction with beverages [18]. However, little is known about such influences on CAD/CAM PMMA.
Therefore, the aim of the present study was to evaluate and compare the effect of thermal-cycling, mechanical brushing and beverage storage on the colour changes and surface roughness of conventional heat-polymerized and CAD/CAM PMMA used to fabricate CDs. The null hypothesis for this study was that there would be no difference in colour changes and surface roughness between conventional and CAD/CAM PMMA following surface treatments.
Materials and methods
In the present study, conventional PMMA and CAD/CAM PMMA (C-PMMA) materials were evaluated for colour changes and surface roughness following aging by TC, mechanical brushing and immersion in beverages.
Specimen preparation
A total of hundred disc-shaped specimens measuring 10 mm in diameter and 3 mm in thickness were fabricated from conventional PMMA and C-PMMA resin materials. The conventional PMMA resin (Heat-cured, Major. Base.20, Moncalieri, Italy) specimens were fabricated by the lost wax technique. The wax pattern was prepared per the required dimension and processed using the flask-pressure-pack method [19]. The excess resin following deflasking was removed using a fine tungsten carbide bur (Meisinger, Hager & Meisinger GmbH, Neuss, Germany) at 15,000 rpm. The C-PMMA specimens were designed according to the specified dimensions using Zenotec® CAD software (Wieland Digital Denture Ivoclar Vivadent, Schaan, Liechtenstein) and CAD/CAM blocks (Opera system, Principauté de Monaco, French) were milled using Zenotec® selection (Wieland Digital Denture Ivoclar Vivadent, Schaan, Liechtenstein) [20].
A single operator for the purpose of standardization handled all the prepared specimens during finishing and polishing. The specimens were finished with silicon carbide bur (Meisinger, Hager & Meisinger GmbH, Neuss, Germany) at 300 rpm under water coolant. Next, the specimens were polished (Derotor, London, England) for 90 s using a slurry of pumice and water. All the specimens underwent ultrasonic cleaning in distilled water for 5 min and dried with absorbent paper for baseline colour and surface roughness measurements [17].
Thermal-cycling (TC) and mechanical brushing
The specimens were then subjected to aging by TC (Huber 1100, SD Mechatronik GmbH, Feldkirchen-Westerham, Germany). A total of 1,000 cycles in the water bath (5 °C–55 °C, 30 s dwell time and 10 s transfer time) was applied to simulate one year of oral use [21]. The specimens were cleaned under running water and stored in distilled water at room temperature before mechanical brushing. The specimens were fixed onto the containers of the toothbrushing device (ZM 3, SD Mechatronik GMBH, Feldkirchen Westerham, Germany) using a drop of acrylic monomer. The device contained 12 individual slots to which 12 soft toothbrushes (Colgate® 360®, Colgate-Palmolive Company, Saudi Arabia) were fixed. The container was filled with a slurry of dentifrice (Colgate® Regular, Colgate-Palmolive Company, Saudi Arabia) and deionized water at a ratio of 1:1. All 12 containers were filled with the slurry (approx. 12 ml/container) to cover the specimens. The brushing parameters applied were 356 rpm, 200 g vertical load, 3.8 cm stroke path and 17,800 brushing cycles (50 min). The slurry was refilled during the brushing, and toothbrushes were replaced every 4,500 cycles as per the recommendations of the American Dental Association (ADA), which states that toothbrushes be replaced 3–4 months [17].
Immersion process
The specimens were cleaned under running water and stored in distilled water for 24 h before immersion in beverages following the ISO/TR 11405:1994 recommendation [9]. The specimens were randomly assigned into five groups (n = 10) according to the staining beverages used (coffee, tea, Coca-Cola, lemon juice and artificial saliva). Coffee (Nescafe Classic, Nestle, Saudi Arabia), tea (Lipton Yellow Label, Unilever Limited, Jeddah, Saudi Arabia) and artificial saliva (AS) was prepared fresh. Contrarily, Coca-Cola (The Coca-Cola Company, Riyadh, Saudi Arabia) and lemon juice (Florid's natural lemonade juice, Lake Wales, FL, USA) were used fresh as received from the company. The AS was prepared by a pharmacist based on the description from previous studies. For the coffee beverage, three teaspoons of coffee powder were added to 250 ml of boiling water and continuously stirred for 10 min. The prepared solution was cooled down to room temperature and drained using a filter net to remove the residue. The tea was prepared by adding 250 ml of boiling water to one teaspoon of tea leaves. The tea was left to churn out and later drained over a strainer to remove loose tea leaves. The pH of beverages and AS was determined using a pH meter (Model 2700, OAKTON Instruments, IL, USA). The specimen was tied using floss and suspended in large vials containing 20 ml of the beverages for the immersion process. This ensured even exposure of both specimen surfaces to the beverages. The total immersion period was 168 h that equalled one year of oral exposure [17], and the beverages were changed every 24 h. The specimens were taken out from the vials, cleaned under running water, and stored in distilled water for 24 h before final colour and surface roughness measurements [17].
Colour and surface roughness measurements
The colour of the specimens at baseline and after aging was recorded in the 3D Commission Internationale de l'Eclairege (CIE) L*a*b* colour space using a bench-top UV light visible spectrophotometer (CM-2600d, Konica Minolta Sensing Inc., Osaka, Japan) operating at a wavelength between 360 nm and 740 nm. The spectrophotometer was calibrated against a white background as per the manufacturer's recommendations. The CIE colour coordinates were recorded under a three- pulsed xenon lamps which corresponds to average daylight. In CIEL*a*b*, L* represents light and dark on a scale and ranges from 0 (black) to 100 (white), a* and b* are on the chromatic scale: a* corresponds with red (+), and green (−) quantity and b* corresponds with yellow (+), and blue (−) quantity [22]. Three recordings were obtained for each specimen at baseline and after surface treatment, and the mean ΔE was calculated using the following equation (1).

ΔL*, Δa*, and Δb* symbolizes the mean differences between the baseline and final L*, a*, and b* values.
The reported CIELab 50:50% perceptibility threshold (PT) and acceptability threshold (AT) values in dentistry are ΔE ≤ 1.2 and ΔE = 2.7, respectively. The ∆E values over the AT limit (ΔE = 2.7) is not clinically acceptable [23]. In correlating the colour values to the clinical environment, the ΔE was converted to National Bureau of Standards (NBS) using equation (2):[17].

A non-contact optical profilometer (Bruker Contour GT, Tucson, AZ, USA) was used to measure the surface roughness of the study specimens. The profilometer is equipped with a nano-lens atomic force microscopy (AFM) module and a fully automated turret. The specimen was placed on the turret and scanned by white light interferometry without contacting the surface to determine the roughness. The turret movement is controlled by vision software equipped with a profilometer. The specimen was scanned at three different surfaces, 2 mm apart, and the mean of the three readings conforms to the roughness of that specific specimen. The roughness measurement is expressed as the roughness average (Ra) in μm [24].
Scanning electron microscopy (SEM) assessment
One representative specimen was randomly picked from each group, and the surface topography was evaluated using a scanning electron microscope (JEOL JSM-5900 lV SEM, Tokyo, Japan). The SEM micrographs were obtained at a magnification of 1000× and 10 kV, in vacuum.
Statistical analysis
The statistical software SPSS 22.0 (IBM SPSS Inc., Armonk, NY, USA) was used to analyze the data. Descriptive and inferential analysis was carried out in the present study. Student t-test (two-tailed, dependent) was used to find the significance of study parameters in each group. Factorial ANOVA was applied to evaluate the material, beverages, and the interaction between them on the colour difference and surface roughness. Pearson correlation was performed to find the degree of relationship between colour difference and surface roughness. For all the statistical tests, the significance level was at 5%.
Results
G*Power v. 3.1.9.3 (Heinrich-Heine-Universität Düsseldorf, Germany) was used to calculate the sample size. For a 0.6 effect size, 0.8 power, and an estimated SD of 0.32 at a significance level of 0.05, each group required eight samples. We did, however, included ten samples to compensate for the sample loss during the study. The pH of AS, coffee, tea, Coca-Cola, and lemon juice was 7.2, 5.1, 6.3, 2.5 and 2.
Colour differences (ΔE)
Factorial ANOVA showed that independent factors, namely material, beverages, and the interaction between independent factors, significantly influenced ΔE (F = 76.862; p < 0.001) (table 1).
Table 1. Factorial ANOVA outcome for colour differences.
| Source | Type III sum of squares | df | Mean square | F | Sig. |
|---|---|---|---|---|---|
| Corrected Model | 154.120a | 9 | 17.124 | 51.920 | <0.001* |
| Intercept | 279.558 | 1 | 279.558 | 847.596 | <0.001* |
| Material | 6.482 | 1 | 6.482 | 19.653 | <0.001* |
| Beverages | 46.233 | 4 | 11.558 | 35.044 | <0.001* |
| Material*Beverages | 101.404 | 4 | 25.351 | 76.862 | <0.001* |
| Error | 29.684 | 90 | .330 | ||
| Total | 463.362 | 100 | |||
| Corrected Total | 183.804 | 99 |
*Statistically significant difference (p < 0.001).
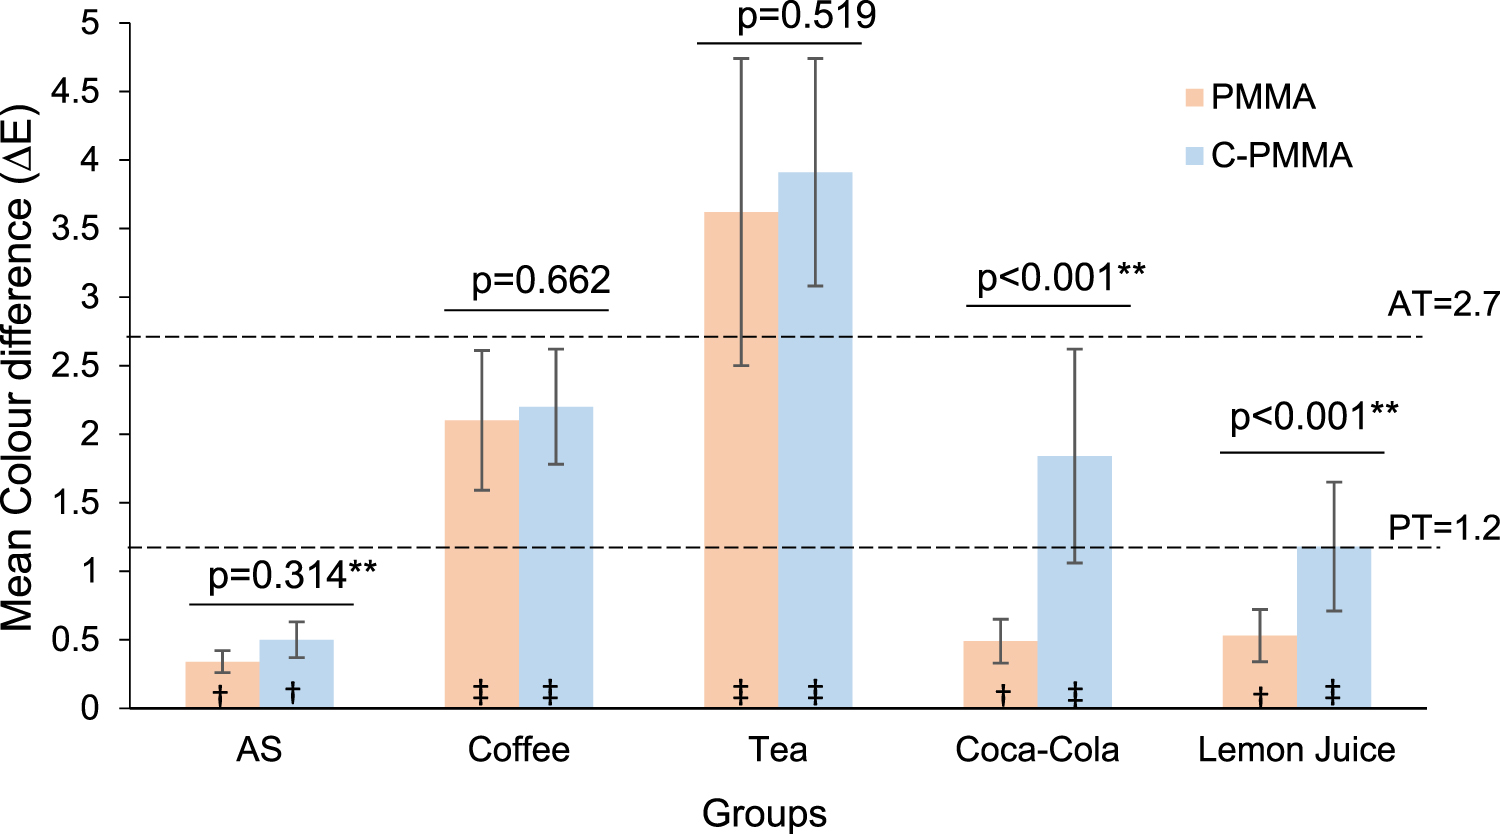
The outcome on continuous measurements for colour changes are presented as mean ± SD (figure 1). Regardless of the materials and beverages, C-PMMA in tea (3.91 ± 0.83) and PMMA in AS (∆E = 0.34 ± 0.08) showed the highest and lowest ∆E values, respectively. There was a significant difference in ΔE values of the materials for the Coca-Cola and lemon juice beverage groups but non-significant difference for coffee (p = 0.662), tea (p = 0.559) and AS (p = 0.314). Among the tested materials, the overall highest and lowest colour differences was obtained for C-PMMA (∆E = 1.93 ± 1.29) and PMMA (∆E = 1.41 ± 1.39) resins, respectively. The difference in mean ∆E between the materials was found to be statistically non-significant (p = 0.061). Amongst the beverages, tea (∆E = 3.77 ± 0.97) caused significantly higher ΔE values followed by coffee (∆E = 2.15 ± 0.46), Coca-Cola (∆E = 1.17 ± 0.88) and lemon juice (∆E = 0.86 ± 0.49). The lowest ∆E was noticed in AS (∆E = 0.42 ± 0.13). The difference in mean ∆E between the beverages was found to be statistically significant (p < 0.001).

Figure 1. Mean ∆E values of the material groups (** indicates significant difference in ∆E between PMMA and C-PMMA (p ≤ 0.001).
Download figure:
Standard image High-resolution imageGroup tea specimens of both materials demonstrated values that was over the AT limit (∆E = 2.7). The ∆E of coffee group of both materials were above the PT but well within the AT limit. The remainder of the specimens demonstrated ∆E below the AT (∆E = 1.2).
National Bureau of Standard (NBS) remarks for colour differences: †- Extremely slight change (0.0–0.5 NBS units); ‡- Perceivable change (1.5–3.0 NBS units)
Surface roughness (Ra)
Factorial ANOVA showed that independent factors, namely material, beverages, and the interaction between independent factors, significantly influenced surface roughness (F = 71.685; p < 0.001) (table 2).
Table 2. Factorial ANOVA outcome for surface roughness.
| Source | Type III sum of squares | df | Mean square | F | Sig. |
|---|---|---|---|---|---|
| Corrected Model | 5.360a | 10 | .536 | 80.106 | <0.001* |
| Intercept | .903 | 1 | .903 | 134.926 | <0.001* |
| Material | .482 | 1 | .482 | 72.026 | <0.001* |
| Beverages | .942 | 4 | .236 | 35.203 | <0.001* |
| MaterialaBeverages | 1.919 | 4 | .480 | 71.685 | <0.001* |
| Error | .595 | 89 | .007 | ||
| Total | 117.949 | 100 | |||
| Corrected Total | 5.955 | 99 |
*Statistically significant difference (p < 0.001).
The mean Ra of the study material groups is presented in table 3. The highest mean Ra was observed with lemon juice group for PMMA (1.46 ± 0.11 μm) and C-PMMA (1.13 ± 0.04 μm) materials. The lowest mean Ra was observed with AS group for for PMMA (0.93 ± 0.08 μm) and C-PMMA (0.67 ± 0.09 μm) materials. Comparing the Ra between the tested materials showed that PMMA had increased roughness values compared to C-PMMA group and the difference in Ra was statistically significant (p < 0.001). The beverage groups from both materials except AS group showed significantly increased roughness values from baseline to final measurements (P < 0.001). The Ra values for both material groups at baseline and final measurements were over the perceptibility threshold (PT) (> 0.2 μm).
Table 3. Comparison of mean surface roughness between tested materials.
| Beverages | PMMA | C-PMMA | p-value |
|---|---|---|---|
| Artificial saliva | |||
| Pre | 0.93 ± 0.08a | 0.67 ± 0.09a | <0.001* |
| Post | 0.99 ± 0.11a | 0.72 ± 0.19a | <0.001* |
| Difference | 0.0011 | 0.003 | <0.001* |
| Coffee | |||
| Pre | 0.95 ± 0.06a | 0.68 ± 0.1a | <0.001* |
| Post | 1.13 ± 0.07b | 0.84 ± 0.1b | <0.001* |
| Difference | 0.184 | 0.159 | <0.001* |
| Tea | |||
| Pre | 0.95 ± 0.07a | 0.68 ± 0.07a | <0.001* |
| Post | 1.21 ± 0.11b | 0.87 ± 0.09b | <0.001* |
| Difference | 0.262 | 0.193 | <0.001* |
| Coca-Cola | |||
| Pre | 0.94 ± 0.08a | 0.66 ± 0.09a | <0.001* |
| Post | 1.35 ± 0.07b | 1 ± 0.02b | <0.001* |
| Difference | 0.410 | 0.334 | <0.001* |
| Lemon juice | |||
| Pre | 0.96 ± 0.13a | 0.65 ± 0.08a | <0.001* |
| Post | 1.46 ± 0.11b | 1.13 ± 0.04b | <0.001* |
| Difference | 0.499 | 0.481 | <0.001* |
*Statistically significant difference in surface roughness between the tested materials (p < 0.001). Different lower case in a column indicates significant difference from pre to post for the respective groups.
Pearson correlation to find the degree of relationship between colour difference and surface roughness showed a low degree of correlation, which was non-significant for both the PMMA (r = 0.015; p = 0.917) and C-PMMA materials (r = 0.097; p = 0.505).
Scanning electron microscopy (SEM) observation
Representative photomicrographs of PMMA (A-A5) and C-PMMA (B-B5) specimens are presented in figure 2. Among the tested materials, the baseline specimens (figures 2(A) and (B)) under SEM examination presented a uniform surface. On the contrary, all the specimen surface showed striations or groves following surface treatment which better complemented the effect of mechanical brushing. The comparison of SEM observation between the tested materials showed more evident overall surface changes in PMMA specimens compared to C-PMMA. Concerning the beverages, the specimens immersed in AS, coffee, tea showed a similar pattern in surface changes, but the specimens immersed in Coca-Cola (A4 and B4), and lemon juice (A5 and B5) showed deeper grooves. The specimens from both materials immersed in tea (A3 and B3) presented with an uneven coating of dislodged tea layer. The SEM observation was consistent with the surface roughness findings.

Figure 2. Scanning electron microscopy (SEM) micrographs of the representative material groups:A = PMMA, B = C-PMMA. (1-AS, 2-Coffee, 3-Tea, 4-Coca-cola, and 5-Lemon Juice).
Download figure:
Standard image High-resolution image
Discussion
As the current understanding goes, there is limited evidence related to the properties of CAD/CAM PMMA (C-PMMA) resins. CAD/CAM dentures are claimed to possess better fit, surface properties, and mechanical characteristics compared to conventional heat-polymerized dentures [5]. This study compared the effect of combined surface treatment on the colour stability and surface roughness of conventional heat-polymerized and C-PMMA resins used for fabricating complete dentures. The outcome of this study demonstrated that the mean ∆E was statistically non-significant (p = 0.061) and the mean Ra was statistically significant (p < 0.001) between the conventional and C-PMMA. Therefore, the null hypothesis that there would be no difference in colour changes and surface roughness between the study materials was partially accepted.
The specimens in this study were subjected to combined surface treatment involving TC, simulated brushing and beverage storage to simulate one year of clinical serviceability. There is no agreement between the previous experimental studies regarding the TC protocol; the TCs in these studies have ranged between 100 cycles and 1,00,000 cycles [25]. The TCs applied in the present study is in accordance with previous study recommending 1,000 cycles simulating one year of clinical aging [21]. The materials used to make dentures are susceptible to sorption, which is the process of liquid absorption and adsorption influenced by environmental conditions [10]. Furthermore, the hydrolytic stress generated by TC's repeated sorption cycles could result in micro-fractures in the PMMA matrix, which could leach away with TC [21].
Denture cleaning with a toothbrush and dentifrice is a simple, cost-effective and successfully proven method in eliminating organic deposits. On the contrary, brushing with dentifrices significantly impacts the wear and roughness of restorative and prosthetic materials. That said, the wear and roughness of acrylic dentures promote biofilm growth and discolouration, as well as the loss of surface texture and gloss [17]. The colour and structure of the denture base is an essential aspect of the denture, which should match the natural appearance of the underlying tissues.
The consumption of common beverages and their staining effects on the dentures base materials is well-documented [13, 17, 24, 26, 27]. The sorption property of denture base resin results in expansion of the polymer matrix, separating the polymer chains. This permits staining liquids to infiltrate the denture base material and discolour it [22]. In this study, we evaluated the effect of saliva (control) and four beverages on the colour changes and roughness of the tested materials. Coffee and tea are the beverages of choice for the vast majority of population [28], and they are known to cause discolouration of teeth and oral prosthesis. Similarly, beverages such as Coca-Cola and lemon juice have low pH and are acidic, thus contributing to dental materials' colour alterations [22].
The ∆E between specimens in the AS and each beverage was statistically significant (p < 0.05) for both materials. The ΔE of the PMMA specimens in the AS, Coca-Cola, and lemon juice were not perceivable by the human eye, whereas the specimens in coffee were perceivable by the human eye. On the contrary, the specimens of the C-PMMA in the AS were not perceivable by the human eye, whereas the specimens in coffee, Coca-Cola, and lemon juice were perceivable by the human eye. The specimens of PMMA (ΔE = 3.33) and C-PMMA (ΔE = 3.59) in tea demonstrated unacceptable colour changes. The ∆E of the specimens beyond the PT limit allows for visual appreciation of the colour changes, indicating weak colour stability. According to the NBS classification, the specimens of the study materials showed extremely slight to perceivable colour changes (figure 1).
The results of this study demonstrated that the discolouration potential of test materials in beverages varied significantly. The specimens in tea showed low colour stability, irrespective of the beverages or the materials, followed by coffee. Previous studies have demonstrated that coffee causes more colour changes than tea and cola [29, 30]. In contrast, few studies have demonstrated that coffee produces less colour changes than tea [31, 32], which is in agreement with the present findings. Despite these contradictory results, the fact that tea and coffee can stain denture resins significantly remains an important finding of the current research.
Tea leaves contain a significant amount of flavonoid, which provides tea its functional characteristics and flavor; nevertheless, tea flavonoids have been associated with discolouration. Caffeine and caffeic acid, which are found in coffee, can induce discolouration in polymeric materials [33]. Tea staining is determined by the adsorption of tea stains on the surface of the substance. On the other hand, the coffee discolouration is most likely due to both surface adsorption and absorption of colourants. Additionally, coffee processing and filtering methods also contribute to staining [32]. The staining of the materials by cola and lemon juice could be due to their low pH, which impairs the surface integrity of polymers, thereby softening the polymer surface under acidic conditions. Surface dissolution of polymeric surfaces produced by acidic chemicals in Coca-Cola and lime, such as phosphoric acid and citric acid, results in lighter appearance of the polymeric materials [26].
The present study is inconsistent with the outcome of the previous studies where it has been demonstrated that C-PMMA resins have better colour stability compared to conventional PMMA [2, 34, 35]. In contrast, Jain et al [20], demonstrated maximum colour difference with CAD/CAM milled group compared to 3D-printed and conventional PMMA resins, when immersed in denture cleansers. Similarly, Gruber et al [9], showed no difference in the colour stability between CAD/CAM milled and conventional PMMA resins, except for one C-PMMA material which showed higher colour changes. The inferior colour stability of C-PMMA could be related with its hydrophobic nature and water sorption as also confirmed by previous studies [36–39].
Concerning surface roughness, C-PMMA groups showed significantly lower Ra in comparison to the conventional heat-polymerized group (p < 0.05). Furthermore, the Ra of the specimens in each beverage was statistically significant for both materials (p < 0.05). The highest difference in Ra from pre to post-treatment were observed with specimens immersed in low pH acidic beverages, for both materials. The high Ra of these specimens could be related with mechanical brushing in conjunction with surface disintegration of polymers under acidic environment which could exhibit a rougher surface [26]. CAD/CAM PMMA blocks are highly condensed resins with improved polishability and less porosity compared to conventional PMMA,[40] and that possibly explains the lower Ra values of C-PMMA in this study. The surface roughness findings of the current study is consistent with the findings of Bidra et al [40], Steinmassl et al [38], Murat et al [41], and Al-Dwairi et al [5], who have showed lower Ra values of CAD/CAM PMMA in comparison to the conventional heat-polymerized group. Contrarily, few studies found no significant difference in Ra values between CAD/CAM and conventional PMMA resins [2, 8, 39]. The comparison between studies should be done cautiously due to the difference in study materials, measurement techniques, fabrication techniques and staining solutions.
A roughness values exceeding 0.2 μm have found to considerably increase the plaque retention and microbial adherence. However, the Ra for denture materials between studies have varied significantly [2, 26, 42–44], which raises the question of an agreeable roughness values for acrylic denture base materials. The measured Ra values of the material groups in the current study at baseline and following surface treatment were above the clinical threshold level of 0.2 μm but within the range (3.4 and 7.6 μm) reported by Zissis et al [42].
Polishing procedures have been shown to have a considerable impact on the surface roughness of denture base materials. In comparison to chairside polishing kits, conventional laboratory polishing have demonstrated the smoothest surface of denture acrylic resin with lower surface roughness values [37, 45]. As a result, conventional laboratory polishing was used in this study. Furthermore, to avoid any unintended bias and to maintain constant pressure, a single operator performed all the specimen finishing and polishing.
The present work could be helpful as a reference for future investigation concerning CAD/CAM PMMA resins in spite of the few consistent and some contradictory findings with previous experiments evaluating CAD/CAM PMMA resins. A strong methodical approach in accordance with previous studies is the strength of this in-vitro study; however, this study presents with few limitations. Despite the fact that the conditions (thermal-cycling, mechanical brushing, and beverage immersion) to simulate the oral environment were established as closely as experimentally possible, this study was unable to replicate the exact oral conditions. This is because the combined treatment do occur simultaneously in oral cavity as opposed to phased manner applied in this study. The oral environment is influenced by several factors including dental hygiene, dietary habits, salivary compositions and quantity, and pH variations which could affect the present findings. The toothpaste used in this study is classified as low abrasiveness (Relative Dentin Abrasivity = 68) and could have contributed to lower roughness values. However, the toothpaste with medium and high abrasiveness could produce more surface roughness. Finally, the time the beverage remains in the mouth before swallowing vary from person to person and may present with different outcomes. Future studies should evaluate the effect of combined surface treatment on flexural strength, hardness, water sorption and solubility, and microbial adhesion of the resin materials. Also, the effect of denture cleansers and dentifrices with different abrasiveness on denture resins should be evaluated.
Conclusion
CAD/CAM milled PMMA resins demonstrated the greater colour change and lower surface roughnes compared to conventional heat-polymerized PMMA resins. Among the beverages tested, tea and coffee demonstrated maximum colour changes and were perceivable by human eye. On the contrary, specimens immersed in low pH acidic beverages namely Coca-Cola and lemon juice demonstrated maximum surface roughness. The measured roughness values of the material groups at baseline and following surface treatment were above the clinical threshold level of 0.2 μm.
Data availability statement
The data that support the findings of this study are available upon reasonable request from the authors.