
Abstract
In the present work, Cerium (IV)-Zirconium (IV) oxide nanoparticles (CeO4ZrNPs) was successfully dispersed into Chitosan/15Gelatin nanocomposites with different quantities. The obtained chitosan-based nanocomposites represented remarkable improvements in structural, morphological, mechanical, and thermal properties. Roughness increased from 74 nm to 6.4 nm, Young's Modulus enhanced from 1.36 GPa to 2.99 GPa. The influence of dispersed CeO4ZrNPs contents on the phase transition temperature (Tg) and the non-isothermal degradation processes of chitosan-based nanocomposites were examined using Differential Scanning Galorimetry (DSC) with different heating rates. Kinetic parameters of the thermal degradation for chitosan-based nanocomposites were evaluated using Kissinger-Akahira-Sunose (KAS) and Kissenger (KIS) procedures. Chitosan-based nanocomposites showed an increase in the thermal degradation temperature with higher activation energies, indicating improved thermal stability. Thermal analysis demonstrated that chitosan-based nanocomposites became more ordered by increasing CeO4ZrNPs as inferred from the negative entropy increase. Moreover, the degradation of chitosan-based nanocomposites has been described as a non-spontaneous process. The resulting information is particularly important in applications in which there is a need to obtain chitosan nanocomposites with improved mechanical and thermal properties such as food packing industry.
Export citation and abstract BibTeX RIS

Original content from this work may be used under the terms of the Creative Commons Attribution 4.0 licence. Any further distribution of this work must maintain attribution to the author(s) and the title of the work, journal citation and DOI.
1. Introduction
Chitosan and its derivatives are a good choice as a polymeric matrix owing to their use in novel applications related to food science and packing technology [1]. The main requirements for polymeric composites for use in the packaging industry can be summarized as follows; They should have a good barrier to light, water vapor and oxygen, good mechanical performance and adequate thermal stability so that manufactured products made of polymeric composites will be worthy of participating in the packaging market. The necessity of using polymeric composites with adequate mechanical properties is related to maintaining food quality; And their ability to endure any kind of external force or stress that may occur at various stages of manufacturing, subsequent shipping, handling, and storage of prepackaged food [2]. The most common mechanical parameters governing mechanical characterizations of polymeric composites are related to modulus of elasticity, Young's modulus, tensile strength, and elongation of the fracture [3–5]. In addition, the thermal property of polymeric composites is a major factor in the packaging industry; Means how strong it is against potential thermal shocks to withstand the heat coming from the environment during storage or transportations. The thermal parameters of polymeric composites monitoring the thermal stability (the glass transition temperature, melting point temperature, degradation temperature, and crystallization percent) can be assessed using differential scanning calorimetry and thermogravimetric analysis. It is so important to determine the glass transition temperature at which the polymer composites transform from glassy to rubbery state, at which they are losing their physical properties [6].
The current progress in the field of polymeric materials science is mainly related to the blending of nanoparticles fillers with the polymeric materials for producing new polymeric inorganic nanocomposite materials characterized with enhanced properties. The introduction of nanoparticle fillers promotes physical and chemical modifications relating to the geometric properties and the nature of its interaction with the main polymeric matrix; large surface to volume ratio enhances the nanofiller particles-matrix interactions. These modifications are strongly depending on size, shape, concentration, dispersion and surface treatment of nanofiller. However, one of the most challenges in this context is how to control the polymeric nanocomposites fabrication with improved properties; such as decreasing of the filler aggregations, keeping of the homogeneity distribution of the nanoparticle's fillers [7, 8].
Metal oxides are a good choice for blending and dispersing with polymeric materials for functional devices, owing to their practical properties; electron transport, magnetoresistance, ferromagnetism, ferroelectric property, catalysis, luminescence, their stability in air and water. Cerium oxide and its based nanomaterials are very interesting materials owing to their efficiency in various applications, such as electrolytes for electrochemical devices [9], UV absorbed materials used for sunscreens [10], oxygen storage [11], hybrid solar cells [12], and luminescent materials for violet/blue fluorescence [13]. Moreover, ZrO2 material is a good choice as a filler material, owing to its good physical and chemical properties [14, 15]. Therefore, it has been concluded in a various kind of applications, such as refractory products, ceramics, and electronic devices [16–19].
Notably, CeO2-NPs have the ability to prevent the accumulation of reactive oxygen species (ROS) and cellular damage, as well as reduce inflammation to provide a more appropriate topical treatment [20] and have revealed excellent properties such as biocompatibility, antibacterial and autocatalytic [21]. Recently, PVA/CS hydrogels containing 0.5 and 1% CeO2-NPs have been successfully produced for wound dressing applications [22] and have made great promise for the use of CeO2-NPs in hydrogels to improve wound healing. Moreover, the nanocomposite Chitosan/CeO2NPs has been introduced for biomedical applications [23]. The published results also showed that CeO2NP did not cause significant changes in liver enzyme activity, liver and kidney tissues and blood parameters, while it did significantly improve the serum redox status [24]. Additionally, zirconia is of great importance in various sciences and especially in dental sciences [25]. Zirconia is insoluble in water which reflects its stability in a moist environment, thus it reduces bacterial adhesion and has low cell toxicity [26]. Information based on updated literature appears to support the suitability of incorporating these types of metal oxide nanoparticles into polymeric compounds. The formation of solid-solution of cerium oxide and zirconium oxide can be done by different methods; high-temperature calcinations, high energy mechanical milling, sol-gel technique, surfactant-assisted approach, microemulsion, coprecipitation, and chemical filing. It can be used as filler in different kinds of composites for wide range of applications in catalysts, fuel cell, ceramics, gas sensors, solid-state electrolytes. The cerium oxide-zirconium oxide nanocomposites improve the catalytic performance, owing to their high specific surface areas and high oxygen storage capacities [27–40].
Chitosan is extracted from the shells of crustaceans, shrimp and lobsters as waste products left behind seafood processing industries [41, 42]. Inaddition, the extensive deacetylation of chitin leads to the formation of chitosan [43]. Its solubility in aqueous solutions and capacity for forming complexes depends mainly on its degree of deacetylation and crystallinity [44]. The importance of chitosan returns to its multiple functional groups, in addition to its excellent properties such as biodegradability, biocompatibility, antibacterial, nontoxicity, absorption properties which making it as one of the most recommended and suitable functional materials for various application such as biosensors, separation membrane, tissue engineering and waste water treatment [41]. Chitosan has also the capability to adsorb various kinds of metal ions via the chelation sites of its amino groups by ion-exchange and complex reactions [41, 44]. Increasing of the amine group contents by possible chemical modification would improve its selectivity and adsorption capacity.
Gelatin as type A or B are considered as the most common protein, which can be obtained by hydrolysis of the collagen from bones and skins by assisting of acidic or alkaline pretreatment [45, 46]. It has a good film-forming property, non-toxic, biodegradable, biocompatible, hemostatic and a porous soft layer material [47, 48]. Physical and chemical characterizations of pure chitosan can be improved by polymer blending processes especially with gelatin [49–52]. This combination of chitosan and gelatin provides improvements in obtaining a new biocomposites for tissue engineering [53–57]. In addition, further improvements in the physical and chemical properties of chitosan-based nanocomposites could be obtained through doping with metallic oxides nanoparticles. NiFe2O4 and ZnO/chitosan biosensor have been reported for sensing H2 and urea [58–62]. SnO/chitosan biocompatible sensors have been prepared for cholesterol detection. In Fe3O4/chitosan, the absorption efficiency has been improved as well as absorption wavelength moved toward the visible-region [51–66]. For mechanical parameters enhancements of chitosan, various kinds of nanoparticles are incorporated, such as nanoclay [67, 68], nanohydroxyapatite [69], nanometal oxides [70–73], and graphene oxide (GO) [74, 75].
One of the trickiest challenges in the polymer industries and applications is its thermal stability. There are a considerable variety of factors with several effects make it difficult to study the mechanism and kinetics of reactions, such as specific area and porosity, layer thickness, formation and growth of new crystallization nuclei, reconstruction of solid state crystal lattice, amount and distribution of the active centers on solid state surface, diffusion of gaseous reagents or reaction products materials heat conductance and static or dynamic character of the environment, etc Nowadays, DTA (differential thermal analysis), TG (thermogravimetry) and DSC (differential scanning calorimetry) have been used successfully for characterizing the transformation processes of precipitation of solids during isothermal processes or non-isothermal heating [76–81]. The regular kinetic analysis is performed on the experimental data to provide mathematical description of the thermal processes with the characteristic kinetic triplet i.e., Ea, A, and g(α). This information can be directly applied for fabrication various metals and alloys, ceramics glasses, cement, natural polymers and composite materials [82].
In this work, for first time, Cerium (IV)-Zirconium (IV) oxide (as a solid solution) nanoparticles (CeO4ZrNPs) was incorporated into Chitosan/15 wt.% Gelatin nanocomposite with different quantities. Structural, morphological, mechanical, and thermal properties of the obtained chitosan-based nanocomposites are presented. Moreover, phase transition temperature (Tg) and non-isothermal degradation processes were examined using Differential Scanning Galorimetry (DSC) with different heating rates. Kinetic parameters were evaluated using Kissinger-Akahira-Sunose (KAS) and Kissenger (KIS) procedures.
2. Materials and methods
Chitosan powder of average molecular weight (100, 000–300, 000) and molecular formula (C6H11NO4)n. Gelatin type A were obtained from ACROS Organics. Cerium (IV)-zirconium (IV) oxide of molecular formula (CeO4Zr) and particle size of less than 50 nm was obtained from Sigma-Aldrich. A mixture of 50 ml distilled water, 2 % acetic acid and the desired amount of chitosan were magnetically stirred at 25 °C for 3 h. The prepared chitosan solution was added to a previously prepared gelatin solution. Different amounts of x (wt.) % of CeO4Zr NPs (x = 0, 1, 3, 5, 10, 20 and 30) were sonicated for 2 h in 10 ml distilled water, then later on slowly added into the obtained solution and stirred for 1 h. The resulted solutions were distributed into leveled hydrophobic polystyrene Petri dishes (10 cm diameter). To get the desired films, the solution was left to dry for 24 h at 40 °C. Films were finally peeled off from the trays and placed in sealed containers to avoid moisture exchange. The morphology of CeO4ZrNPs was investigated using HRTEM (JEM 21OO HRT made in Japan, with accelerating voltage = 200 KV and resolution of 0.2 nm). The chitosan based nanocomposites (CS, and x-CG, x = 0, 3, and 10) were investigated using spectrophotometer in the spectral range 400–4000 cm−1, with a resolution of 4 cm−1 (JASCO, FTIR-300 E.), optical microscopy equipped with a camera, Atomic Force Microscopy AFM (Dimension® Edge TM, Bruker) under tapping mode operation, Scanning Electron Microscope SEM (JEOL-JSM-T330) operated at 25 kV. Young's modulus and strain % were estimated using calibrated bench top tensile test setup attached with direct controlled drive linear motor XY stage and tension force sensor (type K-100 of measuring range of 1–100 KN, Lorenz Messtechnik GmbH) with strain rate of 10 mm min−1. DSC measurements were carried out by NETZCH DSC 204 f1 phoenix. Samples (CS, and x-CG, x = 0, 3, and 10) of about 4 ± 0.1 mg mass were used for the experiments varied out at heating rates of 10 °C, 20 °C, 30 °C and 40 °C min−1 up to 500 °C under N2 at a flow rate of 50 ml min−1. The samples were loaded without pressing into an open of 6 mm diameter and 3 mm high purity platinum crucible using an empty platinum crucible as a reference. The DSC curves were recorded simultaneously with 0.1 mg sensitivity. Due to the potential effect of moisture content in determining the Tg of biopolymers, DSC data of each film were collected during the second heating run from 30 to 200 °C at a rate of 20 °C min−1, after the first run of heating up to 110 °C and cooling to 30 °C at the same rate of 10 °C min−1. Dry nitrogen was used as the purge gas at a flow rate of 50 ml min−1.
3. Results and discussion
3.1. Characterizations
The Particles size range of incorporated CeO4Zr NPs was in nm scale, as deduced by broadening x-ray diffraction pattern and TEM micrograph, showing that the particle size are in range of 50 nm (figure 1). Figure 1(c) represents SEM micrograph of CG nanocomposite (x = 3) showing that CeO4ZrNPs are well incorporated in CG nanocomposite. Moreover, CeO4ZrNPs are well distributed with different ratios homogeneously, as represented in bright field optical photographs of figure 2.

Figure 1. TEM micrograph (a), HRTEM micrograph (b), selected area electron diffraction pattern (c), and XRD pattern of CeO4ZrNps (d), and SEM micrograph of CG nanocomposite (x = 3) (e).
Download figure:
Standard image High-resolution image
Figure 2. Bright field optical images of x % CeZrO2NPs/CG, x = 1 (a), 3 (b) and 10 (c), magnification = 50X.
Download figure:
Standard image High-resolution imageFigure 3 shows FTIR spectra of CeO4ZrNPs powder, CS, and x = 0, 3 and 10 CG nanocomposites. The characteristic FTIR bands of the studied nanocomposites were extracted and listed in table 1. FTIR spectra corresponding to the pure CS showed an absorbed broad band centered at 3199 cm−1, which corresponding to the overlapped stretching vibration mode of O–H and N–H groups. In addition, the absorbed bands centered at 2919 and 2852 cm−1, were assigned to the CH2 and CH3 groups which corresponding to CH anti-symmetric and symmetric bands. Moreover, absorbed bands centered at 1536 cm−1 and 1403.8 cm−1 were assigned to amide-II and CH2 bending respectively [83]. Addition of 15 wt.% of gelatin to chitosan, resulted in a slight shift of the chitosan adsorption band (O–H, N–H, 3199 cm−1) to higher wavenumbers (3213 cm−1), referring to the formation of intermolecular hydrogen bonds between chitosan and gelatin. Additionally, the observed shift of the amide-II absorbed bands of the chitosan film from 1536 to 1530 cm−1 indicated to the presence of electrostatic interactions between the amino groups of chitosan and the carboxyl groups of gelatins. This also indicates to the miscibility between chitosan and gelatin in polymer blends which assigned to a specific interaction between the different components. Referring to the obtained results of x = 3 and 10 CG nanocomposites, shown in figure 3 and table 1, a significant shift of the CG absorption bands (O–H, N–H, 3213 cm−1) to higher wavenumbers (3268 cm−1) was observed. However, in case of CG-10, this absorption band was returned back to lower value (3198 cm−1) close to what was observed for CS sample. This suggests that, (OH) and (NH) groups of x = 3 CG nanocomposite are well involved to the coordination of the of CeO4Zr ions. However, in case of x = 10 CG nanocomposite, the huge amount of the CeO4ZrNPs was easy to be accumulated, losing the chance of interaction with the functional groups of CG nanocomposite. The last curve shown in figure 3 represents the FTIR spectra of the CeO4ZrNPs and shows the absorbed bands centered at 3426, 1632, 1552 and 1061 cm−1, which can be attributed to the stretchy vibration of the hydroxyl groups [84], the vibration of the connections Zr–O [85], Ce-O [86] and Zr-O respectively.

Figure 3. FTIR spectra of CS, and x % CeO4ZrNPs/CG nanocomposites, x = 0, 3, 10 and CeO4ZrNPs powder.
Download figure:
Standard image High-resolution imageTable 1. Characteristic FTIR bands of CS, x % CeO4ZrNPs/CG nanocomposites, x = 0, 3, 10 and CeO4ZrNPs powder.
| Sample | –OH, NH2 | C–H | C–H | –NH2 | –C–N– |
|---|---|---|---|---|---|
| CS | 3199.5 | 2919 | 2852.6 | 1536 | 1403.8 |
| x = 0 | 3213 | 2919 | 2852.6 | 1530 | 1403.8 |
| x = 3 | 3268 | 2922 | 2852.6 | 1530 | 1401.8 |
| x = 10 | 3198 | 2919 | 2850.6 | 1536 | 1403.8 |
| CeO4ZrNPs | 3420 | 1632 / Zr-O | 1552 / Zr-O | 1332 / Ce-O | 1061/Zr-O |
Figure 4 represents AFM images of x = 0, 10, 20 and 30 CG nanocomposites. The root mean square roughness (RMS) and particle size of the matrix (nm) were estimated and collected as shown in table 2. It is clear that, by increasing the incorporated CeO4ZrNPs contents in the CG nanocomposites, the roughness decreased from 74.8 nm for CG to 6.1 nm for x = 30 CG nanocomposite, owing to the accumulated CeO4Zr NPs on the particles of the CG matrix and filling the cavities on the surface (figure 5). The average particles size was estimated as 44 nm as shown in table 2. This reflects the influence of the CeO4Zr NPs on the decreasing of the roughness of the CG nanocomposite and improving the surface morphology by making it much smooth.

Figure 4. AFM images of x % CeO4ZrNPs/CG, x = 0 (a), 10 (b) and 20 (c) and 30 (d).
Download figure:
Standard image High-resolution imageTable 2. Particle size and roughness estimated by AFM for x % CeO4ZrNPs/CG, x = 0, 10, 20, and 30 nanocomposites.
| Sample | Particle size of the matrix (nm) | Roughness (nm) |
|---|---|---|
| x = 0 | 44 | 74.8 |
| x = 10 | 44 | 16 |
| x = 20 | 45 | 6.9 |
| x = 30 | 47 | 6.1 |
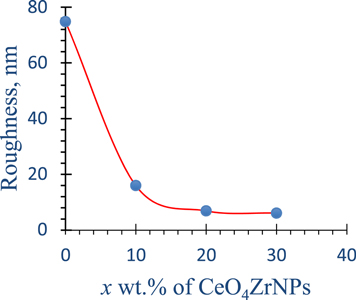
Figure 5. Roughness estimated by AFM analysis for x % CeO4ZrNPs/CG, x = 0, 10, 20, and 30 nanocomposites.
Download figure:
Standard image High-resolution image3.2. Mechanical properties
Figure 6 represents tensile stress against strain for x% CeO4ZrNPs/CG, x = 0, 1, 5, 10, 20 and 30 nanocomposites thin films. The extracted mechanical parameters are estimated and collected in table 3. It is obvious that, nanocomposites thin films exhibited an increasing of bearing resistance force against the tensile force as incorporated CeO4Zr NPs contents increased; strength (MPa) and young's modulus (GPa) increased straightly from 24.6 and 1.36 for CG to 122.6 and 2.99 for x = 30 CG nanocomposite, respectively. Moreover, CG nanocomposites exhibited improved strain %, from 1.8 for CG to maximum value of 5.5 % for x = 10 CG nanocomposite, while the increasing of CeO4ZrNPs more than 10 % caused a decrease of strain % from 5.5 to 4.1 for x = 20 and 30 CG nanocomposites. This improvement of mechanical properties has been observed even for high concentration of CeO4ZrNPs (30%), which is referring to the well dispersion of the metal-oxide nanoparticles through the host material.
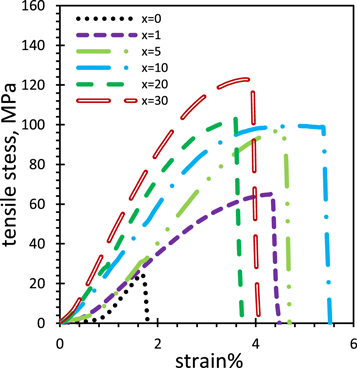
Figure 6. Tensile stress against strain of x%CeO4ZrNPs/CG, x = 0, 1, 5, 10, 20, and 30 nanocomposites.
Download figure:
Standard image High-resolution imageTable 3. Mechanical properties of x % CeO4ZrNPs /CG, x = 0, 1, 5, 10, 20 and 30 nanocomposites.
| Sample composition (x) | Strength (MPa) | Strain% | Young's Modulus (GPa) |
|---|---|---|---|
| 0 | 24.6 | 1.8 | 1.36 |
| 1 | 64.8 | 4.4 | 1.47 |
| 5 | 98.9 | 4.7 | 2.10 |
| 10 | 99.3 | 5.5 | 1.80 |
| 20 | 103 | 3.7 | 2.78 |
| 30 | 122.6 | 4.1 | 2.99 |
The mechanical properties for the obtained chitosan-based nanocomposites were greatly increased as shown in figure 6 and table 3, which is attributed to the beneficial effects of the dispersed CeO4ZrNPs to produce a strong interfacial bonding with high ability to transfer the mechanical loads from the matrix to CeO4ZrNPs network [69–71]. A similarly large increase in mechanical properties for chitosan based nanocomposite has been reported previously, and has been connected to the enhanced stiffness of polymer chains, owing to the reinforce effect of the nano-filler [87].
3.3. Thermal analysis of pure chitosan
Figure 7(a) shows the DSC data of CS at heating rate of 30 °C min−1. The glass transition temperature of CS was estimated as 121 °C. Figure7(b) represents DSC curves of CS at different heating rates (b = 10 °C, 20 °C, 30 °C, 40 °C min−1) in non-isothermal conditions. These curves showed an endothermic peak (peak 1) corresponding to the dehydration of water molecules followed by a crystalline melting endothermic peak (peak 2). The third one was assigned as an exothermic peak (peak 3) ascribed to the thermal degradation (first stage of the chitosan degradation), including dehydration of the saccharide rings, de-polymerization, and decomposition of the acetylated and de-acetylated units of chitosan [88, 89]. Increasing of heating rates leads to an increasing of amplitude of the thermal peaks with peak position shift to higher temperature. It is clear that the characteristic temperature of the thermal degradation is a heating rate dependent and increase linearly. Following Kissinger-Akahira-Sunose (KAS) [90], the apparent activation energy (Ea) and the other kinetic parameters of the thermal degradation are obtained for the CS using the thermal analytical data. Focusing on the first thermal degradation peak of CS (peak 3), the peaks temperatures (Tm
) with different heating rates values obtained from figure 7(b) enabled us to evaluate the activation energy by plotting the dependence of ( ) on
) on  as shown in figure 7(c). According to the following equation:

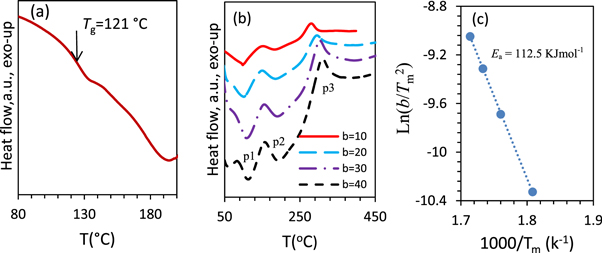
Figure 7. DSC signals of CS with the position of the glass transition temperature marked by arrows at the midpoint of the glass transition step (a), heat flow with temperature at different heating rates (°C/min) (b), and corresponding Kissinger plot of Ln(b/Tm 2) versus (1000/Tm) for the chitosan (c).
Download figure:
Standard image High-resolution image
Ea of CS was estimated as 112.5 KJ mol−1. Moreover, the partial integrations of the first thermal degradation peak as a function of temperature, at different heating rates, are estimated as an evaluation of the thermal degradation fraction ( %) change with increasing of temperature (figure 8(a)). These enabled us to estimate Ea as a function of
  % (figure 8(b)). At certain
  % (from 10% to 90% step 10%), the estimated activation energies of the degradation process show a decrease from 172 KJ mol−1 to 92 KJ mol−1, with Ea of an average value 125.5 KJ mol−1 (figure 8(c) and table 4) figure 8(d) represents Avrami plots as the relation between Ln (b) with Ln [-Ln (1-
 )]. The lines slopes, which is correspondence of the growth exponents (n), are estimated and drawn as a function of a temperature (figure 8(e)) [91, 92]. The growth exponent decreases by increasing of T from 1.37 to 0.97, with an average value of 1.17. In addition, the most probable mechanism function g(
 ) of the first thermal degradation of CS is determined by plotting ln [g(
 )] versus ln (b) (figure 8(f)), using the following equation [41, 76, 93–96]:

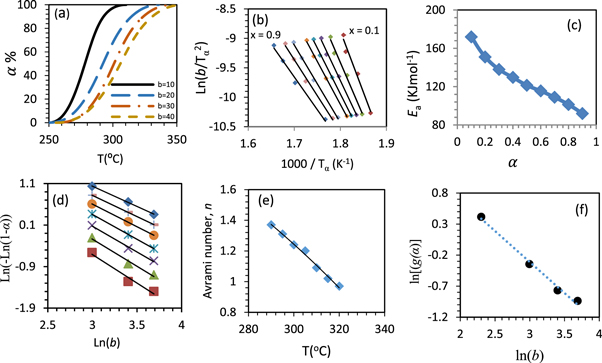
Figure 8. Decomposition fraction percent ( %) with temperature (a), corresponding iso-conversional plots at various conversion degree drawn according KAS calculation procedure (b), activation energy against
  (c), Avrami plot at different
  % (d), Avrami number with temperature (e), and ln[g(α)] against ln(b) for the first thermal degradation of chitosan (f).
Download figure:
Standard image High-resolution imageTable 4. Activation energy Ea, pre-exponential factor A, change of entropy ΔS≠, enthalpy ΔH≠, and Gibbs free energy ΔG≠ at different thermal degradation fraction (α %) for chitosan, as following KAS procedure.
| Sample | α | Ea Kj mol−1 | AS−1 | ΔS#Kj mol−1 | ΔH#Kj mol−1 | ΔG#Kj mol−1 |
|---|---|---|---|---|---|---|
| Chitosan | 0.1 | 172 | 2.11E + 14 | 15.94825 | 167.45 | 158.74 |
| 0.2 | 151 | 1.5E + 12 | −25.2554 | 146.39 | 160.38 | |
| 0.3 | 138 | 7.98E + 10 | −49.7385 | 133.35 | 161.15 | |
| 0.4 | 129.7 | 1.22E + 10 | −65.4248 | 125.02 | 161.87 | |
| 0.5 | 121.4 | 1.88E + 09 | −81.0154 | 116.68 | 162.65 | |
| 0.6 | 115.6 | 5.86E + 08 | −90.7811 | 110.85 | 162.71 | |
| 0.7 | 108.9 | 1.33E + 08 | −103.168 | 104.11 | 163.50 | |
| 0.8 | 101.4 | 24731361 | −117.237 | 96.57 | 164.68 | |
| 0.9 | 92 | 3467274 | −133.679 | 87.11 | 165.78 | |
| average | 125.55 | 2.36E + 13 | −72.26 | 120.84 | 162.39 |
The linear regression of the least square's method is used for different algebraic expressions of g ( ) function, looking for the straight line with a slope equal to −1.000, for which the linear correlation coefficient R2 was close to unity. Consequently, the most probable mechanism function g(
 ) was determined as [-ln (1-
 ) 2/3], which is related to the random nucleation mechanism with subsequent growth, n = 1.5. The pre-exponential factor A is then evaluated from equation (1) and listed in table 4. It is obvious that, A decreases by increasing of
  % with average value 2.36*1013 s−1. These values of activation energy and pre-exponential factor A are in good agreement with earlier reported ones [97, 98]. Knowing of E and A values following KAS procedures, the change of entropy ΔS#
, enthalpy ΔH#
, and the Gibbs free energy ΔG#
for the formation of the activated complex from the reagent are evaluated and listed in table 4.
% with average value 2.36*1013 s−1. These values of activation energy and pre-exponential factor A are in good agreement with earlier reported ones [97, 98]. Knowing of E and A values following KAS procedures, the change of entropy ΔS#
, enthalpy ΔH#
, and the Gibbs free energy ΔG#
for the formation of the activated complex from the reagent are evaluated and listed in table 4.
3.4. Thermal analysis of CeO4ZrNPs/chitosan/Gelatin nanocomposites
Figure 9(a) represent DSC signals of x = 0, 3 and 10 CG nanocomposites prior degradation stage. It is observed that, peaks (1 & 2) are shifted to higher temperatures for x = 3 CG nanocomposite, while they shifted to lower temperature in x = 10 CG nanocomposite. Regarding to peak (3), which is corresponding to the first thermal degradation process, its centered temperature is shifted to higher values for x = 3 and 10 CG nanocomposites as shown in figure 9(b). Figure9(c) represents Tg of x = 0, 3 and 10 CG nanocomposites. Tg is enhanced from 121 °C for CS (as shown previously) to 141 °C for CG(x = 0), referring to the effective role of 15 wt.% gelatin added to chitosan resulting in thermal stability improvement. Tg showed further enhancing to 152.7 °C and 159.2 °C, for x = 3 and 10 CG nanocomposites, respectively. Figures 9(d)–(f) represents the effect of heating rates on peak (3). It is obvious that, the peak position is shifted to higher temperature with higher amplitude, as heating rate increases. These data were used to follow the activation energy of nanocomposites as increasing of CeO4ZrNPs contents. Figure 10 represents Kissinger plot of the peak (3). The estimated Eg were 202.86, 166.1 and 141.58 KJ mole−1 for x = 0, 3 and 10 CG nanocomposites, respectively. Figure 11 represents the effect of different heating rates on the behavior of peaks (1&2) for x = 0, 3, 10 CG nanocomposites. By increasing of the heating rate, the peaks amplitude increased and their characterized temperature are shifted to higher values. Moreover, the thermal phase transition at Tg becomes more observable (especially for heating rate = 30 and 40 °C for x = 10 CG nanocomposite), indicating the effect of 10 wt% of CeO4Zr NPs contents on the glass-crystal phase transition process.

Figure 9. Heat flow with temperature during the first heating run representing vaporization and crystallization melting peaks (P1&P2) (a), during the second heating run representing the decomposition peaks (P3) (b), and the glass transition temperatures (Tg) (c), and during the first heating run at different heating rates for x % CeO4ZrNPs/CG nanocomposites, x = 0 (d), 3 (e) and 10 (f).
Download figure:
Standard image High-resolution image
Figure 10. Kissinger plot for the first thermal decomposition of x % CeO4ZrNPs/CG nanocomposites, x = 0, 3 and 10.
Download figure:
Standard image High-resolution image
Figure 11. Heat flow with temperature for peaks (1&2) at different heating rate for x % CeO4ZrNPs/CG nanocomposites, x = 0 (a), 3 (b) and 10 (c).
Download figure:
Standard image High-resolution imageFigure 12 shows the decomposition fraction percent (α%), the corresponding Avrami plots and the estimated Avrami numbers (growth exponent) with temperature for x = 0, 3 and 10 CG nanocomposites. It was found that the growth exponent values as a function of temperature and its ranges are (α %) and x contents dependent. It decreases in different ranges of 1.45–0.6, 2.07–1.06, and 1.95–0.41 as temperature increases for x = 0, 3 and 10 CG nanocomposites, respectively. Figure 13 represents the activation energy of the first thermal degradation of the nanocomposites as the line slopes of Ln (b/Tα 2) versus (1000/Tα ) at different (α). Figure 14 shows how the activation energy of the first thermal degradation process for the nanocomposites of different compositions varies with the conversion degree (α). It is clear that Ea against α for x = 0, 3 and 10 nanocomposites behaved with different ways. Ea increases with increasing of α for x = 0 and 10 nanocomposites, while it decreases for pure CS (as mentioned before) and as well for x = 3 CG nanocomposite. Figure 14(b) shows results of the least square method of the most probable mechanism function [g(α)] which was assigned as g(α) = [1-(1- α) 1/4 ] for x = 0 and g(α) = [-ln(1-α)] 2/3 for x = 3 and 10 CG nanocomposites. The kinetic parameters (A, ∆S#, ∆H#, ∆G#) of the thermal degradation for x = 0, 3, 10 CG nanocomposites are consequently evaluated and listed in table 5.
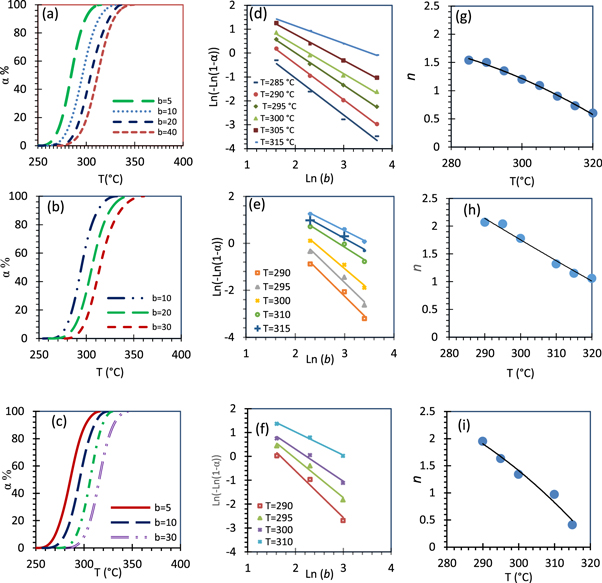
Figure 12. Decomposition fraction percent (α %) with temperature (a)–(c), Avrami plots for the non-isothermal decomposition (d)–(f), and Avrami number with temperature (g)–(i) of x % CeO4ZrNPs/CG nanocomposites, x = 0, 3 and 10.
Download figure:
Standard image High-resolution image
Figure 13. Reprehensive of the Ln(b/Tα 2) as a function of the inverse of temperature (1000/Tα ) calculated at different values of the decomposition fraction (α) for x % CeO4ZrNPs/CG, x = 0, 3 and 10. The trend line is presented for each α value.
Download figure:
Standard image High-resolution image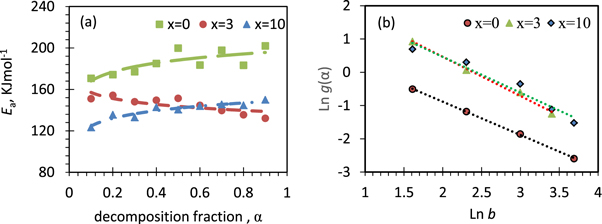
Figure 14. Activation energy as a function of decomposition fraction (α) and plot of Ln[g(α)] against Ln(b) for thermal degradation of x % CeO4ZrNPs/CG, x = 0, 3 and 10, representing the most probable mechanism function g(α ).
Download figure:
Standard image High-resolution image
Table 5. Activation energy, pre-exponential factor, the change of entropy ΔS≠, enthalpy ΔH≠, and the Gibbs free energy ΔG≠ at different α% for x % CeO4ZrNPs/CG, x = 0, 3 and 10 nanocomposites, following KAS procedure.
| Sample | α | Ea Kj mol−1 | A S−1 | ΔS#Kj mol−1 | ΔH# Kj mol−1 | ΔG# Kj mol−1 |
|---|---|---|---|---|---|---|
| x = 0 | 0.1 | 170.69 | 4.23E + 12 | −16.78 | 168.29 | 177.72 |
| 0.2 | 174.26 | 1.31E + 13 | −7.48 | 171.82 | 176.06 | |
| 0.3 | 177.09 | 2.76E + 13 | −1.32 | 174.61 | 175.36 | |
| 0.4 | 185.07 | 1.73E + 14 | 13.88 | 182.57 | 174.57 | |
| 0.5 | 199.87 | 4.25E + 15 | 40.44 | 197.34 | 173.93 | |
| 0.6 | 183.49 | 1.33E + 14 | 11.60 | 180.93 | 174.18 | |
| 0.7 | 197.87 | 3.02E + 15 | 37.49 | 195.28 | 173.31 | |
| 0.8 | 183.32 | 2.82E + 14 | 17.71 | 180.69 | 170.22 | |
| 0.9 | 202.03 | 5.92E + 15 | 42.93 | 199.34 | 173.67 | |
| Average | 185.97 | 1.54E + 15 | 15.39 | 183.43 | 174.34 | |
| x = 3 | 0.1 | 151.07 | 4.39E + 11 | −35.61 | 146.39 | 166.41 |
| 0.2 | 154.39 | 1.09E + 12 | −28.15 | 149.67 | 165.65 | |
| 0.3 | 148.16 | 2.90E + 11 | −39.21 | 143.40 | 165.83 | |
| 0.4 | 149.65 | 4.40E + 11 | −35.80 | 144.86 | 165.48 | |
| 0.5 | 151.48 | 6.41E + 11 | −32.72 | 146.67 | 165.61 | |
| 0.6 | 144.66 | 1.70E + 11 | −43.82 | 139.82 | 165.33 | |
| 0.7 | 139.68 | 4.96E + 10 | −54.09 | 134.80 | 166.50 | |
| 0.8 | 135.52 | 1.90E + 10 | −62.13 | 130.60 | 167.32 | |
| 0.9 | 132.19 | 8.73E + 09 | −68.70 | 127.22 | 168.30 | |
| Average | 145.20 | 3.49E + 11 | −44.47 | 140.38 | 166.27 | |
| x = 10 | 0.1 | 123.30 | 8.45E + 08 | −87.65 | 120.86 | 170.43 |
| 0.2 | 135.52 | 1.57E + 10 | −63.44 | 133.05 | 169.21 | |
| 0.3 | 133.02 | 1.00E + 10 | −67.25 | 130.51 | 169.18 | |
| 0.4 | 142.75 | 8.74E + 10 | −49.26 | 140.22 | 168.65 | |
| 0.5 | 140.51 | 5.55E + 10 | −53.08 | 137.95 | 168.74 | |
| 0.6 | 143.83 | 1.21E + 11 | −46.64 | 141.27 | 168.39 | |
| 0.7 | 145.50 | 1.93E + 11 | −42.76 | 142.90 | 167.90 | |
| 0.8 | 144.66 | 1.36E + 11 | −45.75 | 142.04 | 168.95 | |
| 0.9 | 149.98 | 4.43E + 11 | −35.97 | 147.34 | 168.62 | |
| Average | 139.90 | 1.18E + 11 | −54.64 | 137.35 | 168.90 |
In General, the thermal analysis confirmed the impact of CeO4ZrNPs contents on the thermal properties of CG nanocomposites. Tg was shifted to higher temperature referring to the enhancement of thermal stability of the chitosan based nanocomposites. CG(x = 0) nanocomposite showed the highest value of Ea. Moreover, Ea and n exhibited (α) dependent for all studied samples. CG(x = 0) showed the highest value of A which connected with the estimated positive value of ∆S#, while ∆S# of the rest of compositions were negative. The ∆S# negativity (as the average value) increased by the increase of the incorporated CeO4ZrNPs contents (table 5). This confirmed that the structure of the host material becomes more order with CeO4ZrNPs incorporations. It is obvious that, the ΔH# values are all positive indicating that the involved reaction related to the degradation process is a thermodynamically unfavorable endothermic process. In addition, ΔG is almost constant with increasing of (α) for compositions. Moreover, it is noticed that all of Ea, ΔH# and ΔG# values are positive. Therefore, the first degradation of CG nanocomposites could be described as a non-spontaneous process.
4. Conclusions
It was concluded that incorporating of CeO4ZrNPs significantly improved the structural, morphological, mechanical, and thermal properties of the chitosan-based nanocomposites. Structure analysis represented a well incorporation of the CeO4ZrNPs as inferred by FTIR, SEM, and OM. AFM analysis identified a significant enhancement of surface roughness. Young's modulus and strain% were significantly improved (from 1.36 GPa and 1.8 to 2.99 GPa and 4.1 for x = 0 and 30, respectively). In addition, the glass transition temperature was shifted to higher temperatures (from 121 °C for CS to 159 (x = 10). The activation energy was enhanced from 125.55 KJ mol−1 (CS) to 202.86 KJ mol−1 (CG). The host material structure became more ordered with the increase of CeO4ZrNPs contents, as inferred from the increase in the negativity of ∆S#. The estimated kinetic parameters confirmed that the first degradation of CG nanocomposites can be characterized as a non-spontaneous process. The resulting information indicated the importance of CeO4Zr nanoparticles dispersion to enhance the physical properties of chitosan to be amenable to various applications such as food packaging industry.
Acknowledgments
The authors would like to thank Taif University for its financial support. This research was fully funded by the Deanship of Scientific Research, Taif University, KSA. [Research group number: 1-441-92].
Data availability statement
All data that support the findings of this study are included within the article (and any supplementary files).