

Abstract
Er3+ doped Lu2O3 single crystal with high optical quality was successfully grown by Floating zone (Fz) method. The spectral properties and Judd-Ofelt (JO) analysis were reported. The absorption cross section at 971 nm was 1.5 × 10⁻²¹ cm2. The emission cross-section at 1558 and 2742 nm was calculated to be 2.20 × 10⁻²⁰ cm2 and 3.22 × 10⁻²⁰ cm2, respectively. The fluorescence lifetime of 4I11/2 and 4I13/2 energy level was fitted to be 1.59 ms and 12.43 ms. Meanwhile, the positive gain cross-section was achieved in 1.5 μm and 2.8 μm with inversion ratio P = 0.5. The low inversion ratios indicate a great potential of Er:Lu2O3 crystal with good gain performance.
Export citation and abstract BibTeX RIS
1. Introduction
Rare earth doped luminescent materials have been widely applied in many fields such as integrated optical systems, high-definition displays, solid-state laser emitters and bioanalyzers due to their excellent luminescent properties, and have broad application prospects [1]. Er doped laser materials have attracted increasing interests due to their various important applications in the visible and mid-infrared (at 1.5 μm and 2.8 μm) wavelength regions. Laser operations of Er3+ at 2.8 μm corresponding to 4I11/2 → 4I13/2 transitions attract much more attentions because it can be used for far-infrared optical parametric oscillators (OPO) applied in scientific research, atmospheric pollution monitoring and directional infrared countermeasure [2]. In addition, laser at 2.8 μm can be used for medical treatments because of the strong water absorption in this region. The absorption efficiency of water molecule on Er3+ based 2.8 μm laser is 200 times than that of Ho3+ based 2.1 μm laser, 10 000 times than that of Nd3+ based 1.06 μm laser. Er3+ based 2.8 μm laser could cut and remove soft tissue and bones accurately, and it is known as the 'Gold Laser' of stomatology [3–5]. However, the lifetime of the upper level 4I11/2 is considerably shorter than that of the lower level 4I13/2. The laser transition will be prevented by the accumulation of population in the 4I13/2 level, and this is known as the 'self-terminating' effect [6]. The unfavorable fluorescence lifetime ratio of the two laser levels impedes the improvement of Er3+ based 2.8 μm lasers. Typically, there are two major solutions: Er3+ heavily doping or co-doping deactivating ions Pr3+ [7]. Both solutions could reduce the fluorescence lifetime gap between the 4I11/2 and 4I13/2 level, thus makes stable continuous-wave 2.8 μm laser possible and could further improves the spectroscopic properties and laser performance.
The cubic sesquioxide crystal Lu2O3 has attracted widely attention as the host for laser crystals, it owns better abilities of low phonon energy (618 cm−1), high thermal conductivity (12.8 W·m−1·K−1) and robust thermal stability compared to the most common host material YAG (Y3Al5O12) [8, 9]. However, the growth of Lu2O3 single crystal is particularly difficult because of the high melting point (∼2450 °C) [9]. Few high-quality Lu2O3 crystals have been obtained. For Er3+ based oxide crystals, such as GYSGG [10], GSGG [11], GGG [7], YSGG [12], YAG [12], SrLaGa3O7 [13], BaLaGa3O7 [14], CaLaGa3O7 [15] and SrGdGa3O7 [16] etc, the doping concentrations of Er3+ are higher Lu2O3 crystal and fluoride crystals such as CaF2 [17] and SrF2 [17]. The laser performance of Er:Lu2O3 have been reported with cw output power of 1.4 W and slope efficiency of 36% at 2.85 μm [18]. However, high doping concentration decreases the thermal conductivity of crystal and extremely shorten lifetime of the upper level. Moreover, Lu2O3 crystal also has higher thermal conductivity than CaF2 crystal and SrF2 crystal in low doping concentration [19, 20]. So far, there are few studies of optical characteristics of Er:Lu2O3 crystals have been investigated.
In this work, we report on the growth and spectroscopic properties of Er3+ doped Lu2O3 laser crystal. 1.5.at% Er:Lu2O3 single crystal with high optical quality was grown by Floating zone (Fz) method. The crystalline quality of the as-grown Er:Lu2O3 crystal was investigated by x-ray diffraction (XRD). The radiative lifetimes of the relevant excited states of Er3+ were calculated by the Judd–Ofelt (J–O) theory. A detailed spectroscopic properties of the 1.5 at% Er:Lu2O3 crystal was performed. Absorption and luminescence spectra were presented and emission cross-sections were calculated for the 1.5 μm and 2.8 μm laser transitions. In addition, we compare the optical characteristics of Er doped Lu2O3 crystals with other materials in 2.8 μm.
2. Experimental procedure
2.1. Crystal growth
The Er doped Lu2O3 crystal was designed according to the formula (ErxLu1−x)2O3 (x = 0.015). The raw materials were Lu2O3 (99.99%) and Er2O3 (99.99%) powders. The oxides were weighed accurately and mixed in a beaker and then shaped into two rods. After pressed at 220 MPa for 3 min, the two rods were sintered in air at 1700 °C for 24 h. One was used as the feed rod and the other was used as the seed rod. The two rods should be placed on a same vertical axis during the growth process. The crystal was grown in high-purity argon gas atmosphere with a rotation rate of 8–10 rpm and growth rate of 1–2 mm h−1 for both rods. Then the grown Er:Lu2O3 was cooled to room temperature. The samples of Er:Lu2O3 crystal were cut and polished on both sides. The samples are transparent and crack-free with the dimensions of 5 mm × 5 mm × 1.22 mm is shown in figure 1.

Figure 1. The as-grown sample of Er:Lu2O3 crystal.
Download figure:
Standard image High-resolution image2.2. Spectra measurements
The crystal structure was studied by x-ray powder diffraction (XRD) using Ultima IV diffractometer, with data of 2θ from 10° to 80°. The absorption spectrum were recorded by a spectrophotometer (PE Lambda 900 UV/VIS/NIR) with a spectral interval of 1 nm. The concentrations of the Er ions in Er:Lu2O3 crystal were measured by inductively coupled plasma-atomic emission spectrometry (ICP-AES). The fluorescence spectra in 1.5 μm and 2.8 μm region were excited with a InGaAs laser diode emitting at 976 nm. In addition, the fluorescence decay curves at 1558 nm and 2742 nm were measured with excitation of a 976 nm InGaAs laser diode. All the measurements were performed at room temperature.
3. Results and discussion
The XRD pattern of the 1.5 at% Er:Lu2O3 crystal is shown in figure 2. All the diffraction peaks of Er:Lu2O3 are sharp and consistent well with the standard pattern of JCPDS#86–2475 of Lu2O3. The lattice parameters of 1.5 at% Er:Lu2O3 crystal are a = b = c = 10.3709 Å, α = β = γ = 90°. The values are smaller that of pure Lu2O3 crystal (a = b = c = 10.390 Å). According to ICP analysis, the Er3+ concentration Nc was 4.3 × 1020 cm3. The absorption spectrum of Er:Lu2O3 crystal at room temperature is shown in figure 3. Eleven absorption bands centered at 378, 410, 446, 455, 490, 523, 545, 657, 797, 976 and 1520 nm corresponding to the transitions the ground state 4I15/2 to the excited states of 4G11/2, 2H9/2, 4F3/2, 4F5/2, 4F7/2, 2H11/2, 4S3/2, 4F9/2, 4I9/2, 4I11/2 and 4I13/2, respectively. The 1.5 at% Er:Lu2O3 crystal exhibits two strong absorptions at 971 nm and 1536 nm. The absorption cross-section can be calculated by the following equation:

Where λ is the wavelength, L is the thickness of the crystal, OD is the optical density and Nc is concentration of Er3+ ions in Er:Lu2O3 crystal. The absorption cross-section at near 971 nm and 1536 nm are 0.15 × 10⁻²⁰ cm2 and 1.07 × 10⁻²⁰ cm2, and the FWHMs are 18.3 nm and 12.3 nm, respectively. The large absorption cross-section is beneficial to absorp the pumping sources. In addition, the broader FWHMs can decrease the temperature dependence of the diode laser and improve laser efficiency.

Figure 2. Powder XRD pattern of the Er:Lu2O3 crystal.
Download figure:
Standard image High-resolution image
Figure 3. The absorption spectrum of Er:Lu2O3 crystal at room temperature.
Download figure:
Standard image High-resolution imageThe Judd-Ofelt theory [21, 22] is widely used for the calculation of spectroscopic parameters of rare earth ion-doped crystals. In this work, spectroscopic parameters of Er:Lu2O3 crystal were calculated with J-O theory. Eleven absorption bands in the visible and infrared spectra ranges correspondjing to the transition of Er3+ from the ground state 4I15/2 to the excited states are utilized to fit the transition intensity parameters Ωt (t = 2, 4, 6). All the final states are assigned and marked in figure 3. The main equations of J-O theory and the detailed reviews are applied in the following analysis procedure [23, 24]. The refractive index of cubic Er:Lu2O3 crystal is calculated with the Sellmeier equation as follows [25]:

where the values of D1, D2, D3 and D4 in the Sellmeier equation are 3.619 68, 0.041 31, 0.0238 and 0.008 56, respectively.
In this work, the calculated values of average wavelength λ, refractive index n, experimental oscillator strength fexp , the experimental electric dipole line strength Sexp and the calculated electric dipole line strength Scal are presented and summarized in table 1. The fitting quality, which is characterized by the relative square deviation between the measured and calculated electric-dipole oscillator strength, can be expressed by:

Table 1.
The average wavelength  refractive indices (n), experimental and calculated line strength of Er3+ in Er:Lu2O3 crystal.
| Final states (ground state 4I15/2 ) | λstart–λend |
 (nm) (nm) |
ƒexp(×10−6 ) | Sexp (×10–20 cm2) | Scal (×10–20 cm2) |
|---|---|---|---|---|---|
| 4I13/2 | 1426–1609 | 1520 | 1.601 | 1.956 | 1.998 |
| 4I11/2 | 955–1004 | 976 | 0.423 | 0.329 | 0.647 |
| 4I9/2 | 789–807 | 797 | 0.351 | 0.222 | 0.179 |
| 4F9/2 | 643–672 | 657 | 1.768 | 0.914 | 1.088 |
| 4S3/2 | 537–559 | 545 | 0.772 | 0.327 | 0.274 |
| 2H11/2 | 501–536 | 523 | 8.862 | 3.595 | 4.461 |
| 4F7/2 | 468–500 | 489 | 1.502 | 0.568 | 0.919 |
| 4F5/2 | 450–466 | 455 | 0.263 | 0.092 | 0.277 |
| 4F3/2 | 440–450 | 446 | 0.096 | 0.033 | 0.158 |
| 2H9/2 | 402–421 | 409 | 0.776 | 0.240 | 0.298 |
| 4G11/2 | 346–400 | 377 | 21.850 | 6.157 | 5.741 |
The relative square deviation R is fitted to be 5.84%, which indicates a good consistency between the calculated and experimental values. By a least squared fitting to the experimental line strength Sexp, the three intensity parameters are fitted to be Ω2 = 5.542 × 10⁻²⁰ cm2, Ω4 = 0.962 × 10⁻²⁰ cm2 and Ω6 = 1.241 × 10⁻² 0cm2. Normally, the Ωt parameters depend on the doping ions and the crystalline field environment. The value of Ω2 is proportional to the asymmetry. The higher value of Ω2 indicates the lower local environment symmetry exists. However, Ω4 and Ω6 are not directly related to the ligand symmetry of rare-earth ions. Ω6 usually increases with decreasing covalence between doping ions and the surrounding elements. Ω4/Ω6 is used as a spectroscopic quality factor and is a significant characteristic parameter for estimating the stimulated emission efficiency [26]. Intensity parameters in our work compared with other Er3+ doped crystals are shown in table 2. In this work, the value of Ω2 is 5.54, which is smaller than that of GdTaO4 [27] and BaLaGa3O7 [14], but higher than that of Gd3Sc2Ga3O12 [26], CaLaGa3O7 [15], CaF2 [28] and YAlO3 [29]. The results show that grade of contravalency in Lu2O3 is lower than that of GdTaO4 and BaLaGa3O7 but higher than that of Gd3Sc2Ga3O12, CaF2 and CaLaGa3O7 surrounding the Er3+ ions. The value of Ω4/Ω6 is 0.77 higher than CaF2, which indicates the rigidity of Er:Lu2O3 higher than CaF2.
Table 2. The J-O intensity parameters of Er3+ in different crystals.
| Crystal | Ω2/10–20cm2 | Ω4/10–20cm2 | Ω6/10–20cm2 | Ω4/Ω6/10–20cm2 | References |
|---|---|---|---|---|---|
| Gd3Sc2Ga3O12 | 1.26 | 1.18 | 0.84 | 1.40 | [10] |
| BaLaGa3O7 | 17.55 | 3.71 | 2.76 | 1.34 | [13] |
| CaLaGa3O7 | 4.73 | 1.68 | 0.62 | 2.71 | [14] |
| GdTaO4 | 7.55 | 1.99 | 1.40 | 1.42 | [26] |
| CaF2 | 1.22 | 0.89 | 1.72 | 0.52 | [27] |
| YAlO3 | 1.06 | 2.63 | 0.78 | 3.37 | [28] |
| Lu2O3 | 5.54 | 0.96 | 1.24 | 0.77 | This work |
By using the obtained transition intensity parameters, the calculated results of the radiative transition rate A(J→J'), the fluorescence branching ratio β(J→J'), and the radiative lifetime τrad are listed in table 3. As shown in table 3, the radiative transitions of 4I13/2 → 4I15/2 and 4I11/2 → 4I13/2corresponding to the wavelengths 1.5 μm and 2.8 μm, have larger fluorescence branching ratios in infrared wavelength regions. The fluorescence branching ratios of 4I13/2 → 4I15/2 and 4I11/2 → 4I13/2 are 100% and 48.4%. There are some effects of non-radiative processes in 4I11/2 → 4I13/2. Moreover, the radiative lifetimes of 4I13/2 and 4I11/2 is estimated to be 1.36 ms and 2.52 ms, which indicate excellent energy storage capability.
Table 3. Radiative transition rates, branching ratios and radiative lifetimes for different transition levels of Er:Lu2O3 crystal.
| Transition | Radiation | Transition probability | Branching Ratio | Lifetime | |
|---|---|---|---|---|---|
| Initial state | Final state | λ(nm) | AR (s-1) | β(%) | τ(ms) |
| 4I13/2 | 4I15/2 | 1566 | 810.7 | 100 | 1.36 |
| 4I11/2 | 4I15/2 | 1025 | 205.0 | 51.6 | 2.52 |
| 4I13/2 | 2793 | 192.3 | 48.4 | ||
| 4I9/2 | 4I15/2 | 829 | 81.1 | 42.4 | 5.22 |
| 4I13/2 | 1677 | 81.6 | 42.6 | ||
| 4I11/2 | 4351 | 28.8 | 15.0 | ||
| 4F9/2 | 4I15/2 | 679 | 1237.5 | 88.4 | 0.71 |
| 4I13/2 | 1157 | 59.2 | 4.2 | ||
| 4I11/2 | 2010 | 98.8 | 7.1 | ||
| 4I9/2 | 3735 | 4.3 | 0.3 | ||
| 4S3/2 | 4I15/2 | 560 | 1803.3 | 66.6 | 0.37 |
| 4I13/2 | 850 | 773.8 | 28.6 | ||
| 4I11/2 | 1235 | 54.2 | 2.0 | ||
| 4I9/2 | 1724 | 74.8 | 2.8 | ||
| 4F9/2 | 3202 | 1.0 | 0.04 | ||
| 2H11/2 | 4I15/2 | 537 | 8024.2 | 95.7 | 0.12 |
| 4I13/2 | 798 | 139.1 | 1.7 | ||
| 4I11/2 | 1127 | 66.8 | 0.8 | ||
| 4I9/2 | 1521 | 125.2 | 1.5 | ||
| 4F9/2 | 2565 | 30.6 | 0.4 | ||
| 4S3/2 | 12 897 | 0.009 | 0.0001 | ||
| 4F7/2 | 4I15/2 | 502 | 3980.0 | 86.1 | 0.22 |
| 4I13/2 | 723 | 265.9 | 5.8 | ||
| 4I11/2 | 984 | 197.7 | 4.3 | ||
| 4I9/2 | 1271 | 170.9 | 3.7 | ||
| 4F9/2 | 1927 | 6.4 | 0.14 | ||
| 4S3/2 | 4836 | 0.015 | 0.0003 | ||
| 2H11/2 | 7738 | 0.89 | 0.02 | ||
The emission spectra in 1.5 μm and 2.8 μm of 1.5 at% Er:Lu2O3 crystal are shown in figure 4. Figures 3(a) and (b) show the emission cross-section in near 1.5 μm and 2.8 μm. The emission cross-section is calculated by the Fuchtbauer–Ladenburg (F–L) formula [30]:

Where A is transition probabilities correspond to radiative transitions, c is the velocity of light, n is the refractive index and I(λ) represents the experimental emission intensity as a function of the wavelength. The emission cross-sections of the 1.5 at% Er:Lu2O3 crystal at 1558 nm and 2742 nm were calculated to be 2.20 × 10⁻²⁰ cm2 and 3.22 × 10⁻²⁰ cm2, and the FWHMs are 64.9 nm and 178.1 nm, respectively.
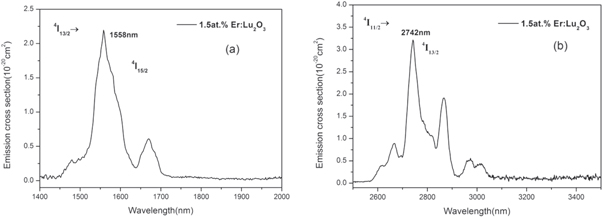
Figure 4. The emission spectra in 1.5 μm (a) and 2.8 μm (b) of Er:Lu2O3 crystal.
Download figure:
Standard image High-resolution imageThe fluorescence decay curves for 4I11/2 (a and 4I13/2 (b) are shown in figure 5. With a single exponential function, the lifetimes of 4I11/2 and 4I13/2 are fitted to be 1.59 ms and 12.43 ms. The fluorescence lifetime of 4I11/2 (1.59 ms) is longer compared to other host materials, supplies a long and efficient radiative relaxation from the 4I11/2 onto the 4I13/2 level. Theoretically, the radiative lifetime should be longer than the fluorescence lifetime. The thin samples are used to measure because the reabsorption phenomenon would generate a longer measured fluorescence lifetime.

Figure 5. The fluorescence decay curves for both 4I11/2 (a), 4I13/2 (b) of Er:Lu2O3 crystal at room temperature.
Download figure:
Standard image High-resolution imageThe spectroscopic data in 2.8 μm between the Er:Lu2O3 crystal and other Er3+ doped crystals is listed in table 4. The 1.5 at% Er:Lu2O3 crystal has a larger spectral quality factors Q (Q = σemτup ) than CaF2 and YAG. because it has higher emission cross-section and the lifetime of 4I11/2. The result indicates that Er:Lu2O3 single crystal is a potential material for 2.8 μm laser operation.
Table 4. Spectroscopic data of Er:Lu2O3 as compared with several Er-doped crystals.
| Crystal | σem (10–20cm2) | τup(μs) | τlow(μs) | lifetime ratio (τlow/τup) | Q(10–20cm2×μs) | References |
|---|---|---|---|---|---|---|
| SrF2 | 0.78 | 9560 | 15 060 | 1.58 | 7450 | [16] |
| BaLaGa3O7 | 7.34 | 717 | 7989 | 11.1 | 5260 | [13] |
| CaF2 | 0.65 | 5980 | 9940 | 1.66 | 3890 | [16] |
| Y3Al5O12 | 3 | 120 | 7250 | 60.6 | 360 | [7] |
| Lu2O3 | 3.22 | 1590 | 12 430 | 7.82 | 5120 | This work |
The absorption cross-section of Er3+ in radiative transitions 4I13/2 → 4I15/2 and 4I11/2 → 4I13/2 can be derived from the calculated emission cross-section through the McCumber method [31]:

where Ezl is the energy difference between the lowest Stark level of the lower and upper manifolds, h is Plancks constant, KB is the Boltzmann constant, T is the temperature, and Zu and Zl are partition functionsand. Zu/Zl of 4I13/2 → 4I15/2 and 4I11/2 → 4I13/2 are 1.25 and 1.09, respectively [32, 33].
As the absorption and emission cross-section were calculated, the gain cross-section, which is used to evaluated laser performance, is commonly calculated according to the formula [34]:

where p is the population inversion ratio, P = Nu/N0, where Nu and N0 are the numbers of ions in the upper laser level and overall number of ions, respectively. The calculated results of the gain cross-sections of the 1.5 at% Er:Lu2O3 crystal in 1.5 μm and 2.8 μm with the P various from 0 to 1 were estimated and illustrated in figure 6. The gain cross-sections in near 1.5 μm and 2.8 μm are displayed in figure 5(a) and (b). when inversion ratio P = 0.5, the positive gain cross-section was achieved at 1.5 μm and 2.8 μm. As inversion ratio increasing, the local peaks at 1.5 μm and 2.8 μm are also observed. The low inversion ratios indicate a great potential of Er:Lu2O3 crystal with good gain performance.

Figure 6. The gain cross-sections of the Er:Lu2O3 crystal in 1.5 μm (a) and 2.8 μm (b) with the P various from 0 to 1.
Download figure:
Standard image High-resolution image
4. Conclusions
A high-quality 1.5 at% Er:Lu2O3 single crystal was successfully grown by Fz method. The transition probabilities, line strength, fluorescence branch ratios were calculated. The J-O intensity parameters Ωt (t = 2, 4, 6) were calculated to be Ω2 = 5.542 × 10⁻²⁰ cm2, Ω4 = 0.962 × 10⁻²⁰ cm2 and Ω6 = 1.241 × 10⁻²⁰cm2. The absorption cross-section at near 971 nm and 1536 nm are 0.15 × 10⁻²⁰ cm2 and 1.07 × 10⁻²⁰ cm2, and the FWHMs are 18.3 nm and 12.3 nm, respectively. The fluorescence lifetime of 4I11/2 and 4I13/2 at 2.8 μm are fitted to be 1.59 ms and 12.43 ms. In addition, the emission cross-section at 1558 nm and 2742 nm were calculated to be 2.20 × 10⁻²⁰ cm2 and 3.22 × 10⁻²⁰ cm2 , and the FWHMs are 64.85 nm and 178.1 nm, respectively. The longer fluorescence lifetime , larger σem, and the larger spectral quality factors Q of 1.5 at% Er:Lu2O3 crystal indicate that it has a great potential for 2.8 μm laser operation.
Acknowledgments
This work is partially supported by the National Key Research and Development Program of China (No. 2016YFB1102202), the Fundamental Research Funds for the Central Universities and MOE Key Laboratory of Advanced Micro-Structured Materials.