
Abstract
Mass finishing is amongst the most widely used finishing processes in modern manufacturing, in applications from deburring to edge radiusing and polishing. Processing objectives are varied, ranging from the cosmetic to the functionally critical. One such critical application is the hydraulically smooth polishing of aero engine component gas-washed surfaces. In this, and many other applications the drive to improve process control and finish tolerance is ever present. Considering its widespread use mass finishing has seen limited research activity, particularly with respect to surface characterization. The objectives of the current paper are to; characterise the mass finished stratified surface and its development process using areal surface parameters, provide guidance on the optimal parameters and sampling method to characterise this surface type for a given application, and detail the spatial variation in surface topography due to coupon edge shadowing. Blasted and peened square plate coupons in titanium alloy are wet (vibro) mass finished iteratively with increasing duration. Measurement fields are precisely relocated between iterations by fixturing and an image superimposition alignment technique. Surface topography development is detailed with 'log of process duration' plots of the 'areal parameters for scale-limited stratified functional surfaces', (the Sk family). Characteristic features of the Smr2 plot are seen to map out the processing of peak, core and dale regions in turn. These surface process regions also become apparent in the 'log of process duration' plot for Sq, where lower core and dale regions are well modelled by logarithmic functions. Surface finish (Ra or Sa) with mass finishing duration is currently predicted with an exponential model. This model is shown to be limited for the current surface type at a critical range of surface finishes. Statistical analysis provides a group of areal parameters including; Vvc, Sq, and Sdq, showing optimal discrimination for a specific range of surface finish outcomes. As a consequence of edge shadowing surface segregation is suggested for characterization purposes.
Export citation and abstract BibTeX RIS

Content from this work may be used under the terms of the Creative Commons Attribution 3.0 licence. Any further distribution of this work must maintain attribution to the author(s) and the title of the work, journal citation and DOI.
1. Introduction
Engineering surfaces polished by mass finishing are often pre-processed by blasting and peening to satisfy production or mechanical requirements. Surface texture specifications are typically reached before all the residual pre-processing pits are removed from the surface. Thus, finished surfaces are said to be 'stratified' (though not necessarily functionally so) being composed of a predominant plateau with sparse pits. Figure 1 shows the gas washed surfaces of compressor blades, a surface type commonly polished by mass finishing.

Figure 1. Showing a selection of gas and steam turbine compressor blades which have gas washed surfaces polished by mass finishing, one of the many applications of this technique [1]. Creative commons unrestricted reuse.
Download figure:
Standard image High-resolution imageMass finishing is a diverse process group, of which polishing applications form a major part. A fluidized media bed in a vessel often flushed with a wetting agent forms the processing environment see figure 2.

Figure 2. Schematic cross section of a typical bench top vibro mass finishing unit (15 l capacity as used in the current work).
Download figure:
Standard image High-resolution imageThe majority of published work on mass finishing has been conducted from a tribological perspective. Wang et al [2] detail media-component interactions types include; three body abrasion, ploughing, cutting, rubbing, and burnishing. In the current work, for convenience mass finishing is referred to as 'processing', which includes all media actions that remove or displace material on the sample surface. Davidson [3, 4] relates contemporary industrial experience in the field including guidance on process optimization. He gives an outline of shadowing, the spatial variation inherent in the process group; where specific surface regions experience a deficit in media action due to component geometry. Such a deficit results in increased surface roughness in, for example an internal corner or recess.
Media surface roughness was identified as a process variable for component surface texture by Wang et al [2] and hence a media running in period is recommended to achieve consistent results. Hashimoto and DeBra [5] worked from first principles to develop an exponential expression to model Ra as a function of processing time.
Their data agree well with the model and they made accurate predictions of optimal process time for a desired Ra surface outcome. For a uniform mass removal rate process, as in principle mass finishing is, it is clear that a necessary condition for the exponential model is that the surface amplitude probability density function (APDF) is Gaussian. No data is available for the APDF of the ground surfaces in [5], though Whitehouse [6] note that due to the central limit theorem ground surfaces tend to have a Gaussian APDF. Hence, the generality of the model is in question as the APDFs of surfaces with the same Ra values can vary significantly [7]. Thus it is suggested that Ra(t) for a surface whose APDF deviates from Gaussian would be less well fitted by the exponential model.
It is currently still the case that all models of mass finished surface roughness models require empirically determined coefficients for a given application. Extension of such a model to the general case for mass finishing is seen to be the goal of mass finishing research.
Figure 3 shows the construction of the areal parameters for scale-limited stratified functional surfaces and equivalent straight line based on ISO 13562-2 [8] from the areal material ratio curve as detailed in ISO 25178-2 [9] and discussed in [6].

Figure 3. Areal material ratio curve showing the construction of the Sk family of parameters and the equivalent straight line (2) for the curve. (After [8, 9]).
Download figure:
Standard image High-resolution imageFigure 3(1) represents a secant (cutting line) of the areal material ratio curve, such that this secant has the lowest slope spanning 40% of the heights of the curve. The fitting of the secant line starts at the highest point of the curve and for the case of multiple equivalent low slope secant lines the one nearest to the curve top is selected. 'The equivalent straight line' figure 3(2) is the extension of the lowest slope secant out to the chart axes. Reduced peak height (Spk), core height (Sk) and reduced dale height (Svk) describe the heights of the peak (hills), core and dale regions of the surface respectively. Spk and Svk are reduced to exclude extreme outliers by fitting of the shaded triangles A1 and A2, these triangles having the same area as the material above the core and void below it respectively. Smr1 (peak material ratio) and Smr2 (dale material ratio) have their respective lower and upper boundaries defined by the core region, and Sk is a measure of the gradient of the equivalent straight line. The behaviour of equivalent straight line is thus central to this parametric group and it will be used to relate their changes during surface development. The applicability of this construction is limited to those surfaces that exhibit the sigmoid profile areal material ratio curve as in figure 3. It is also important for this technique to be valid that the 40% of surface heights spanned by this secant should be resolved into at least 10 measurement classes (see figure 3(a)). It is noted that Whitehouse [6] considers the underlying nature of the 'S' shaped material ratio curve as somewhat arbitrary, though practical significance is still seen in the approach.
Mass finished surfaces are expected to meet increasingly stringent specifications, these this will typically be met in the lower core or dale region of processing. To discriminate between those surfaces that meet specification and those that do not, parameters that are optimal for this purpose are required. A recent overview and examples of existing techniques has been published [10]. These techniques are based on statistics from pre-existing groups of components that have been assigned to classes on the basis of having passed or failed a specification test. Where no clear functionally based pass-fail criterion to discriminate between developing surfaces is known a more general approach to identifying discriminating parameters is required. From [10] it is clear that a discriminating parameter will change monotonically, significantly and with low variance over a process increment.
Recent work by Walton et al [11] indicates that mass finishing produces a spatially non-uniform surface texture distribution on a flat surface due to 'edge shadowing'. A region close to a cut edge of a surface shows a different character due the edge shielding the adjacent flat surface from media action.
2. Materials and methods
A series of 40 mm square by 4 mm thick Titanium (Ti-Al6-V4) coupons were alumina blasted and glass bead peened. Coupon '1' was ultrasonically cleaned and characterized in two single surface regions each approximately 4.5 × 3.7 mm, 7620 × 6240 points using an Alicona IFM G4 (focus variation instrument); with 50× objective at 600 nm sample spacing in x and y and 10 nm vertical resolution. This process includes stitching 20 × 20 individual 50× instrument fields together. The data sets were levelled and robust Gaussian filtered with S and L filter nesting index of 0.0025 and 0.8 mm respectively. Coupon '1' was then incrementally processed, cleaned and characterized over 17 increments of varying duration for a total of 7066 min Processing was carried out in a bench-top vibro mass finisher with 10 mm ceramic cut triangular prism media and a flushing surfactant solution. Process media were run in for 24 h prior to commencing processing. A fixture was fabricated to register the test coupons on the instrument stage. This offered high precise for alignment in the x and y stage axes. This is particularly important as it is not possible to alter the rotational alignment of areal surface measurements after capture. The translational accuracy of the fixture was poorer (varied by as much as 100 μm) as the coupon edges were exposed to abrasion during processing. The captured fields were post process in a second stage to increase accuracy. Each surface measurement captured by the IFM G4 has an image file associated with it, the pixel spacing of the file being equal to the sample spacing of the measurement. These images were overlaid in a suitable graphics software package and aligned with respect to key surface features. Script was written to batch process the measurement files cropping them to give the same measurement field at the same field size. Thus with clear surface features an accuracy of close to one pixel (of the order of 1 μm) can be achieved. This approach essentially removed any influence of spatial variation between measurements, thus processing is the only variable considered as instrument repeatability is small by comparison. After alignment and cropping each of the two surface regions was subdivided into 4 fields (approximately 2.2 mm × 1.8 mm) for processing, thus the taking of mean and standard deviations was carried out over 8 measurement values for each process increment.
3. Objectives
In the present paper the primary objectives are; to detail the development of a stratified mass finished surface in terms of the peak, core and dale regions of the scale-limited stratified functional surface and relate this development to the mean amplitude parameters for the surface, to characterise the surface with optimized discriminating parameters, to evaluate the current exponential predictive process model for this process group for the current surface type and to offer guidance on the segregation of this 'edge shadowed' in-homogeneous surface type in order to optimize sampling for characterization.
4. Results and discussion
4.1. Edge shadowing
Figure 4 shows the approximate extent of the edge shadowing region evident on the processed coupons. Figure 5 shows the generalized distribution of Smr2 for the edge shadowing effect.

Figure 4. Shows a sample coupon marked to show the approximate extent of the edge shadowing region and the location of measurements to determine surface texture spatial distribution.
Download figure:
Standard image High-resolution image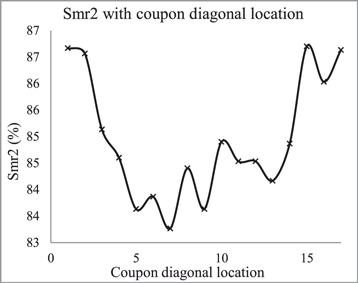
Figure 5. Plot of Smr2 with diagonal location as illustrated in figure 4, this distribution illustrates a general trend being the mean of several diagonals on several coupons. Error bars are omitted for clarity, standard deviation is on average 0.8% at each location.
Download figure:
Standard image High-resolution imageDuring processing a peripheral coupon region experiences a deficit in mass finishing media action due to an 'edge shadowing' effect. This deficit can be considered as part of the total mass finishing work, as a balance to the surplus of media action seen in the significant radiusing of surface corners.
The shadowed region has a characteristically different surface texture to the central coupon region. This surface texture distribution is evident in a number of areal surface parameters. It should be noted that the variance of the mean of the parameters showing the edge shadowing trend as in figure 5 is high due to the large variation of the sparsely pitted underlying surface. This shadowing effect like other existing types has its extent determined largely by the size of media used. The shadowed region in this instance is approximately 4–6 mm wide though there is no clear separating line from the central region as the process is 'continuous'. The effect is more pronounced and extensive at surface corners as two edges are generating the shadowing effect, hence the selection of a diagonal sampling direction.
Based on the guidance for segregation of in-homogenous for profile sampling in BS EN ISO_4288 [12], it is recommended that flat mass finished surfaces be segregated into central and peripheral regions for sampling and characterization.
4.2. Surface development
Overall surface development is illustrated in skewness-kurtosis space [13] in figure 6. The surface transitions from close to Gaussian through heavily skewed and kurtotic then returning to approximately Gaussian.

Figure 6. Processing result data plotted in skewness kurtosis space, inset figures show process increment number.
Download figure:
Standard image High-resolution imageProcess increments 16 and 17 show significant variation from this trend, due in part to limitations of the visual relocation method used, never the less the trend of Gaussian to skewed and back to Gaussian is clear.
Figure 7 shows colour coded height maps and microscopic images of the same relocated field on coupon '1' at odd process increments, illustrating the nature of the surface development. Two surface features 'A' and 'B' are labelled to track their development through processing. At increment 15 the location of feature A is seen to be significantly translated. This reduced accuracy of the visual relocation technique is seen after long periods of mass finishing as notable surface features became increasingly sparse. Thus the accuracy of the fixture becomes the limiting factor. Improved relocation accuracy at higher process durations could be achieved with the use of fiducial marks. However, this would not improve relocation accuracy for the large majority of the 'stratified' surfaces that are the focus of the current work.

Figure 7. Shows the same location on coupon '1' at odd processing increments, inset values above are Sq(μm), below are process increment and processing duration (minutes) The region shown is a single 50× instrument field from the process sequence the Sq values shown refer to this field only.
Download figure:
Standard image High-resolution imageIt is assumed that; the mass finishing process is a simple truncation of surface topography over time, no plastic deformation occurs and that transition between the named phases (regions) of surface development is sharp. The current work has shown these assumptions to be inaccuate to varying degrees but for the purpose of overall surface developement they are reasonable.
Figure 8 through figure 11 show Sk family parameter plots for the process data with the log of process duration.

Figure 8. Sk with log of process duration, inset figures show increment number. Error bars at 1 standard deviation.
Download figure:
Standard image High-resolution imageFigure 11 shows the plot of Smr2 and the characteristic developmental regions; Peak, Upper core, Lower core, Dale and Uniform surface, this surface type that relate to the structure of the areal material ratio curve in figure 3. As material in the peak region is processed the equivalent straight line gradient is almost constant, Smr1 (figure 10) is seen to decrease due to the change in the areal material ratio curve profile, as there is no change in the equivalent straight line gradient. At increment 4 processing of the upper-core starts and the gradient of the equivalent straight line begins to deceases rapidly, as Smr2 (figure 11) is decreasing while Svk (figure 9) increases and does not drops back below its original value until increment 8. This apparent increase in reduced dale height is a consequence of the 'relative' geometric construction of the parameter family and not an absolute increase in dale depth. At increment 7 a point of inflection is seen on the plot of Sk (figure 8) where the rate of change of the equivalent straight line gradient becomes zero.

Figure 9. Svk with log of process duration, inset figures show increment number. Error bars at 1 standard deviation.
Download figure:
Standard image High-resolution imageThis point is the centre of the core region at increment 7, where the surface has been processed to approximately the original surface mean line. Whitehouse [6] notes 'it can be shown that the skew of a random wave truncated at the mean level gives a skew of −2.1'. The surface type in the current paper is close to Gaussian (random in this context) and has a skewness value of −1.94 at increment 7 thus validating this as being close to the original mean plane. From this point the equivalent straight line gradient decreases increasingly slowly as both Sk and Svk decrease while Smr2 increases. The transition between processing of the lower core and the dale region is the least well defined. Increment 12 is identified for this transition due to the inflection at this point in the plot of Smr2. The dale region is then processed until approximately increment 16 where transition to the uniform region is seen. In principle at this point all evidence of previous surface processes has been removed. Thus the average surface character is no longer process dependent and in this case has a Smr2 value approximately 2% below that of the initial surface.

Figure 10. Smr1 with log of process duration, inset figures show process increment number. Error bars at 1 standard deviation.
Download figure:
Standard image High-resolution imageSignificantly, the characteristic regions illustrated in figure 11 are also apparent in the plot of Sq in figure 12 and similar behaviour is seen in the plot of Sa. The two closely fitted straight lines α and β correspond to the lower core and peak regions of the surface, increments 7–12 and 1–4 respectively. Upper core and dale regions lie between and after these straight line sections, a fully developed uniform region would form a final horizontal straight line (more data is not present in this region due to the prohibitive processing tiem required to show this lack of variation.)

Figure 11. Smr2 with log of process duration, time axis inset figures show process increment number. Vertical broken lines and labels Peak, Upper core, Lower core, Dale, Uniform surface, define the identified surface development regions. Horizontal broken line represents the value of the final uniform surface. Error bars at 1 standard deviation.
Download figure:
Standard image High-resolution image
Figure 12. Sq with log of process duration; with α, β fitted straight lines to the lower core and peak regions respectively. Fitted functions and R2 values are inset (β line function omitted due to its limited practical significance). Inset figures show process increment number. Error bars at 1 standard deviation.
Download figure:
Standard image High-resolution imageFigure 13 shows Sa data with linear process duration and the plot of an exponential function fitted to the data. Sa values are used in this section of the current work (Ra was selected in [5]).

Figure 13. Sa with process duration for increments 1–16 and fitted exponential function, inset values are process increments at surface development region boundaries.
Download figure:
Standard image High-resolution image
The exponential fitted function (as detailed in [5]) is of the form;


In practice the time constant A for the exponential function can be determined from the empirical data. The Sa value at time A  can be determined as follows;


 figure 13).
The exponential fit to the data is good across the peak, upper and lower core regions, increments 1–4, 4–7, 7–12 respectively while a poorer fit is seen the early part of the 'dale' region notably at increments 13 and 14. The greatest discrepancy is seen at increment 13 (1490 min processing) where the difference between the measured Sa value and exponential fitted value is approximately 18%. This is a significant difference in this region where specifications are commonly set for this process type. The exponential function fit to the data for the current surface type is adequate though it is clear an improved model is required in the critical region. The log function fit to the lower core region data in figure 12 offers an improved fit, but lacks the practicality of defining the process with respect to its initial and final surface roughness levels. Two possible mechanisms are suggested for the deviation of the Sa data from the exponential model. Firstly, this may be due to the rate of material removal slowing during processing as a result of loss of media mass and or glazing. Secondly, the surface APDF of the current surface may differ from Gaussian sufficiently to make the exponential model inappropriate.
4.3. Parametric surface development characterization
Table 1 shows the selected areal parameters that best discriminate between the coupon test surface before and after increment 12. Good discrimination is characterized by a non-dimensional coefficient of discrimination CD, defined by the authors as


Table 1. Parameters showing highest CD for the surfaces of coupon 1 before and after process increment 12, 1010 and 1490 min respectively. Also the mean, standard deviation (SD) and coefficient of variation after increment 12. Vvc defined by material ratio default % as seen in ISO_25178-3 [14].
| Parameter | Family | Units | Mean (12+) | SD (12+) | Cν (12+) | CD | |
|---|---|---|---|---|---|---|---|
| Sk | Core height | Sk family | (μm) | 0.520 | 0.036 | 0.070 | 3.16 |
| Vvc | Core void volume | Curves | (μm3 mm−2) | 227 900 | 17 400 | 0.076 | 2.99 |
| Sdq | rms surface slope | Hybrid | 0.064 | 0.002 | 0.031 | 2.46 | |
| Sq | rms surface height | Amplitude | (μm) | 0.365 | 0.050 | 0.138 | 1.95 |
NB this measure of parametric discrimination assumes that the significance of difference in mean and coefficient of variation are approximately equal.
5. Conclusions
The development of this common stratified surface type is seen to follow a characteristic pattern. This pattern is clearly depicted in terms of the areal parameters for scale-limited stratified functional surfaces and in terms of the peak, core (upper and lower in this context) and dale regions of the surface. Significantly, these same developmental stages are also seen in the plot of Sq with log of process duration, thus directly relating surface roughness amplitude variation to its topographical development. This strong relationship is illustrated by the observation that peak and lower core regions of development in the Sq plot are seen to be modelled closely by logarithmic functions. An exponential model is shown to be limited in its accuracy for the critical lower core, dale transition region. Further work is required to determine if non-Gaussian surfaces are better represented by non-exponential models.
Areal parameters including Sk, Vvc and Sdq are seen to offer optimized surface discrimination during processing and the selection technique for these discriminating parameters is generally applicable.
The approximate extent and magnitude of edge shadowing on a flat processed surface is described and this spatial in-homogeneity suggest a segregated approach to characterization may be necessary. Further work is required to fully understand the mechanism of edge shadowing and its influence.
Acknowledgments
The authors thank Rolls-Royce PLC for providing sponsorship for the work undertaken here. The authors gratefully acknowledge the UK's Engineering and Physical Sciences Research Council (EPSRC) funding of the EPSRC Centre for Innovative Manufacturing in Advanced Metrology (Grant reference: EP/I033424/1). The authors would like to thank Christopher J Evans, University of North Carolina-Charlotte, for his helpful comments.