
Abstract
We report a self-assisted optothermal trapping and patterning of gold nanorods (GNRs) on glass surfaces with a femtosecond laser. We show that GNRs are not only the trapping targets, but also can enhance the optothermal trapping of other particles. This trapping phenomenon is the net result of thermophoresis and a convective flow caused by localized heating. The heating is due to the conversion of absorbed photons into heat at GNR's longitudinal surface plasmon resonance (LSPR) wavelength. First, we investigated the optothermal trapping of GNRs at their LSPR wavelength on the glass surface with as low as 0.5 mW laser power. The trapping range was observed to be larger than a typical field of view, e.g. 210 µm × 210 µm here. Second, by adjusting the distance between the laser focus and the glass surface, ring patterns of GNRs on the glass surface were obtained. These patterns could be controlled by the laser power and the numerical aperture of the microscope objective. Moreover, we examined the spectral emission of GNRs under different trapping conditions using the spectral phasor approach to reveal the temperature and association status of GNRs. Our study will help understanding manipulation of flows in solution and in biological systems that can be applied in future investigations of GNR-induced heating and flows.
Export citation and abstract BibTeX RIS

Original content from this work may be used under the terms of the Creative Commons Attribution 3.0 licence. Any further distribution of this work must maintain attribution to the author(s) and the title of the work, journal citation and DOI.
Introduction
As imaging and potential thermal therapy agents, gold nanorods (GNRs), with plasmon-resonant absorption in the near-infrared region, have gained a significant amount of attention in the biomedical and imaging areas. For example, in vitro and in vivo two-photon luminescence imaging of GNRs have been already reported extensively [1–3]. This interest is mainly due to GNR's tunable excitation wavelength, i.e. longitudinal surface plasmon resonance (LSPR) wavelength. This LSPR wavelength can be easily tuned throughout the near-infrared (NIR) region for a better penetration depth in in vivo experiments, e.g. from ~600 nm–1400 nm by varying the aspect ratio during GNR synthesis [4–6]. Excitation at the LSPR can greatly enhance the luminescence from NRs and improve the imaging quality accordingly. GNRs can also enhance signal generated from nearby fluorescence dyes or quantum dots [7–10]. Furthermore, it has been reported that over 96% of the absorbed photons by GNRs can be converted into heat via non-radiative electron relaxation [11–13]. Therefore, GNRs are suitable for photothermal agents in localized NIR-induced hyperthermia [12, 14–16]. Consequently the handling and manipulation of GNRs becomes an interesting and important topic, which offers great opportunities for targeted nanoscale drug delivery [17–23].
Optical trapping of single NRs due to strong electromagnetic (EM) field enhanced trapping force have been previously reported [18, 19, 22, 24–26]. Pelton et al found that GNRs can be trapped and manipulated by a continuous-wave laser beam slightly detuned to the long wavelength side of the GNR longitudinal plasmon resonance [18]. Although most optical trappings of GNRs were done with continuous-wave lasers, Gu et al demonstrated that the trapping force can be enhanced by two-photon absorption of GNRs [22]. Moreover, they reported a snowball effect which is caused by a plasmon-mediated optothermal attracting force. They proposed that the large trapping range is due to the thermal force that decays slower as a function of distance than the EM force [27]. These findings confirm a previous discussion that the thermal effect at LSPR significantly influences the trapping capability [19, 27].
The optothermal trapping provides a different approach for manipulation of small particles other than optical trapping. Detailed theoretical/experimental studies and simulations can be found in references [28–33] and more. Traditionally, an IR beam in the range of ~1400 nm–~1600 nm is used to generate the thermal trapping due to its high optical absorption in water, e.g. the water absorption at 1400 nm is about 3 orders of magnitude larger than the absorption at 800 nm [34]. Due to the tightly focused laser beam, a temperature gradient inside a colloid solution can be created. As a result, thermophoresis and convection flow can work together to trap and redistribute particles [30].
Recently we reported that GNRs can undergo thermal trapping with a femtosecond laser at LSPR wavelength [35]. Given that the water absorption of photons at 840 nm is small, GNRs effectively convert absorbed photons into heat and lead to the thermal trapping without using the water absorption window. Here we explore the optothermal trapping and patterning of GNRs on glass surfaces. During this process, GNRs are not only the trapping targets, but also can enhance the trapping of other particles. We demonstrate that trapping of GNRs on the glass surface can be obtained with only 0.5 mW power at LSPR wavelength. The trapping range over about 200 µm confirms the contribution of the convective flow. By adjusting the distance between the laser focus and glass surfaces, ring patterns of GNRs can be observed on the surfaces. These ring patterns can be controlled by the trapping laser power and the numerical aperture of the objective. In addition, spectral emission shifts are detected that depend on the interaction between GNRs. Our spectral phasor analysis combined with intensity maps could help reveal the physical process of GNR trapping. The advantage of this technique is that low laser powers are used to accumulate the GNRs from a large distance in a well-controlled manner. Also it can create a localized trapping spot via GNRs with a positive feedback loop for trapping and heating more particles, which will help the potential applications of GNRs in thermal therapy.
Experimental section
Instrument details
As schematically shown in figure 1, the optothermal trapping of GNRs is performed on a confocal laser scanning microscope with the addition of two-photon excitation capability as described previously [35]. As shown in figure 1(A), a NIR beam from a MaiTai HP Ti:Sapphire (Newport, USA) laser is coupled into an inverted Olympus FV1000 confocal system (Olympus, USA). A DeepSea unit is used to compensate the group velocity dispersion and an acoustic optical modulator controls the laser power. The NIR laser beam is expanded in order to fulfill the back aperture of the objective lens. The Olympus FV1000 scanner is driven by a third party controller (IOTECH DAQboard 3001) and our software (SimFCS, available from www.lfd.uci.edu/) to gain the full control of the scanning pattern and timing. An Olympus60 × water objective (Olympus UPlanSApo, NA = 1.2) or a 40× water objective (Olympus LUMPlanFl, NA = 0.8) were used to focus the laser beam and to collect the emission signal. The signal is reflected to the internal PMT for intensity imaging or coupled into a 200 µm fiber for hyperspectral imaging. In hyperspectral imaging analysis, the phasor approach is used to identify components in the image based on spectral changes [35].

Figure 1. Schematic of our trapping and imaging system. (A) The NIR laser beam from A MaiTai HP Ti:Sapphire laser is coupled into a Olympus FV1000 confocal system with IX81 body. A MaiTai® DeepSee™ unit is placed in the front of MaiTai to compensate for group velocity dispersion. Laser power is controlled by an acousto-optic modulator (AOM). The beam is expanded 3× before a flip mirror which allows trapping or imaging mode. In the first mode, termed 'scanning-trapping', the beam is coupled to the Olympus scanning box directly and serves as both trapping and imaging beam sequentially. In the second mode, termed 'trapping only', the NIR laser beam is expanded for another 3.3× before being coupled into the left port of the IX81 body and serves as the trapping beam only. In this mode of operation, a 488 nm laser is used to obtain the confocal and transmission images at the same time of trapping. (B) Proposed optothermal trapping by thermophoresis and convection flow from GNRs converted heat. (C) Data processing by spectral-phasor method.
Download figure:
Standard image High-resolution imageTwo trapping modes have been used for this work. In the 'scanning-trapping' mode, the laser beam is coupled into the Olympus laser scanning unit via its NIR port. A RDM690 excitation dichroic mirror reflects the excitation beam into the scanning path and allows the collected luminescence signal passing through to the detectors in the descanned path. In this mode, the NIR beam has both imaging and trapping functions. The trapping is done by focusing the beam at the center of the field of view (FOV) for a certain period of time, e.g. 30 s, and then we raster scan (16 µs/pixel) the same laser beam with a lower power (0.5 mW) to acquire an image of GNRs on the glass surface after trapping. This raster scan is too fast to accumulate GNRs on the glass surface.
In the other mode, i.e. the 'trapping only mode', the NIR beam is coupled into Olympus microscope IX81 body via the left port. A second beam expander is used to fill the back aperture of the objective and adjust the trapping position in the vertical direction. The NIR beam is only used for trapping because it cannot be scanned. A 488 nm laser in the confocal path is then used to generate transmission and confocal images while the NIR trappings beam is on.
GNRs have a broad absorption spectrum with two peaks at ~500 nm and a tunable wavelength in IR range (e.g. 840 nm in our study), which allows an easy excitation with any wavelength in VIS and NIR ranges. We used 488 nm Ar+ laser and 840 nm Ti:Sapphire for excitation with a 488 nm or a SDM690 dichroic mirror. The emission is also reported to from 400 nm to NIR range [35]. Here an emission bandpass filter of 505–540 nm was used in both trapping modes for collection of luminescence signal.
Sample preparation
CTAB-capped GNRs with LSPR at 840 nm was purchased from Nanopartz (Loveland, CO). The GNRs axial diameter is 10 nm and the length is 44 nm which leads to an aspect ratio of 4.4. The stock concentration is 5.7 × 10¹¹ nanoparticles ml−1. During the study of trapping on or close to the bottom surface, 200 µl of the solution was sonicated for 1 h before being added into an 8-well glass bottom chamber. In the study of the trapping close to the top surface, a sandwich chamber with two parallel glass surfaces was made and filled with GNR solution. The distance between the top and the bottom glass surface was ~80 µm.
Results and discussion
Self-assisted long range thermal trapping of GNRs
According to Hale and Querry, the optical extinction coefficient of water at 840 nm is ~1000 fold lower than at 1400 nm [34]. Therefore the direct heating of water by 0.5 mW laser power is minimal at 840 nm. However the thermal effect could be restored by the heat converted from absorbed photons via GNRs [11, 12]. Since GNRs are freely diffusing in water, a GNR can be directly trapped at the laser focus for a short period of time [35], e.g. tens of milliseconds, or simply pass over the illumination region. The absorbed light is converted into heat rapidly and creates a heat spot near the laser focus. The resulting convective flow brings nearby GNRs to the laser focus. If the concentration of GNR is sufficiently high, a positive feedback loop can be established. When more heat is generated with accumulation of GNRs at the focus, the trapping range is extended due to the convective flow (figure 1(B)). It has been reported that this effect was observable as the concentration increases to 103 per nanoliter [22]. In following measurements, we used the stock concentration of GNR, i.e. 5.7 × 10⁵ nanoparticles per nanoliter.
First we show that single GNRs can be trapped in the laser focal spot region on the glass surface. The 840 nm laser beam is focused at the bottom surface of the sample chamber with as low as 0.5 mW average power (figure 2(A)). The laser beam was scanned 256 × 256 pixels to obtain a 2D intensity image in 2 s and then parked at the center for 30 s to perform the optothermal trapping before another round of raster scanning for 2 s. This process was repeated until 20 frames were taken (movie S1 in supplementary materials (stacks.iop.org/MAF/4/035003/mmedia)). The image at 60s shows a small accumulation of GNRs in the focal spot (figure 2(B), left panel). However, there is a clear accumulation of GNRs at 240 s (figure 2(B), right panel). We also observed more GNRs in the whole FOV after 240 s in comparison to 60 s.
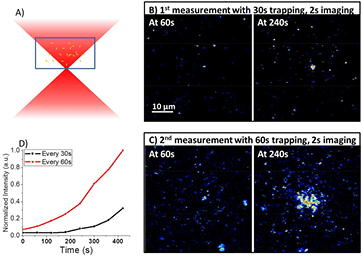
Figure 2. Optothermal trapping of GNRs on the glass surface. (A) The diagram of trapping. Two trapping measurements were done with different trapping intervals. In the first measurement, the laser beam was focused at the center for 30 s to trap GNRs, followed by a 2 s scanning of the same beam for a 2D image. In the second measurement, the laser beam was focused at the center for 60 s, followed by a 2 s scanning. These processes were repeated 20 times to monitor the trapping processes. Movies are available in the supplementary materials. (B) First measurement (30 s trapping followed by a 2 s scanning), frames at 60 s and 240 s are shown respectively. (C) Second measurement (60 s trapping followed by a 2 s scanning), frames at 60 s and 240 s are shown respectively. (D) Average-intensity curves of two measurements.
Download figure:
Standard image High-resolution imageIn order to confirm the thermal trapping effect, we increased the trapping time from 30 s to 60 s with the same imaging interval time of 2 s. In other words, we reduced the frequency of taking 2D images, during which the laser beam is moving and the heat accumulated at the center is dissipating until the laser was focused at the center again. Therefore a more obvious trapping effect can be obtained in figure 2(C) (movie S2 in supplementary materials). At 60 s, some GNRs are already trapped at the center (figure 2(C); left panel). At 240 s, a large cluster of GNRs are observed in the center with ~10 µm diameter. More GNRs are also observed in the whole FOV after 240 s in comparison to 60 s, not only in the center region.
These results demonstrate that: (1) GNRs can be trapped at the center with only 0.5 mW average power and the optothermal trapping attracts GNRs from a large area as shown in the supplementary movies (movie S1 and S2). Our observation confirms that this process is convective flow assisted; (2) Although the heat was dissipating during the 2 s laser scanning, the convective flow is still enough to attract more GNRs to the center; (3) The trapping process can be quantified by the average intensities over time as shown in figure 2(D) (excluding the big clusters due to the fact particles were aggregated before entering the FOV). A rapid increase of intensity over time implies a positive feedback loop as described earlier by Gu et al [22]. Trapping with less frequent laser scanning, i.e. every 60 s, results a faster increase of intensities at the same time points in comparison to scanning every 30 s. This observation suggests less heat was dissipating away and a stronger convective flow was obtained.
By introducing another laser for imaging, we can trap GNRs continuously without scanning the trapping laser beam. This is the 'trapping only' mode described in the experimental section. A 488 nm laser was used for both transmission and confocal imaging. The NIR laser at 840 nm with 30 mW power was focused at the center of glass surface for trapping. Using high laser powers will accelerate the trapping process and make the visualization easier. A 5 min video was acquired (Movie S3 in supplementary materials). Figure 3(A) shows selected frames with a FOV of 210 µm × 210 µm. The collected luminescence signal (color coded in green) is from both two-photon excitation at the focal point by the 840 nm laser without scanning and one-photon excitation by the 488 nm laser with raster scanning. From this time series, the increase of green luminescence at the focal region indicates the trapping of GNRs at the focal point, which is consistent with figure 2 above.
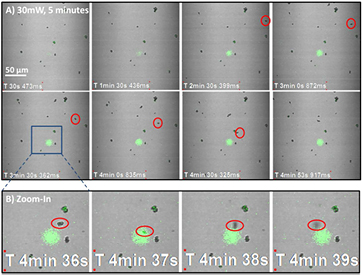
Figure 3. A time series of a continuous optothermal trapping. A 5 min video was recorded at the 'trapping only' mode in which the NIR beam is focused at the glass surface and a 488 nm laser was scanning to obtain the transmission 2D image. The FOV is 210 µm × 210 µm. (A) Selected frames at different time points. (B) Zoom-in images from (A) shows a GNR cluster (red-circled) was first trapped to the focal region and then kicked out.
Download figure:
Standard image High-resolution imageAlthough the movement of single GNR is not easy to distinguish in the transmission images, the movement of GNR clusters (one example is circled in red) reveals the contribution of the convective flow figure 3(A). Clearly, this cluster was moved by the flow from outside the FOV (210 µm × 210 µm) to the focal region, i.e. the trapping range is extended more than the FOV due to the convective flow. Figure 3(B) shows detailed behavior of this cluster in the focal region. It was trapped towards the center spot. But within 1 s at focal region, it was levitated and deflected from the top. This observation is consistent with traditional optothermal trapping, but in this work it was obtained with the wavelength at 840 nm. Meanwhile, some clusters are precipitated on the glass surface firmly and cannot be moved until a strong flow can be generated.
In summary, the trapping process can be described as following: in the focal spot, the absorbed photons by GNRs are quickly converted into heat which leads to a rapid local temperature increase which causes thermophoresis and convectional flow, figure 1(B). Thermophoresis moves particles from hot to cold regions, whereas the convection flow transports particles downwards or upwards with respect to the focal region. As a net result, more GNRs nearby are attracted to the focal spot and convert more heat into the water to trap even more GNRs. This positive feedback loop eventually will trap GNRs from a large range far beyond the optical focal spot. Interestingly, trapped GNRs should be laterally repelled by thermophoresis and eventually form a ring pattern as discussed earlier by Braun et al, who trapped DNA in a ring pattern with 1480 nm laser [30]. Such a ring structure is only formed on the glass surface when the laser focus is away from the surfaces. Here we focused the trapping beam exactly on the glass surface, the trapping of a GNR in this small spot is highly dynamic and a ring pattern is hard to observe. Instead the ring pattern can be obtained when we shift the focal spot away from the glass surface as described below.
Patterning of GNRs on top and bottom surfaces away from the trapping laser spot
By focusing the laser beam inside the GNR containing suspension and away from the glass surfaces, we are able to direct the GNRs to form a ring pattern on the glass surface. In the following experiments, a chamber was made with two parallel glass surfaces about ~80 µm apart. The chamber was filled with the stock GNR solution. The trapping beam was 840 nm.
First, we focused the laser beam 10 µm (z = −10 µm) below the top cover slip (top surface (a) in figure 4(A)) with 138 mW average power. After 2 min, a TPEF image was acquired on surface (a) with 0.5 mW power. Figure 4(B) shows a ring structure of immobilized GNRs. We analyzed the spectra at every pixel of this ring with the spectral phasor approach [35] (figure 4(C)). The spectral image shows that most immobilized GNRs maintained their spectra as in solution with a central average wavelength of ~500 nm. However, a few red shifted pixels at ~630 nm are seen which suggests that a fraction of immobilized GNRs are damaged or higher order aggregates and the plasmon is changed [35].
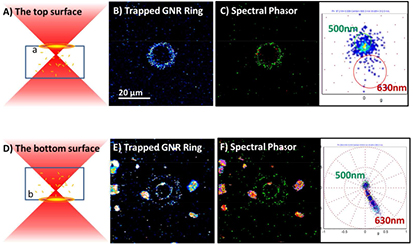
Figure 4. Trapping and patterning of GNRs on top and bottom surfaces. (A) Diagram of trapping and patterning on the top surface where the focus was 10 µm below. (B) A ring pattern was formed on the top surface. (C) Spectral phasors revealed that majority of GNRs on the ring maintained their spectral info as in solution, indicating the integrity or non-plasmon-coupling of GNRs. (D) Diagram of trapping and patterning on the bottom surface where the focus was 10 µm above. (E) A ring pattern was formed on the bottom surface. (F) Spectral phasors revealed that the majority of GNRs on the ring maintained their spectral info as in solution. Big clusters with red-shifted spectral info indicate the plasmon-coupling between GNRs in aggregates.
Download figure:
Standard image High-resolution imageA similar procedure was done at the bottom coverslip (bottom surface (b) in figure 4(D)). The trapping laser with 106 mW power was focused at 10 µm above surface (b) (z = 10 µm) for 1 min first and then at 5 µm above surface (b) (z = 5 µm) for another 1 min. The TPEF image on surface (b) shows a double-ring pattern (figure 4(E)). Spectral phasor analysis (figure 4(F)) shows that GNRs of the double-ring pattern have the same spectra as in suspension with a central emission at ~500 nm. However, some trapped GNR clusters also show red-shifted phasors (~630 nm), which could imply plasmon coupling between GNRs within the clusters. Some GNRs on the surface rings disappeared after a couple of minutes in the absence of the trapping laser (data not shown), which implies that these GNRs are transiently attached to the surface and can diffuse away if the trapping laser is turned off.
The above trapping and patterning phenomenon can be explained by the thermophoretic depletion and the convectional flow, figure 1(B). In our setup, the flow of particles can be easily visualized by the transient immobilization of the particles on the glass surfaces placed at a distance from the laser focal point.
Size control via different laser powers and objectives with different numerical apertures
The size of the ring patterns can be controlled by varying laser power, the numerical aperture of the objective and the distance between the focal point and the surface. In one measurement, GNRs were exposed with 15 mW for 1 min and 114 mW for 10 s respectively, at z = 5 µm above surface (b). Results are shown in figures 5(A) and (B). The ring diameter (figure 5(A)) is ~5.6 µm at 15 mW and ~9.4 µm at 114 mW (figure 5(B)). GNRs moved to the surface by convective flow and deposited in a region which depends on the net result of thermophoresis and the convective flow, figure 1(B).

Figure 5. Size control via different laser powers, Objectives with different NA and the distances between the focal spot and the glass surface. (A) A ring with ~5.6 µm diameter was formed after 1 min of 15 mW trapping at 5 µm above the glass bottom surface. (B) A ring with ~9.4 µm diameter was formed after 10 s of 114 mW trapping at 5 µm above the glass bottom surface. (C) A double ring structure with a 60× water objective (NA = 1.2) and 114 mW power at z = 5 µm for 2 min and z = 10 µm for 30 s. The outer diameter is ~20 µm and the inter diameter is ~10 µm. The central accumulation was due to trapping at z = 0 for 1 min with 0.5 mW laser power. (D) A double ring structure with a 40× water objective (NA = 0.8) and 114 mW power at z = 5 µm for 3 min and at z = 10 µm for 30 s. The outer diameter ~14 µm and the inter diameter ~9 µm.
Download figure:
Standard image High-resolution imageIn another measurement, we used objectives with different numerical apertures and also tested different distances between the focal point and the glass surface. A 60 × water objective (NA = 1.2) was used to focus the 114 mW laser beam at z = 5 µm for 2 min and at z = 10 µm for 30 s. A double-ring pattern was then obtained in figure 5(C). The outer diameter is ~20 µm and the inner diameter is ~10 µm. In comparison, a 40 × water objective (NA = 0.8) was used to focus the 114 mW beam at z = 5 µm for 3 min and at z = 10 µm for 30 s. A double-ring pattern is shown in figure 5(D) with the outer diameter ~14 µm and the inner diameter ~9 µm.
Redistribution after trapping and melting of GNRs with excessive laser heating
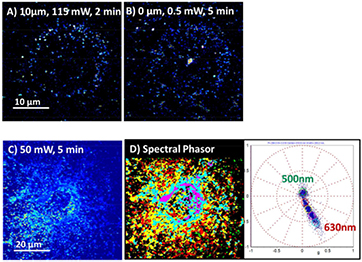
In the previous section we proved that the formation of ring patterns can be controlled by varying trapping conditions. Interestingly we found that applying the trapping laser at different z planes on an already formed ring can easily redistribute GNRs on the ring. An example is shown in figures 6(A) and (B). The trapping was performed with 114 mW laser power at z = 10 µm for 2 min (figure 6(A)) followed by 0.5 mW power at z = 0 µm (i.e. glass surface) for another 5 min (figure 6(B)). Clearly, by shifting the focus from z = 10–0 µm, the trapped GNRs on the ring were driven towards the center and a new accumulation of GNRs at the focal region is observed. With this procedure, more complicated patterns can be made since patterns can be altered after formation. However during the trapping, GNRs can also be damaged with excessive heating.
Figure 6. Redistribution of trapped GNRs and melting of GNRs with excessive laser heating. (A) A ring formed by an 114 mW laser power at z = 10 µm for 2 min. (B) The central accumulation and redistribution of GNRs after 0.5 mW trapping at z = 0 µm for another 5 min. (C) Accumulation and melting of GNRs after a 50 mW laser beam at z = 0 µm for 5 min. (D) Spectral phasors indicate the change of spectra.
Download figure:
Standard image High-resolution image
For example, figure 6(C) shows damage or melting of GNRs after a 5 min continuous experiment with 50 mW laser power tightly focused at z = 0 µm, i.e. on the glass surface. We found that: (1) the GNRs were trapped around the focused area and extended to the whole FOV (66 µm × 66 µm); (2) The corresponding color-coded spectral phasor plot in figure 6(D) shows that the spectra of most GNRs were shift to red with the central emission wavelength ~630 nm. The distribution along the radial direction in the phasor plot indicates that the GNRs have different spectral widths. (In the phasor plot, the farther the phasor is from the origin, the narrower the spectral width.) GNRs with altered spectra typically means damaged GNRs [35] or tight plasmon coupling of GNRs among each other; (3) Interestingly, GNRs with different spectral-phasors also show ring patterns in figure 6(D). GNRs coded with purple and cyan (narrower width) are close to the center, whereas GNRs coded with yellow and red (wider width) are far from the center. Moreover, only a few GNRs located at the peripheral area maintain the spectra (green) found in the suspension [35].
Conclusions
In summary, we report a self-assisted optothermal trapping of GNRs under two-photon excitation at their LSPR wavelength. The high optothermal conversion efficiency of GNRs allows an effective conversion of absorbed photons into heat and leads to the optothermal trapping effect, which typically is only obtained at the wavelengths with high water absorption. During the trapping process, GNRs perform both as the trapping targets and the promoters, which help the trapping of more particles.
Here the optothermal trapping of GNRs on the glass surface was observed with as low as 0.5 mW laser power and the trapping range can be over 210 µm. We also found and discussed the formation of ring patterns of GNRs on glass surfaces. These ring patterns can be controlled by the laser power, the numerical aperture of objectives and the distance between the laser focal point and the glass surface. The obtained spectral phasor information with intensity maps together could help understanding the optothermal trapping of GNRs. Our results pave the way to obtain localized heating and flows in solutions, but they could also be applied to induce flows in cells or tissue where GNRs can be as photothermal agents for treatment. GNRs are biocompatible and can be internalized by certain cells with or without targeting ligands or can be delivered to tumor tissues based on the enhanced permeability and retention (EPR) effect. With NIR irradiation, the excessive heat can be generated via localized GNRs to the local environments which are different than in the solutions. But the same effect could affect cytoplasm or blood flow which may worth further studies.
Acknowledgments
This work was partially supported by grants from NIH P41-GM103540 and NIH P50-GM076516.