


ABSTRACT
We present the first study of deuteration toward the protostellar shock L1157-B1, based on spectral surveys performed with the Herschel-HIFI and IRAM 30 m telescopes. The L1157 outflow is driven by a low-mass Class 0 protostar and is considered the prototype of the so-called chemically active outflows. The young (2000 yr), bright blueshifted bow shock, B1, is an ideal laboratory for studying the gas chemically enriched by the release of dust mantles due to the passage of a shock. A total of 12 emission lines (up to Eu = 63 K) of CH2DOH, HDCO, and DCN are detected. In addition, two lines of NH2D and HDO are tentatively reported. To estimate the deuteration, we also extracted from our spectral survey emission lines of non-deuterated isotopologues (13CH3OH, H213CO, H13CN, H213CO, and NH3). We infer higher deuteration fractions for CH3OH (D/H = 0.2–2 × 10⁻²) and H2CO (5–8 × 10⁻³) than for H2O (0.4–2 × 10⁻³), HCN (∼10−3), and ammonia (⩽3 × 10⁻²). The measurement of deuteration of water, formaldehyde, and methanol in L1157-B1 provides a fossil record of the gas before it was shocked by the jet driven by the protostar. A comparison with gas-grain models indicates that the gas passed through a low-density (⩽103 cm−3) phase, during which the bulk of water ices formed, followed by a phase of increasing density, up to 3 × 104 cm−3, during which formaldehyde and methanol ices formed.
Export citation and abstract BibTeX RIS
1. INTRODUCTION
A newborn Sun-like star generates, during its earliest stages, a fast and well-collimated jet, possibly surrounded by a wider angle wind. In turn, the ejected material drives fast bow shocks heating (up to thousands of K), compressing and accelerating the surrounding ambient medium. Shocks trigger endothermic chemical reactions and ice grain mantle sublimation or sputtering. As a consequence, several molecular species undergo significant enhancements in their abundances (van Dishoeck & Blake 1998), as observed at millimeter wavelengths toward a number of outflows (Garay et al. 1998; Bachiller & Pérez Gutiérrez 1997, BP97 hereafter; Jørgensen et al. 2007; Arce et al. 2008).
The L1157 region, located at 250 pc (Looney et al. 2007), hosts a Class 0 protostar (L1157 mm) driving a spectacular chemically rich bipolar outflow (Bachiller et al. 2001), which is one of the best laboratories to study how shocks affect the molecular gas. The L1157 mm southern lobe is associated with two cavities seen in the IR H2 and CO lines (e.g., Neufeld et al. 2009; Gueth et al. 1996), likely created by episodic events in a precessing jet. Located at the apex of the more recent cavity, the bright bow shock called B1 has a kinematical age of 2000 years (Gueth et al. 1996). The bow shocks, when mapped with the IRAM Plateau de Bure Interferometer (PdBI) and Very Large Array (VLA) interferometers, reveal a clumpy structure, with clumps located at the wall of the cavity (e.g., Tafalla & Bachiller 1995; Benedettini et al. 2007; Codella et al. 2009). As part of the Herschel8 Key Program CHESS9 (Chemical Herschel Surveys of Star forming regions; Ceccarelli et al. 2010), the brightest bow shock L1157-B1 is currently being investigated with a spectral survey in the ∼78–350 GHz interval using the IRAM 30 m telescope, and in the ∼500–2000 GHz range using the Herschel-HIFI instrument (de Graauw et al. 2010). Both interferometric and single-dish surveys confirm that L1157-B1 is chemically rich, especially in molecules thought to be released from dust mantles such as H2CO, CH3OH, and NH3 (e.g., Codella et al. 2010), as well as typical tracers of high-speed shocks such as SiO (e.g., Gusdorf et al. 2008). Thus, the young L1157-B1 shock offers an exceptional opportunity to investigate in details the chemical compositions of the grain ice mantles. Several studies have shown that, in low-mass star-forming regions, the ice formation is accompanied by a spectacular increase of the molecular deuteration (e.g., Ceccarelli et al. 2007).
In this Letter, we present a study of the molecular deuteration based on a systematic search for key grain mantle species toward L1157-B1. We show how deuteration can be used to obtain key information about the chemical and physical history of the pre-shock gas.
2. OBSERVATIONS AND DATA REDUCTION
Almost all the reported transitions (see Table 1) were observed toward L1157-B1 with the IRAM 30 m telescope at Pico Veleta (Spain), during the unbiased spectral survey at 0.8, 1, 2, and 3 mm (B. Lefloch et al., in preparation). The source coordinates are  δJ2000 = +68°01'10
 5, which also correspond to the position used during the Herschel-HIFI and CSO observations (see below). The survey was performed during several runs in 2011 and 2012, using the broadband EMIR receivers and the Fourier transform spectrometer in its 200 kHz resolution mode, corresponding to velocity resolutions in the 0.9–1.5 km s−1 range, depending on line frequency. The main-beam efficiency (ηmb) varies from 0.87 (at 81 GHz) to 0.51 (at 258 GHz).
The HDO(111–001) and p-H2O(202–111) transitions at 893.6 and 987.9 GHz, respectively, were observed with Herschel-HIFI on 2010 October 26 and 28, during the unbiased spectral survey of the HIFI bands 3b and 4a. The receiver was tuned in double side band, with a total integration time of 284 and 453 min to cover bands 3b and 4a, respectively. The Wide Band Spectrometer (WBS) was used, with a velocity resolution of 0.15 km s−1 (p-H2O) and 0.17 km s−1 (HDO). The main-beam efficiency is, according to Roelfsema et al. (2012), 0.75 (at 893.6 GHz) and 0.74 (at 987.9 GHz). The Herschel data were processed with the ESA-supported package HIPE 810 (Herschel Interactive Processing Environment). FITS files from level 2 were then created and transformed into GILDAS11 format for data analysis. Finally, a search for HDO(10, 1–00, 0) emission at 464.9 GHz (ηmb = 0.5) has been performed in 2011 December with the CSO 10.4 m telescope on Mauna Kea (Hawaii, USA). A 2048-channel spectrometer providing a spectral resolution of 0.4 km s−1 was used.
All the spectra were smoothed to a lower velocity resolution (up to 2 km s−1) to increase sensitivity, and are reported here in units of main-beam brightness temperature (TMB).
3. DEUTERATED SPECIES AT LOW VELOCITY
A total of 12 emission lines of CH2DOH, HDCO, and DCN have been detected with the IRAM 30 m antenna. Table 1 lists the spectroscopic and observational parameters of all the transitions observed. Remarkably, HDCO has been observed with six lines with upper level energy over the Boltzmann constant (Eu) up to 63 K. In addition, two weak lines of p-NH2D (S/N = 3) and HDO (S/N = 4) have been tentatively detected (see Figure 1) with the IRAM and Herschel-HIFI telescopes. In particular, the p-NH2D measurement will be conservatively considered as an upper limit in the following analysis. Note that the upper limit on the HDO column density provided by the spectra obtained at the IRAM and CSO telescopes is consistent with, and less constraining than, that obtained from the Herschel-HIFI spectrum.
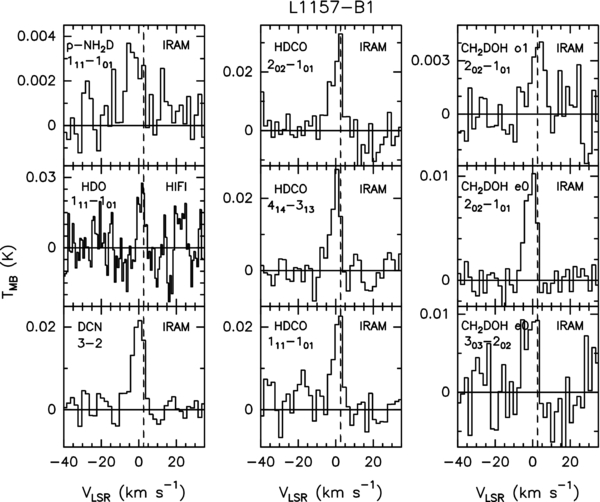
Figure 1. Examples of line profiles (TMB scale, not corrected for the beam dilution) of the deuterated molecules observed toward L1157-B1: species and transitions are reported. The vertical dashed line stands for the ambient LSR velocity (+2.6 km s−1; BP97).
Download figure:
Standard image High-resolution imageTable 1. List of Deuterated Molecular Species and Transitions Observed (in TMBa Scale, Not Corrected for the Beam Dilution)
| Transition | ν0b | Telescope | HPBW | Eub | dV | Tpeak | rms | Vpeak | FWHM | Fint |
|---|---|---|---|---|---|---|---|---|---|---|
| (MHz) | ('') | (K) | (km s−1) | (mK) | (mK) | (km s−1) | (km s−1) | (mK km s−1) | ||
| Deuterated species | ||||||||||
| p-NH2D(11, 1–10, 1) | 85925.70 | IRAM | 29 | 16 | 2.0 | 3.3(1.0) | 1 | −2.6(1.1) | 11.0(3.8) | 38.8(9.0) |
| DCN(2–1)c | 144827.99 | IRAM | 17 | 10 | 2.0 | 31.8(2.7) | 3 | −1.0(0.2) | 4.5(0.5) | 243.4(14.0) |
| DCN(3–2)c | 217238.64 | IRAM | 11 | 21 | 2.0 | 22.8(2.0) | 3 | −0.8(0.2) | 4.2(0.7) | 162.2(14.0) |
| HDO(21, 0–11, 1) | 80578.29 | IRAM | 30 | 47 | 1.5 | ... | 2 | ... | ... | ... |
| HDO(21, 1–21, 2) | 241561.55 | IRAM | 10 | 95 | 1.0 | ... | 4 | ... | ... | ... |
| HDO(10, 1–00, 0) | 464924.52 | CSO | 17 | 22 | 0.4 | ... | 76 | ... | ... | ... |
| HDO(11, 1–00, 0) | 893638.67 | HIFI | 24 | 43 | 0.6 | 25.1(5.6) | 9 | +1.5(0.5) | 3.8(0.8) | 101.0(23.0) |
| HDCO(20, 2–10, 1) | 128812.86 | IRAM | 19 | 9 | 2.0 | 29.6(5.9) | 5 | +0.7(0.6) | 7.4(1.3) | 210.9(28.0) |
| HDCO(21, 1–10, 1) | 134284.83 | IRAM | 17 | 18 | 2.0 | 22.9(2.3) | 2 | +1.4(0.2) | 4.0(0.5) | 97.6(11.0) |
| HDCO(11, 1–10, 1) | 201341.35 | IRAM | 12 | 27 | 2.0 | 23.0(2.8) | 3 | +1.1(0.4) | 5.7(0.9) | 139.7(19.0) |
| HDCO(41, 4–31, 3) | 246924.60 | IRAM | 10 | 38 | 2.0 | 26.9(2.8) | 3 | +0.2(0.3) | 5.0(0.8) | 142.9(18.0) |
| HDCO(40, 4–30, 3) | 256585.43 | IRAM | 10 | 31 | 2.0 | 20.3(4.3) | 4 | +0.6(0.5) | 4.2(0.9) | 91.7(19.0) |
| HDCO(42, 3–32, 2) | 257748.76 | IRAM | 10 | 63 | 2.0 | 10.1(1.7) | 5 | −0.1(0.4) | 2.2(0.7) | 38.6(13.0) |
| CH2DOH(20, 2–10, 1)o1 | 89251.16 | IRAM | 28 | 25 | 2.0 | 4.2(0.3) | 1 | +2.9(0.9) | 7.4(2.1) | 33.2(8.0) |
| CH2DOH(20, 2–10, 1)e0 | 89407.91 | IRAM | 28 | 7 | 2.0 | 10.2(1.4) | 1 | −1.0(0.9) | 6.7(0.6) | 72.4(7.0) |
| CH2DOH(30, 3–20, 2)e0 | 134065.60 | IRAM | 18 | 13 | 2.0 | 10.0(3.0) | 3 | −1.2(1.0) | 7.9(1.5) | 80.8(19.0) |
| Isotopologues | ||||||||||
| o-NH3(10–00)d | 572498.07 | HIFI | 39 | 28 | 0.8 | 166.1(10.0) | 10 | +1.0(0.8) | ...e | 1211.3(41.0) |
| H13CN(1–0)c | 86340.18 | IRAM | 27 | 4 | 1.4 | 188.5(12.9) | 1 | −1.3(0.2) | ...e | 2031.9(9.0) |
| H13CN(3–2)c | 259011.82 | IRAM | 9 | 25 | 0.9 | 184.4(21.1) | 1 | −0.4(0.1) | 5.5(0.1) | 1424.6(58.7) |
| p-H2O(202–111) | 987926.76 | HIFI | 22 | 101 | 0.3 | 762.0(34.0) | 33 | −3.3(0.2) | ...e | 10586.1(361.5) |
| o-H213CO(21, 2–11, 1) | 137449.95 | IRAM | 18 | 7 | 0.9 | 208.9(23.7) | 4 | +1.5(0.1) | ...e | 1043.9(23.0) |
| p-H213CO(20, 2–10, 1) | 141983.74 | IRAM | 17 | 10 | 0.8 | 98.2(1.1) | 5 | +0.7(0.3) | ...e | 469.7(17.5) |
| o-H213CO(21, 1–11, 0) | 146635.67 | IRAM | 17 | 7 | 0.8 | 142.8(1.5) | 5 | +0.9(0.1) | ...e | 696.7(17.3) |
| o-H213CO(31, 3–21, 2) | 206131.63 | IRAM | 12 | 17 | 1.1 | 183.7(1.7) | 4 | +1.1(0.3) | ...e | 933.7(16.5) |
| p-H213CO(30, 3–20, 2) | 212811.18 | IRAM | 12 | 20 | 1.1 | 82.4(8.7) | 3 | +1.1(0.1) | ...e | 420.1(12.1) |
| p-H213CO(32, 2–22, 1) | 213037.34 | IRAM | 12 | 68 | 1.1 | 23.7(1.5) | 3 | +0.9(0.2) | 5.0(0.5) | 126.9(10.0) |
| p-H213CO(32, 1–22, 0) | 213293.57 | IRAM | 12 | 68 | 1.1 | 24.3(1.6) | 3 | +0.7(0.2) | 4.1(0.5) | 105.3(9.0) |
| o-H213CO(31, 2–21, 1) | 219908.52 | IRAM | 11 | 18 | 1.1 | 159.1(13.1) | 4 | +0.8(0.1) | ...e | 810.0(16.2) |
| 13CH3OH(5-1, 5–40, 4) | 79581.77 | IRAM | 31 | 32 | 1.5 | 14.2(2.0) | 2 | −1.5(0.3) | 6.7(0.7) | 100.8(9.0) |
| 13CH3OH(2-1, 2–1-1, 1) | 94405.16 | IRAM | 26 | 4 | 1.2 | 49.8(2.6) | 2 | +0.4(0.9) | 3.2(0.2) | 171.3(11.0) |
| 13CH3OH(20, 2–10, 1)++ | 94407.13 | IRAM | 26 | 8 | 1.2 | 85.8(2.6) | 2 | +0.2(0.8) | 6.7(0.2) | 610.0(16.0) |
| 13CH3OH(20, 2–10, 1) | 94411.02 | IRAM | 26 | 12 | 1.2 | 7.1(1.1) | 2 | −0.5(0.6) | 6.1(1.7) | 45.9(10.0) |
| 13CH3OH(00, 0–1-1, 1)++ | 109164.12 | IRAM | 23 | 13 | 1.1 | 9.9(2.7) | 2 | +0.5(0.3) | 2.6(0.7) | 26.7(7.5) |
Notes. The lines of isotopologues used for the analysis are also reported (see the text). aTMB = T*a × (Feff/ηmb), where T*a is the antenna temperature (corrected for the atmospheric attenuation for ground-based observations), and Feff and ηmb are the forward and main-beam efficiencies, respectively. bFrequencies and spectroscopic parameters have been extracted from the Jet Propulsion Laboratory molecular database (Pickett et al. 1998) for all the transition except those of CH2DOH, which have been extracted from the National Institute of Standards and Technology (NIST) molecular database (Lovas 1992) and Parise et al. (2006), and those of NH2D and 13CH3OH, extracted from the Cologne Database for Molecular Spectroscopy (Müller et al. 2005). Upper level energies refer to the corresponding ground state of each symmetry. cThe frequency refers to the F = 2–1, 3–2, and 4–3 components for the J = 1–0, 2–1, and 3–2 lines, respectively. dFrom Codella et al. (2010). eNon-Gaussian profile, with a prominent blue wing. Fint refers to the whole emitting region.
Download table as: ASCIITypeset image
All the spectra in Figure 1 display blueshifted lines peaking near 0 km s−1 (the systemic velocity is +2.6 km s−1; BP97), and a maximum blueshifted velocity between −5 and −10 km s−1, with line widths of 4–7 km s−1. The emission thus seems confined to the low-velocity range of the L1157-B1 outflow. However, the noise level in the present data set does not allow us to verify the association of emission from deuterated species with the highest outflow velocities (up to −40 km s−1) observed in CO, SiO, and H2O (e.g., Bachiller et al. 2001; Nisini et al. 2007; Lefloch et al. 2010). Previous interferometric PdBI and VLA images show that the molecular emission at low velocities comes from a clumpy arch-like structure, with a size of ∼15'' (e.g., Codella et al. 2009). In particular, this has been shown for CH3OH, HCN, and NH3 emission (Tafalla & Bachiller 1995; Benedettini et al. 2007).
To estimate the level of deuteration, we extracted lines of the corresponding non-deuterated 13C-isotopologues from the IRAM spectral survey, whenever possible. The deuteration fraction was derived by dividing the column density of the deuterated species by that of the corresponding non-deuterated molecule, and assuming [12C]/[13C] = 77 (Wilson & Rood 1994). In particular, we selected 13CH3OH, H213CO, and H13CN transitions (see Table 1) in the same excitation range as the observed deuterated molecules. This allowed us to minimize effects of the molecular excitation, as well as the opacity of the most abundant 12C-counterparts (also present in the IRAM survey, but not discussed here). For ammonia, given the non-detection of emission due to the 15N-isotoplogue, we used the o-NH3(10–00) emission line observed with Herschel-HIFI (Codella et al. 2010), which, being affected by absorption at the ambient cloud velocity, provides an upper limit. Finally, the CHESS–Herschel survey did not detect H218O emission, but it provides numerous H2O emission lines. A complete analysis of the water emission is still in progress (G. Busquet et al., in preparation). However, we report here the p-H2O(202–111) line at 988 GHz, the lowest-excitation transition not affected by strong absorption at low velocities (see Codella et al. 2010), where deuterated species emit.
For H2O, HDO, NH3, HCN, and DCN, we derived the column densities by using a non-LTE LVG code (Ceccarelli et al. 2003), the Daniel et al. (2011; H2O), Faure et al. (2012; HDO), Danby et al. (1988; NH3), and Dumouchel et al. (2010; HCN and DCN) collisional coefficients, and the Einstein coefficients from the Jet Propulsion Laboratory molecular database (Pickett et al. 1998). For DCN, we used the collisional rates of HCN (which has the same molecular symmetry), rescaled according to the different molecular weights. We fit the observed integrated line intensities assuming a volume density of 105–106 cm−3 and kinetic temperatures of 120–250 K, as shown by our previous analysis of the 12CO, 13CO, and HCl emission at the velocities where deuterated molecules emit. Finally, given that the collisional coefficients with H2 for NH2D are not available in the literature, we conservatively considered excitation temperatures in the 10–100 K interval. Table 2 shows that ammonia deuteration is not well constrained, with D/H ⩽ 3 × 10⁻², and consequently it will be not considered in the following discussion.
Table 2. Column Densities (Derived Using Rotation Diagrams, When Possible) and Deuteration
| Transition | Boltzmann Plots | LVGa | D/H | |
|---|---|---|---|---|
| Trot | Ntotb | Ntotb | ||
| (K) | (cm−2) | (cm−2) | ||
| CH2DOH | 53(50)c | 4(5) × 1013 | ... | 2 × 10⁻³–2 × 10⁻² |
| 13CH3OH | 13(2) | 3(1) × 1013 | ... | |
| HDCO | 9(3)–13(1) | 4(1)–5(1) × 1011 | ... | 5–8 × 10⁻³ |
| o-H213CO | 6(1) | 1(1) × 1011 | ... | |
| p-H213CO | 6(1)–33(4) | 7(1) × 1011–1(1) × 1012 | ... | |
| NH2Da | ... | ... | ⩽1–4 × 10¹²d,e | ⩽1–3 × 10⁻² |
| NH3a | ... | ... | ⩾5 × 10¹³d,e | |
| HDOa | ... | ... | 3–4 × 10¹²d,e | 4 × 10⁻⁴–2 × 10⁻³ |
| H2Oa | ... | ... | 2–6 × 10¹⁵d,e | |
| DCNa | ... | ... | 7 × 10¹¹–2 × 10¹²d,e | 5 × 10⁻⁴–3 × 10⁻³ |
| H13CNa | ... | ... | 1–2 × 10¹³d,e | |
Notes. For HDCO and p-H213CO we report both fits performed with (continuous line) and without (dot-dashed) the high-excitation (Eu ⩾ 60 K) transitions (see Figure 2). aFor H2O, NH3, and HCN, the uncertainty is dominated by the error in the line intensity (calibration and spectral noise). bWe assume [12CO]/[13CO] = 77 (Wilson & Rood 1994) and an emitting region size of 15'' (see the text). cUncertainties are reported in parentheses. dFor H2O, HDO, NH3, HCN, and DCN column densities are derived with an LVG code, whereas for NH2D, given that collisional rates with H2 are not available in literature, column densities are obtained assuming excitation temperatures of 10–100 K (see the text). eWe assume an ortho-to-para ratio of 3 for H2O and NH2D, and 2 for NH3, according to Umemoto et al. (1999).
Download table as: ASCIITypeset image
For CH2DOH and HDCO, it is not possible to carry out a non-LTE analysis, as the collisional coefficients are not presently available. Figure 2 presents rotational diagrams for CH2DOH and HDCO as well as for the corresponding 13C-isotopologues, assuming (1) optically thin emission and (2) a 15'' source size based on the PdBI and VLA images. All the spectra have been corrected for the corresponding beam dilution. We analyzed the ortho and para forms of formaldehyde separately, as their abundance ratio seems to differ from the LTE value of 3:1. Table 2 lists the derived rotational temperatures (Trot) and column densities (Ntot). The rotational temperatures for 13CH3OH is 13 ± 2 K, in good agreement with previous estimates based on methanol lines in the same excitation range (12 K; Bachiller et al. 1995; Codella et al. 2010). On the other hand, the Trot of CH2DOH is quite uncertain (53 ± 50 K), being based only on three measurements. These rotational temperatures represent a lower limit to the kinetic temperature (Tkin) when the line is optically thin. The uncertainty of the rotational temperature is the largest source of error for the computation of the partition function and hence of the column density. Conservatively, we took into account the measured Trot range (from 13 K, 13CH3OH, to 53 K, CH2DOH) to derive an interval for Ntot of 13CH3OH and CH2DOH, and thus for deuteration: D/H = 0.2–2 × 10⁻². For formaldehyde, we derive rotational temperatures of 6 ± 1 K (o-H213CO), 33 ± 4 K (p-H213CO), 13 ± 1 K (HDCO). However, if we consider only the formaldehyde lines in the same excitation range by excluding the p-H213CO and HDCO lines with Eu ⩾ 60 K, we infer values for Trot which are in a much better agreement: 6 ± 1 K and 9 ± 3 K, respectively, for p-H213CO and HDCO. This could reflect an increase of Trot with line excitation. A large range of Tkin and  is naturally expected in a shocked region, and indeed we have recently found evidence for warm (up to ∼2000 K) gas (Benedettini et al. 2012). This is consistent with our methanol HIFI observations (Codella et al. 2010), which give Trot = 12 K for Eu ⩽ 50 K and Trot = 106 K for Eu between 50 and 220 K. This discussion is out of the scope of the present Letter, and will not be further pursued, but it justifies a posteriori the selection of only the 13C-isotopologues transitions at the same excitation as those of the deuterated species observed. Given the Trot uncertainties, the formaldehyde deuteration is 5–8 × 10⁻³.
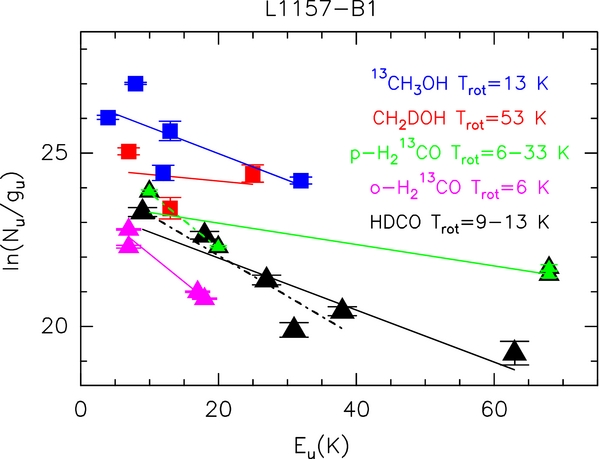
Figure 2. Rotation diagrams for HDCO (black triangles) and CH2DOH (red squares). For a comparison, we also show the rotation diagrams for the p-H213CO (green triangles), o-H213CO (magenta triangles) and 13CH3OH (blue squares) transitions selected for the analysis (see Table 1). An emitting region size of 15'' is assumed (see the text). The parameters Nu, gu, and Eu are, respectively, the column density, the degeneracy and the energy (with respect to the ground state of each symmetry) of the upper level. The derived values of the rotational temperature are reported. For HDCO and p-H213CO we report both fits performed with (continuous line) and without (dot-dashed) the high-excitation (Eu ⩾ 60 K) transitions (see the text).
Download figure:
Standard image High-resolution image4. DEUTERATION IN THE SHOCKED GAS
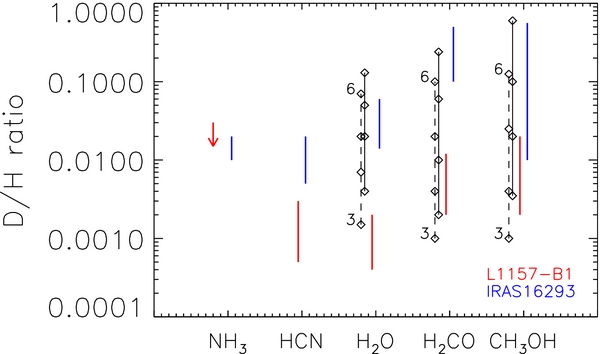
The analysis in the previous section (Table 2) shows that the deuteration of H2O (0.4–2 × 10⁻³) and HCN (∼10−3) is lower than that found for formaldehyde (5–8 × 10⁻³) and methanol (0.2–2 × 10⁻²). Figure 3 shows the deuteration fraction for the five species studied here toward L1157-B1 (Table 2) together with the corresponding values found in the hot-corino surrounding the low-mass star, IRAS16293-2422. The following two considerations stem from this plot:
- 1.In both sources, the deuteration of H2O and HCN seems to be lower than that of H2CO and CH3OH;
- 2.The deuteration in L1157-B1 is systematically lower, by about a factor 10, than that in IRAS16293-2422.
Figure 3. Deuterium fractionation of CH3OH, H2CO, H2O, HCN, and NH3 as found toward L1157-B1 (red) and IRAS16293–2422 (blue; from Loinard et al. 2001; Parise et al. 2002, 2004). Black diamonds stand for the prediction of Taquet et al. (2012b) for pre-shock gas densities of 103, 104, 105, and 106 cm−3 (see labels) and temperatures of 10 (dashed line) and 20 K (solid).
Download figure:
Standard image High-resolution image
As proved by several previous studies (e.g., Bachiller et al. 2001), the gas-phase composition in L1157-B1 is dramatically affected by the grain mantle ices, because of their sputtering or destruction (see Introduction). Our new observations fully agree with the picture that water, formaldehyde, and methanol are mostly icy mantle components, for which we estimate abundances12 of ⩾10−6, ∼3 × 10⁻⁸ and ∼7 × 10⁻⁷, respectively. Conversely, HCN is likely a present-day gas-phase product (Bachiller et al. 2001). Therefore, our HDO, HDCO, and CH2DOH observations provide us with a fossil record of the conditions at the time when the ices were formed: the deuteration of these ices. In fact, for the densities and temperatures involved, it takes about 105–106 yr to lose the memory of the composition of the sublimated material (Charnley et al. 1997; Osamura et al. 2004). This is at least two orders of magnitude longer than the age of the L1157-B1 shock, 2000 yr (Gueth et al. 1996; Arce et al. 2008). In order to confirm that the high deuteration observed is in fact a fossil record of the pre-shock phase, we ran a shock model using UCL−CHEM (Viti et al. 2011) for a small range of pre-shock densities and shock velocities and, indeed, we always find that during the shocked phase the deuteration fractionation does not vary.
Several studies have pointed out that water, formaldehyde, and methanol are mainly formed on the grain surfaces. Specifically, while water is formed by the hydrogenation of O and O2 landing on the grain surfaces, formaldehyde and methanol are the hydrogenation products of CO (e.g., Tielens & Hagen 1982; Charnley et al. 1997). The first step of the oxygen hydrogenation is barrierless and proceeds fast, whereas the CO hydrogenation is slow because it possesses an activation barrier. The result is that, although O and CO have similar binding energies (namely they sublimate at similar grain temperatures), water ices form faster. This is confirmed by the models of Cazaux et al. (2011) and Taquet et al. (2012a, 2012b). In particular, Taquet et al. (2012a, 2012b) have taken into account the coupled gas and grain-surface chemical reactions and predicted that these species form in subsequent phases: (1) water first, at the molecular cloud stage with no CO depletion; (2) formaldehyde second, when the cloud becomes denser and CO starts to freeze-out onto the grain mantles; (3) and finally methanol, when CO is highly depleted. Since the three species are formed by hydrogenation of O (O2) and CO, their deuteration depends on the atomic D/H ratio, which increases with time, along with the increasing CO depletion, and with the total density. The measured deuteration value of water, formaldehyde, and methanol is in full agreement with these predictions.
The same theoretical calculations predict that the deuteration on grains increases with density (for the same reasons as above, namely because the CO depletion increases). Comparison with the Taquet et al. (2012b) model gives precise indications on the conditions of the L1157-B1 gas before it was shocked (see Figure 3). First, water ice likely formed at dust temperatures ∼20 K, and low densities, ⩽103 cm−3. Second, formaldehyde, and methanol formed when the cloud reached a higher density, 103–3 × 104 cm−3. Note the difference with the case of IRAS16293-2422, where higher densities are required to obtain the larger observed deuteration ratios. This is in agreement with the idea that the L1157-B1 position is located in the outer portion of the L1157 dense core envelope, whereas the IRAS16293-2422 spectra are observed close to the protostar, where the density is expected to be higher.
5. CONCLUSION
The measure of the deuteration of water, formaldehyde, and methanol in L1157-B1 provides us with a fossil record of the past history of the gas, before it was shocked by the jet emanating from L1157 mm. The gas passed through a first tenuous (⩽103 cm−3) phase, during which the bulk of water ices formed, followed by a phase of increasing density, up to 3 × 104 cm−3, during which formaldehyde and methanol ices were produced. The shock released into the gas phase at least part of the grain mantle ices. Once again, the relatively simple geometry of the shocked material, makes L1157-B1 an ideal laboratory for testing these ideas and models, as shown by the successful comparison with the Taquet et al. (2012b) model.
HIFI has been designed and built by a consortium of institutes and university departments from across Europe, Canada, and the United States under the leadership of SRON Netherlands Institute for Space Research, Groningen, The Netherlands and with major contributions from Germany, France, and the US. Consortium members are: Canada: CSA, University of Waterloo; France: CESR, LAB, LERMA, IRAM; Germany: KOSMA, MPIfR, MPS; Ireland, NUI Maynooth; Italy: ASI, IFSI-INAF, Osservatorio Astrofisico di Arcetri-INAF; Netherlands: SRON, TUD; Poland: CAMK, CBK; Spain: Observatorio Astronómico Nacional (IGN), Centro de Astrobiología (CSIC-INTA); Sweden: Chalmers University of Technology - MC2, RSS & GARD; Onsala Space Observatory; Swedish National Space Board, Stockholm University - Stockholm Observatory; Switzerland: ETH Zurich, FHNW; USA: Caltech, JPL, NHSC. We also thank many funding agencies for financial support. Support for this work was provided by NASA through an award issued by JPL/Caltech. The CSO is supported by the National Science Foundation under the contract AST-08388361. C. Codella, C. Ceccarelli, and B. Lefloch acknowledge the financial support from the COST Action CM0805 "The Chemical Cosmos" and the French spatial agency CNES. G. Busquet and M. Vasta are supported by an Italian Space Agency (ASI) fellowship under contract number I/005/007.
Footnotes
- 8
Herschel is an ESA space observatory with science instruments provided by European-led principal Investigator consortia and with important participation from NASA.
- 9
- 10
HIPE is a joint development by the Herschel Science Ground Segment Consortium, consisting of ESA, the NASA Herschel Science Center, and the HIFI, PACS, and SPIRE consortia.
- 11
- 12