


ABSTRACT
The radical ion HCl+, a key intermediate in the chlorine chemistry of the interstellar gas, has been identified for the first time in the interstellar medium with the Herschel Space Observatory's Heterodyne Instrument for the Far-Infrared. The ground-state rotational transition of H35Cl+, 2Π3/2J = 5/2–3/2, showing Λ-doubling and hyperfine structure, is detected in absorption toward the Galactic star-forming regions W31C (G10.6-0.4) and W49N. The complex interstellar absorption features are modeled by convolving in velocity space the opacity profiles of other molecular tracers toward the same sources with the fine and hyperfine structure of HCl+. This structure is derived from a combined analysis of optical data from the literature and new laboratory measurements of pure rotational transitions, reported in the accompanying Letter by Gupta et al. The models reproduce well the interstellar absorption, and the frequencies inferred from the astronomical observations are in exact agreement with those calculated using spectroscopic constants derived from the laboratory data. The detection of H37Cl+ toward W31C, with a column density consistent with the expected 35Cl/37Cl isotopic ratio, provides additional evidence for the identification. A comparison with the chemically related molecules HCl and H2Cl+ yields an abundance ratio of unity with both species (HCl+ : H2Cl+ : HCl ∼ 1). These observations also yield the unexpected result that HCl+ accounts for 3%–5% of the gas-phase chlorine toward W49N and W31C, values several times larger than the maximum fraction (∼1%) predicted by chemical models.
Export citation and abstract BibTeX RIS
1. INTRODUCTION
Interstellar hydrides—that is, molecules or molecular ions containing a single heavy element with one or more hydrogen atoms—are invaluable probes of molecular clouds. Seven neutral diatomic hydrides have previously been detected in the interstellar gas—CH (Swings & Rosenfeld 1937), NH (Meyer & Roth 1991), OH (Weinreb et al. 1963), HF (Neufeld et al. 1997), SiH (tentative; Schilke et al. 2001), SH (Neufeld et al. 2012a), and HCl (Blake et al. 1985)—along with the three diatomic hydride cations—CH+ (Douglas & Herzberg 1941), OH+ (Wyrowski et al. 2010; Gerin et al. 2010a), and SH+ (Benz et al. 2010; Menten et al. 2011; Godard et al. 2012). Because the hydrides possess small moments of inertia relative to molecules that contain two or more heavy atoms, their rotational transitions lie at high frequencies, often inaccessible from ground-based observatories. Thus the study of hydrides has received a great impetus with the launch of the Herschel Space Observatory, which has facilitated spectroscopic observations of several interstellar species discovered in the past two years—H2Cl+ (Lis et al. 2010), OH+, H2O+ (e.g., Gerin et al. 2010a), and SH+ (Benz et al. 2010)—and the first observations of the ground-state rotational transitions of HF (Neufeld et al. 2010b; Phillips et al. 2010), CH (Gerin et al. 2010b), and CH+ (Falgarone et al. 2010a, 2010b).8
Because the chemical pathways leading to the formation of interstellar hydrides are fairly simple, the analysis of the observed abundances is straightforward, and provides key information about the physical and chemical conditions within the environments in which hydrides are found. Quantitative measurements of abundances of hydrides have yielded the cosmic ray ionization rate, the H2/H ratio, the UV radiation field, and the turbulence dissipation rate in diffuse gas clouds.
The HCl+ ion has long been predicted to be a key intermediate in the chlorine chemistry of diffuse clouds (Jura 1974; Dalgarno et al. 1974; van Dishoeck & Black 1986; Blake et al. 1986; Schilke et al. 1995; Amin 1996; and, most recently, Neufeld & Wolfire 2009). With an ionization potential (13.0 eV) slightly lower than that of atomic hydrogen (13.6 eV), atomic chlorine primarily exists as a singly charged ion in diffuse clouds. Like the F atom, the Cl+ ion reacts exothermically with H2 to produce a diatomic hydride. This reaction yields HCl+, which in turn reacts rapidly with H2 to give H2Cl+; all three ions can recombine with free electrons to yield the neutral products, Cl and HCl.
The identification of the key molecules in the interstellar chlorine chemistry has required nearly three decades. Although the ground-state rotational transition of HCl had been identified in the interstellar medium (ISM) over 25 years ago (Blake et al. 1985), the identification of H2Cl+ (Lis et al. 2010)—one of the two main molecular ions in this reaction scheme—was realized only recently with Herschel's Heterodyne Instrument for the Far-Infrared (HIFI). In this Letter, we report the first detection of the other key molecular ion—HCl+—by observations of its lowest rotational transition, 2Π3/2J = 5/2–3/2, in absorption toward two well-known star-forming regions: W31C (G10.6-0.4) and W49N.
2. OBSERVATIONS AND DATA REDUCTION
The observations were performed with Herschel/HIFI (de Graauw et al. 2010) using the double beam switching observing mode with a throw of 3' on 2010 October 14, and 2011 April 7 and 21.9 The 2Π3/2J = 5/2 − 3/2 transition of HCl+ near 1444 GHz was observed using five different local oscillator tunings for each source—four with the transition in the upper and one in the lower sideband—allowing the removal of any ambiguity in the line frequency intrinsic to observations performed with double-sideband mixers, and to correct for strong standing waves that occur at 1.44 THz. The spectra were processed using HIPE 8 (Ott 2010), providing fully calibrated spectra.
Data were taken with the wide band spectrometer that provides a total bandwidth of 2.4 GHz, with a spectral resolution of 1.1 MHz (0.23 km s−1 at 1444 GHz), and the two polarizations were averaged to maximize the signal-to-noise ratio. The difference between the separate averages of horizontal and vertical polarizations (Figure 1) is a few percent of the continuum level. Some of the horizontally polarized spectra were discarded from the final average since they suffered from insufficient mixer pumping (1 out of 5 for W31C and 3 out of 5 for W49N). Assuming a sideband gain ratio of unity, the remaining spectra were reduced and normalized as Flux/Continuum Flux = 2Tl/Tc − 1, where Tl and Tc are, respectively, line and continuum double-sideband antenna temperatures. Figure 1 shows the final averages. Over most of the range 1443.8–1445 GHz, the total on-source integration time was 1700 s for W49N and 2300 s for W31C.
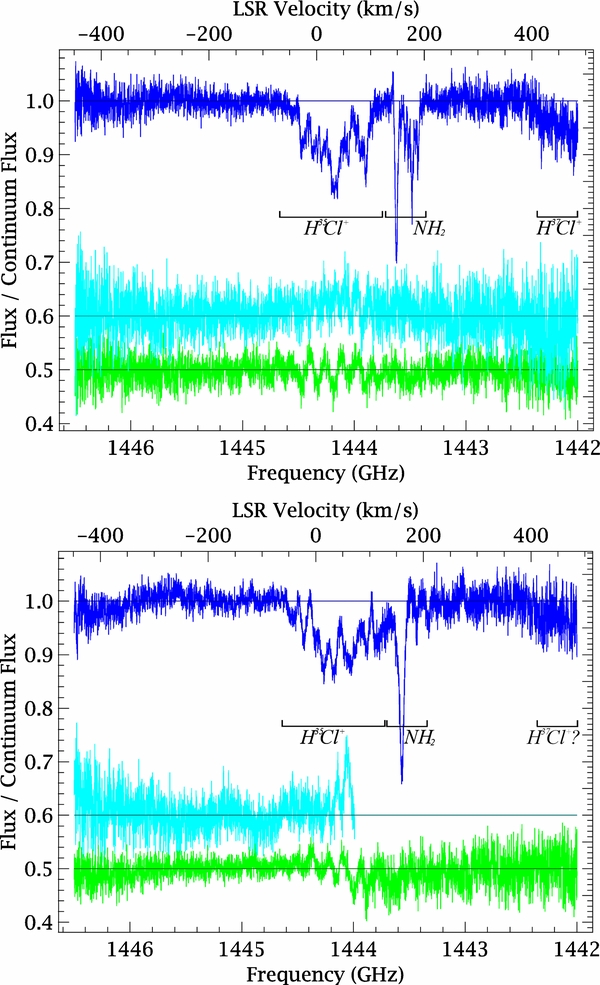
Figure 1. Averaged spectra toward W31C ( , δ = −19°55'50
 0 (J2000); upper panel) and W49N (
 , δ = 9°06'120 (J2000); lower panel). Reduced integration time and degraded sensitivity cause higher noise near the band edges. The differences between horizontal and vertical polarization (cyan, shifted for clarity to 0.6 K), as well as between data reduced with the standard and an alternative pipeline optimized for standing wave removal (green, at 0.5 K), are also shown. In W49N, frequencies below 1444 GHz were covered only in the vertical polarization.
Download figure:
Standard image High-resolution imageHot electron bolometer mixers are susceptible to instrumental drifts, common near 1.44 THz, that produce residual standing waves of about 5% of the continuum level. The predominant standing wave component is not optical in nature and cannot be optimally treated with the standard mitigation techniques. Nevertheless, the high redundancy of the spectra and the good agreement of the profiles observed in both sidebands give us confidence that the observed features are primarily due to astronomical signal. To evaluate the possible effect of standing waves on our column density estimates, in addition to the standard pipelining, we have reduced the data with an alternative algorithm, under development at the HIFI Instrument Control Center (Higgins 2011; Sherry et al. 2011), that uses a catalog of off-source position spectra to reduce the standing waves. The difference between the averaged spectra reduced with the standard and alternative pipelines (Figure 1) suggests that, although residual standing waves are present, they contribute to only a small fraction of the observed profile. The total opacity evaluated for the spectra processed in the two ways differs by less than 10% and 3% for W49N and W31C, respectively.
3. RESULTS AND DISCUSSION
Figure 1 shows a broad absorption feature centered at ∼1444.2 GHz, detected at a 10σ level, with several components, which we assign to the 2Π3/2J = 5/2–3/2 transition of H35Cl+. Narrower dips around 1443.5 GHz due to para-NH2 (21, 2–10, 1) appearing at exactly the expected frequencies assure the accuracy of the frequency calibration. Additional weak absorption features, detected at 6σ near 1442 GHz, are due to the corresponding H37Cl+ transition. Despite the low redundancy of spectra below 1443 GHz, the detection of H37Cl+ is quite secure in W31C, while it is more difficult to assess in W49N, due to the higher noise and worse baseline.
3.1. Spectroscopy of HCl+
An open-shell molecule with a 2Π3/2 electronic ground state, HCl+ exhibits a complex rotational spectrum, which results from the presence of electronic orbital and spin angular momenta, as well as hyperfine coupling of the Cl nucleus. Because of the large ratio of the spin–orbit constant to the rotational constant (A/B ∼ −66), coupling between electronic and rotational angular momenta is best described by Hund's case (a). As Figure 2 shows, the largest of these effects is spin–orbit coupling, which gives rise to two parallel fine-structure ladders of rotational transitions, Ω = 1/2 and Ω = 3/2—the latter lower in energy because of the large, negative spin–orbit constant, A (−926 K). The next smaller effect is Λ-doubling, which splits each rotational level, J, into two symmetrical levels (denoted by the parity symbols, e and f). The smallest effect, the hyperfine interaction of Cl nucleus (I = 3/2 for both isotopes), splits each Λ-doubled level into four levels; the blow-up of the 2Π3/2J = 5/2–3/2 transition in Figure 2 shows this pattern which consists of 18 hyperfine-split components allowed by the selection rules: ΔJ = ±1; ΔF = 0, ±1; e↔e; and f↔f.

Figure 2. Energy level diagram of H35Cl+. Top: spin ladders and Λ-doubled levels (e and f). Bottom: blow-up of the J = 5/2–3/2 transition showing, schematically, the hyperfine structure due to the chlorine nucleus. Energy levels are ordered by the total angular momentum, F. Transitions are shown by arrows and grouped by ΔF = 0 (blue), ΔF = +1 (green), and ΔF = −1 (plum), with solid arrows indicating e↔e and dashed ones, f↔f transitions. The Λ-doubling is greatly exaggerated for clarity.
Download figure:
Standard image High-resolution imageThe spectroscopic constants of HCl+, including Λ-doubling and the hyperfine coupling of chlorine, have recently been refined by a combined analysis of optical data from the literature (Sheasley 1972) and newly measured pure rotational transitions, and are reported in the accompanying Letter (Gupta et al. 2012). These constants are so accurate that they allow the frequencies of the 2Π3/2J = 5/2–3/2 transition to be calculated to an accuracy approaching 0.3 MHz (Table 1) or 0.06 kms−1 at 1444 GHz.
Table 1. Predicted Rest Frequencies and Line Parameters of the 2Π3/2J = 5/2–3/2 Transition of HCl+
| Transition | Frequency | El | Eu | gl | gu | μ2Sa | Aul | |
|---|---|---|---|---|---|---|---|---|
| F'–F'' | Parity | (MHz) | (K) | (K) | (10−2 D2) | (10−4 s−1) | ||
| H35Cl+ | ||||||||
| 2–3 | e–e | 1443642.3 ± 0.9 | 0.042 | 69.328 | 7 | 5 | 8.17 | 5.72 |
| 3–3 | e–e | 1443829.8 ± 0.6 | 0.042 | 69.337 | 7 | 7 | 114 | 57.3 |
| 2–3 | f–f | 1443892.7 ± 0.9 | 0.046 | 69.344 | 7 | 5 | 8.17 | 5.73 |
| 1–2 | e–e | 1443954.6 ± 0.5 | 0.021 | 69.322 | 5 | 3 | 12.3 | 14.3 |
| 2–2 | e–e | 1444077.0 ± 0.4 | 0.021 | 69.328 | 5 | 5 | 143 | 100 |
| 3–3 | f–f | 1444085.4 ± 0.6 | 0.046 | 69.353 | 7 | 7 | 114 | 57.3 |
| 4–3 | e–e | 1444087.2 ± 0.3 | 0.042 | 69.349 | 7 | 9 | 735 | 286 |
| 1–2 | f–f | 1444193.1 ± 0.5 | 0.025 | 69.337 | 5 | 3 | 12.3 | 14.3 |
| 1–1 | e–e | 1444243.3 ± 0.4 | 0.007 | 69.322 | 3 | 3 | 110 | 129 |
| 3–2 | e–e | 1444264.5 ± 0.5 | 0.021 | 69.337 | 5 | 7 | 457 | 229 |
| 2–2 | f–f | 1444323.6 ± 0.4 | 0.025 | 69.344 | 5 | 5 | 143 | 100 |
| 4–3 | f–f | 1444336.5 ± 0.3b | 0.046 | 69.365 | 7 | 9 | 735 | 287 |
| 2–1 | e–e | 1444365.7 ± 0.4 | 0.007 | 69.328 | 3 | 5 | 257 | 180 |
| 1–0 | e–e | 1444387.4 ± 0.7 | 0.000 | 69.322 | 1 | 3 | 122 | 143 |
| 1–1 | f–f | 1444486.6 ± 0.4 | 0.011 | 69.337 | 3 | 3 | 110 | 129 |
| 3–2 | f–f | 1444516.2 ± 0.5 | 0.025 | 69.353 | 5 | 7 | 457 | 229 |
| 2–1 | f–f | 1444617.1 ± 0.4 | 0.011 | 69.344 | 3 | 5 | 257 | 181 |
| 1–0 | f–f | 1444635.2 ± 0.8 | 0.004 | 69.337 | 1 | 3 | 122 | 143 |
| H37Cl+ | ||||||||
| 2–3 | e–e | 1441598.7 ± 0.7 | 0.035 | 69.223 | 7 | 5 | 8.17 | 5.70 |
| 3–3 | e–e | 1441754.9 ± 0.5 | 0.035 | 69.230 | 7 | 7 | 114 | 57 |
| 2–3 | f–f | 1441847.9 ± 0.7 | 0.039 | 69.239 | 7 | 5 | 8.17 | 5.7 |
| 1–2 | e–e | 1441858.4 ± 0.4 | 0.017 | 69.218 | 5 | 3 | 12.3 | 14.3 |
| 2–2 | e–e | 1441960.5 ± 0.3 | 0.017 | 69.223 | 5 | 5 | 143 | 99.8 |
| 4–3 | e–e | 1441969.0 ± 0.3 | 0.035 | 69.240 | 7 | 9 | 735 | 285 |
| 3–3 | f–f | 1442008.1 ± 0.5 | 0.039 | 69.246 | 7 | 7 | 114 | 57 |
| 1–2 | f–f | 1442098.2 ± 0.4 | 0.021 | 69.233 | 5 | 3 | 12.3 | 14.3 |
| 1–1 | e–e | 1442098.8 ± 0.3 | 0.006 | 69.218 | 3 | 3 | 110 | 128 |
| 3–2 | e–e | 1442116.7 ± 0.4 | 0.017 | 69.230 | 5 | 7 | 457 | 228 |
| 2–1 | e–e | 1442200.9 ± 0.3 | 0.006 | 69.223 | 3 | 5 | 257 | 180 |
| 2–2 | f–f | 1442206.7 ± 0.3 | 0.021 | 69.238 | 5 | 5 | 143 | 99.8 |
| 4–3 | f–f | 1442217.3 ± 0.3b | 0.039 | 69.256 | 7 | 9 | 735 | 285 |
| 1–0 | f–f | 1442218.8 ± 0.6 | 0.000 | 69.218 | 1 | 3 | 123 | 143 |
| 1–1 | e–e | 1442342.4 ± 0.3 | 0.010 | 69.233 | 3 | 3 | 110 | 128 |
| 3–2 | f–f | 1442366.9 ± 0.4 | 0.021 | 69.246 | 5 | 7 | 457 | 228 |
| 2–1 | f–f | 1442450.8 ± 0.3 | 0.010 | 69.238 | 3 | 5 | 257 | 180 |
| 1–0 | f–f | 1442465.9 ± 0.6 | 0.004 | 69.233 | 1 | 3 | 122 | 143 |
Notes. Parameters have been calculated from the spectroscopic constants in Table 3 of Gupta et al. (2012). a Dipole moment, μ0 = 1.75 D, from Chen et al. (2007). b Frequency used as reference for building the velocity scales in Figures 1, 3, and 4.
Download table as: ASCIITypeset image
3.2. Velocity Structure in the W31C and W49N Lines of Sight
The sight lines toward the high-mass star-forming regions and strong continuum sources W31C and W49N have been the subject of several studies, which describe and compare the velocity distribution of the intervening gas traced by various molecules (e.g., Godard et al. 2010; Persson et al. 2010, and references therein). The mean of the line width distribution, found through Gaussian decomposition of the absorption profiles, is between 1.5 and 4.5 km s−1, depending on the species (Godard et al. 2012). The gas associated directly with W31C is detected in the velocity range VLSR ≃ −15 to 5 km s−1, while the foreground gas is detected at VLSR ≃ 5 to 55 km s−1. In the case of W49N, the velocity ranges pertaining to background and foreground gas are VLSR ≃ −10 to 23 km s−1 and VLSR ≃ 23 to 75 km s−1, respectively.
In modeling the HCl+ absorption, it is desirable to have molecular absorption lines that are detected with good signal to noise and are optically thin over the entire velocity range. While CH and 13CH+ fulfill both criteria (Gerin et al. 2010b; Falgarone et al. 2010a), they trace with different weighting the various environments aligned along the lines of sight, so they present significant discrepancies in the relative depth of the absorption peaks, especially in correspondence with the velocity ranges pertaining to the star-forming regions and their surroundings.
Because HCl and H2Cl+ (R. Monje et al. 2012, in preparation; Neufeld et al. 2012b) are chemically related to HCl+, their absorption might be expected to show similarities to that of HCl+. Although H35Cl is observed in the foreground of W31C, a reliable opacity profile could not be extracted for the entire velocity range because of the low signal to noise of the absorption and the occurrence of emission at the velocities associated with the background source. The analysis of H35Cl in W49N is even more complicated because of the presence of strong self-absorption, and a possible outflow signature, as well as the absence of absorption in the foreground clouds. In contrast, higher signal to noise has been achieved in the H2Cl+ spectra toward both W31C and W49N, and deconvolved opacity profiles have been produced.10 The column density estimates for these species are 7.2 × 1013 cm−2 for H35Cl in W31C (in the 14–42 km s−1 velocity range), 8.4 × 1013 cm−2 for H352Cl+ in W31C, and 6 × 1013 cm−2 for H352Cl+ in W49N.
Chemical models predict HCl+ to be present in clouds of low extinction (AV < 1; Neufeld & Wolfire 2009), suggesting that HCl+ may reside in the same gas as OH+ (whose absorption profiles are saturated) and H2O+.
3.3. Modeling
In the case of HCl+, the fine and hyperfine structure of the 2Π3/2J = 5/2–3/2 transition is entangled with the absorption pattern of the sources, producing the intricate profiles observed. Although this makes comparison with models necessary, a satisfactory match of the models with the complex patterns observed makes the identification extremely reliable.
The observed absorption profiles are modeled by convolving each velocity channel of the opacity profiles τ(v) of a known molecular tracer (hereafter template) of the gas, with the pattern of transitions reported in Table 1. The contributions to the opacity of all the channels are then summed, and a scaling factor—the sole free parameter—is applied to match the observed opacity by minimizing the quantity ∫|residuals|dv/∫τdv. The minimization excludes frequency ranges in which the difference between the horizontal and vertical polarization or between the two pipelines for data reduction is larger than five times the rms noise.
Given the complex line structure and the possible occurrence of instrumental artifacts, the described approach has been preferred over the more common methods of multi-Gaussian decomposition, because it uses far fewer free parameters, and thus avoids the risk of building ad hoc models. It is based on the conservative but simplistic assumption that the same HCl+/template opacity ratio holds for all the line-of-sight clouds. Despite this, Figure 3 shows that the observed absorption is reproduced well, suggesting a posteriori that the assumption is reasonable, at least for some of the templates.
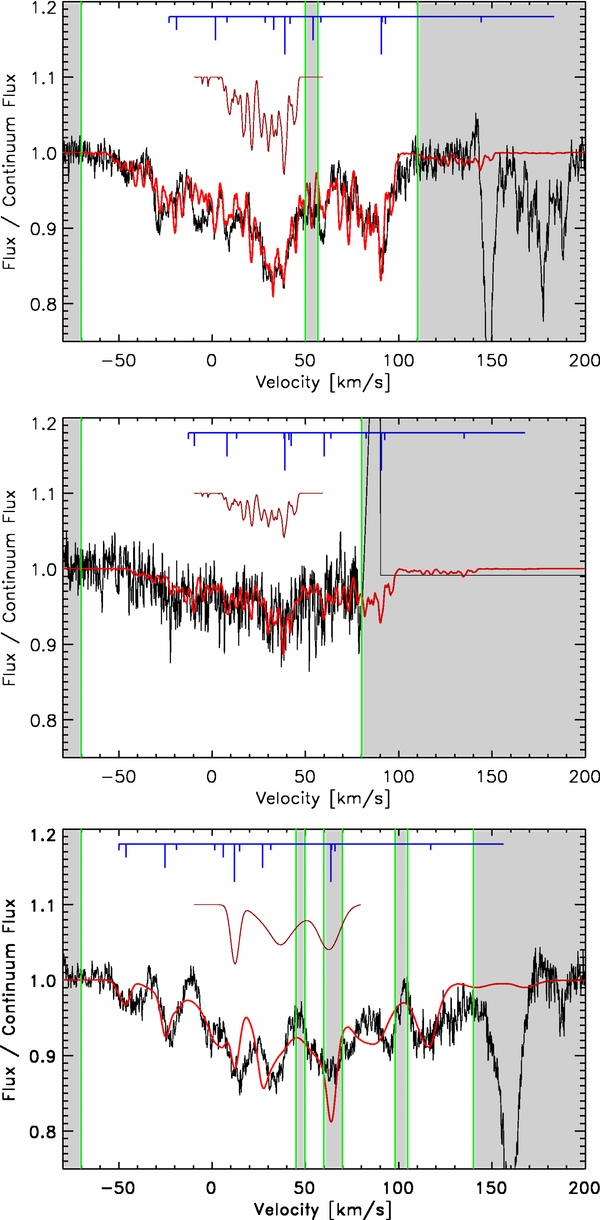
Figure 3. Best-fit models of (top) H35Cl+ in W31C, (middle) H37Cl+ in W31C, and (bottom) H35Cl+ in W49N. The para-H2Cl+ 111–000 line of the corresponding source has been used as template. Throughout, data are in black and models in red; dark red spectra (vertically shifted by +0.1) show the template profiles, and blue lines depict the line structure (see Table 1) shifted to the template's strongest absorption component velocity. Shadowed ranges are excluded from the fit.
Download figure:
Standard image High-resolution imageFigure 4 also serves to prove the validity of our approach to modeling and identifying the broad and complex absorption observed. The model profiles built using different templates have been rigidly shifted—thus conserving the internal line structure—relative to the predicted frequency, within ±300 MHz. Figure 4 shows the dependences of ∫|residuals|dv/∫τdv on the frequency shift. The well-defined minima close to zero shift indicate that the observationally constrained rest frequencies, having an accuracy of about 30 MHz, because of the intrinsic discrepancies among the template opacity profiles, the noise in the data, and the model assumptions, are in perfect agreement with the predicted values. Moreover, given the sub-MHz accuracy of the calculated frequencies, the quality of the match to the data of the different models provides valuable information about the chemistry of the traced environments.

Figure 4. Normalized residuals (∫|residuals|dv/∫τdv) as a function of the shift in frequency of the line pattern with respect to the predicted values for the two sources. Each curve corresponds to a different template species. The dashed curve refers to the fit of H37Cl+.
Download figure:
Standard image High-resolution image
3.4. Assignment of HCl+
The assignment of the observed absorption features to the 2Π3/2J = 5/2–3/2 transition of H35Cl+ is strongly supported by a number of reasons.
- 1.The astronomically inferred rest frequencies, for both H35Cl+ and H37Cl+, are in excellent agreement with predictions based on recent laboratory measurements (Gupta et al. 2012).
- 2.The best match is found, for both H35Cl+ and H37Cl+ in W31C, when the closely related molecule H352Cl+ is used as a template.
- 3.The identification of the absorption features near 1444.2 GHz with H37Cl+, at the predicted frequency and with the expected isotopic abundance (see Section 3.5), further supports the assignment of the carrier to HCl+.
- 4.Models employing just one free parameter are able to reproduce well the absorption in both sources.
- 5.Observation of the same pattern with both sidebands rules out the possibility that it is due to instrumental artifacts alone.
3.5. Column Densities
The column densities were derived using the following formula, valid for ground-state transitions:

where ν0, gu, and Aul are the rest frequency, the upper level degeneracy, and the spontaneous emission rate of the observed transition; Q(Tex) is the partition function; c is the speed of light; and ∫τdv is performed over the whole absorption pattern, thus including the contribution of all the fine- and hyperfine-structure components. Assuming a single excitation temperature Tex = 5 K for all levels and taking into account the relative intensity in Table 1 of the F = 4–3(f–f) component, Equation (1) becomes  , and we find N(H35Cl+) = 8.2 ± 2.5 × 1013 cm−2 for W31C, and N(H35Cl+) = 8.7 ± 2.6 × 1013 cm−2 for W49N. The 1σ uncertainty of 30% in the column density is dominated by the error in the baseline fitting,11 while other sources of uncertainty—continuum level fluctuations among the different tunings, residual standing waves, uncertainty in the dipole moment, deviations from unity of the sideband ratio, and velocity range of the integration—contribute under 10%.
Similarly, for H37Cl+ in W31C we obtain12  , implying an isotopic ratio of 2.1 ± 1.5, comparable to the solar abundance value 3.1.
For W31C, a comparison with H352Cl+ (Neufeld et al. 2012b) and H35Cl (R. Monje et al. 2012, in preparation) column densities gives a column density ratio of unity for both species (HCl+ : H2Cl+ : HCl ∼ 1).
In chemical models of diffuse clouds, HCl+—like OH+ (Neufeld et al. 2010a)—is predicted to be most abundant in clouds of small extinction where the molecular hydrogen fraction is ∼1% (Neufeld & Wolfire 2009). Along the sight lines to W31C and W49N, Godard et al. (2010) estimated the H i column densities within such clouds, for the velocity ranges not associated with the background sources, as 1.2 × 1022 cm−2 and 1.4 × 1022 cm−2, respectively. Thus, the HCl+ column densities derived here for the same velocity ranges imply abundances of 9 × 10⁻⁹ relative to atomic hydrogen for the W31C sight line, and 6 × 10⁻⁹ for the W49N sight line,13 corresponding, respectively, to 5% and 3% of the gas-phase chlorine abundance. These values are several times larger than the maximum fractions (∼1%) predicted by theoretical models (e.g., Neufeld & Wolfire 2009), in which HCl+ is produced primarily by the reaction of Cl+ with H2. A similar discrepancy is observed for the case of H2Cl+ (Lis et al. 2010; Neufeld et al. 2012b), whose abundance is also underestimated by theoretical models. Thus, the larger-than-expected abundance we derived here does not in itself argue against our identification of HCl+; rather, it may suggest some deficiency in existing models for the production of chlorine-bearing molecules in the diffuse ISM.
We are indebted to I. Avruch, R. Higgins, and the OBerlin group for helpful discussions on spectroscopy and support on data reduction. HIFI has been designed and built by a consortium of institutes and university departments from across Europe, Canada, and the United States (NASA) under the leadership of SRON, Netherlands Institute for Space Research, Groningen, The Netherlands, and with major contributions from Germany, France and the US. Consortium members are Canada: CSA, U. Waterloo; France: CESR, LAB, LERMA, IRAM; Germany: KOSMA, MPIfR, MPS; Ireland: NUI Maynooth; Italy: ASI, IFSI-INAF, Osservatorio Astrofisico di Arcetri-INAF; Netherlands: SRON, TUD; Poland: CAMK, CBK; Spain: Observatorio Astronomico Nacional (IGN), Centro de Astrobiologia; Sweden: Chalmers University of Technology—MC2, RSS & GARD, Onsala Space Observatory, Swedish National Space Board, Stockholm University—Stockholm Observatory; Switzerland: ETH Zurich, FHNW; USA: CalTech, JPL, NHSC. Support for this work was provided by the Centre National de Recherche Spatiale (CNES), by the SCHISM project (grant ANR-09-BLAN-0231-01), by NASA through an award issued by JPL/Caltech, and by the Spanish MICINN (grants AYA2009-07304 and CSD2009-00038).
Footnotes
- 8
We define a "ground-state transition" as one for which the lower state is the ground rovibronic molecular state.
- 9
Observation ID: 1342206600-1-2-3-4-5, 1342218237-8, 1342219228-9.
- 10
In the case of W49N, the absorbing opacity may be underestimated at the LSR velocity of 17 km s−1, because of the possible occurrence of an interfering emission line.
- 11
Only linear baselines have been removed to minimize unjustified extrapolations of standing waves into the frequency range of interest.
- 12
The observations do not cover the whole absorption pattern of the H37Cl+ transition; therefore, the integrated opacity is derived from the model.
- 13
Assuming 35Cl/37Cl = 3.1.