


ABSTRACT
Supernova remnants (SNRs) have long been assumed to be the source of cosmic rays (CRs) up to the "knee" of the CR spectrum at 1015 eV, accelerating particles to relativistic energies in their blast waves by the process of diffusive shock acceleration (DSA). Since CR nuclei do not radiate efficiently, their presence must be inferred indirectly. Previous theoretical calculations and X-ray observations show that CR acceleration significantly modifies the structure of the SNR and greatly amplifies the interstellar magnetic field. We present new, deep X-ray observations of the remnant of Tycho's supernova (SN 1572, henceforth Tycho), which reveal a previously unknown, strikingly ordered pattern of non-thermal high-emissivity stripes in the projected interior of the remnant, with spacing that corresponds to the gyroradii of 1014–1015 eV protons. Spectroscopy of the stripes shows the plasma to be highly turbulent on the (smaller) scale of the Larmor radii of TeV energy electrons. Models of the shock amplification of magnetic fields produce structure on the scale of the gyroradius of the highest energy CRs present, but they do not predict the highly ordered pattern we observe. We interpret the stripes as evidence for acceleration of particles to near the knee of the CR spectrum in regions of enhanced magnetic turbulence, while the observed highly ordered pattern of these features provides a new challenge to models of DSA.
Export citation and abstract BibTeX RIS
1. INTRODUCTION
Energetic arguments have long favored the hypothesis that supernova (SN) shocks are responsible for the bulk of the cosmic ray (CR) flux at Earth from 108 eV to the "knee," a flattening of the CR spectrum at approximately 1015 eV (Blandford & Eichler 1987). This requires that ∼10% of the mechanical energy of Galactic supernova remnants (SNRs) be converted into relativistic particles over the remnants' lifetime. In the favored model of this process, diffusive shock acceleration (DSA), self-generated magnetic turbulence provides scattering centers from which suprathermal particles may diffuse between the up- and downstream fluid, gaining energy (on average) with each shock crossing (Bell 1978). The ubiquitous non-thermal radio emission in SNRs is evidence of GeV electrons in SNRs, and the X-ray synchrotron emission observed from the limbs of young SNRs (Koyama et al. 1995; Hughes et al. 2000a; Gotthelf et al. 2001; Hwang et al. 2002) indicates the presence of electrons to tens of TeVs. Though CR nuclei comprise the vast majority of mass in SNR relativistic particles, they do not radiate efficiently, and their presence must be inferred indirectly, either by the modification of the shock dynamics (Warren et al. 2005) and thermal state of the plasma (Hughes et al. 2000b; Decourchelle et al. 2000; Patnaude et al. 2009) or by the production of secondary pions (Butt et al. 2001; Aharonian et al. 2006).
Bell & Lucek (2001) predicted significant amplification of the magnetic field in SN shocks by CR-induced turbulent processes, allowing for acceleration to the knee within an SNR lifetime. This picture is supported by high spatial resolution observations from the Chandra X-ray Observatory that require high magnetic fields to explain the short synchrotron cooling time implied by the geometrically thin rims of young remnants (Vink & Laming 2003; Ballet 2006). An extensive theoretical literature has developed detailing a range of plasma instabilities that might generate these high fields. Of these, the CR current-driven (CRCD) instability (often referred to as Bell's non-resonant mechanism; Bell 2004), in which the magnetic field is amplified by turbulence generated by CRs propagating ahead of the shock, has received the most study, though other processes (e.g., acoustic instabilities, resonant instabilities, etc.) have been suggested. MHD (Bell 2005) and particle-in-cell (PIC) simulations (Riquelme & Spitkovsky 2009) show that the CRCD instability drives plasma motions which suppress growth on small scales, until the dominant scale of the turbulence is comparable to the Larmor radius of the highest energy CRs. This results in a non-uniform medium with structured, filamentary density and field enhancements ∼10 times greater than the mean quantities, surrounding cavities of size approximately equal to the Larmor radius of the highest energy particles present. Indeed, Bell's analysis and simulations show that once the instability has saturated, the medium consists of a network of holes evacuated of plasma and field, enclosed by "wandering filaments" of high density and frozen-in field. One goal of observations is to discover evidence for structure in SNR shocks on this spatial scale.
2. OBSERVATIONS
We observed Tycho in 2009 April with the Chandra X-ray Observatory Advanced CCD Imaging Spectrometer imaging array, as part of a Cycle 10 Large Program (LP), using the four ACIS-I front-side illuminated CCDs, operated in faint mode. The total program was split into nine individual ObsIDs, which we reprocessed with CIAO version 4.1, using the gain tables and charge transfer inefficiency correction in CALDB 4.1.3. Examination of the light curves revealed no significant background flares. The registration of the individual pointings was improved using the measured relative positions of background point sources, though the necessary shifts were typically ≪1''. For imaging analyses, the registered event lists were merged using the standard CIAO tools and have a total average livetime of ∼734.1 ks. For spectroscopy, counts were extracted and RMFs and ARFs were generated for each individual ObsID, which we fit jointly in XSPEC version 12.6.0.
In Figure 1 we show the image from the 4 to 6 keV band, which is dominated by the synchrotron component of the X-ray spectrum. Apart from the well-known limb-brightened shell, a number of bright regions are seen toward the projected interior of the remnant. While the strongest of these features are visible in earlier Chandra data (Warren et al. 2005) our deeper observation reveals a striking pattern of nearly regularly spaced stripes. The brightest group, centered ∼30'' interior to the western limb (see Figure 2), has a peak surface brightness twice that of the brightest sections of the rims and is the primary subject of this communication. A second, fainter pattern extends east–west, 55''–75'' inside the southern rim, and there is evidence for several other regions of striping near the detection limit. Comparison with a shallower 2004 Chandra observation reveals no statistically significant change in the brightness of the stripes, ruling out any dramatic flux variability like that observed in the non-thermal X-ray filaments of the SNR RX J1713.7−3946 (Uchiyama et al. 2007). Our preliminary proper motion measurements for the stripes are consistent with the overall expansion of the blast wave and, in particular, show no evidence for non-radial flow. There are no obvious counterparts to these features in the radio (Reynoso et al. 1997) nor in the mid-IR.
Figure 1. Chandra X-ray 4.0–6.0 keV image of the Tycho supernova remnant, smoothed with a ∼0 75 Gaussian and displayed with an arcsinh scaling, showing various regions of striping in the nonthermal emission. Clockwise from the upper right: (a) the main western stripes discussed in this Letter; (b) a fainter ensemble of stripes; (c) a previously known bright arc of nonthermal emission, with our newly discovered streamers; and (d) filaments of "rippled sheet" morphology common in optical observations of middle-aged SNRs.
Download figure:
Standard image High-resolution image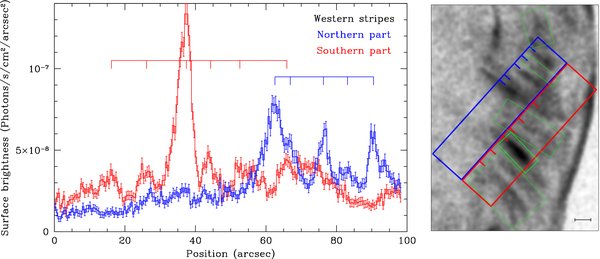
Figure 2. Left: the projected intensity profile for two regions containing the western stripes. The bright stripe is the red peak around a position of 35''. The locations of prominent stripes are indicated by the horizontal lines with tick marks. The peaks in the northern profile are spaced by 99, 113, 69, 83, and 133; those in the southern profile are spaced by 44, 94, 68, and 74. Right: gray-scale image of the Chandra data in a line-free region of the spectrum (4.2–6.0 keV) showing the extraction regions for the profiles plotted in the left panel. The profiles run from the lower left to the upper right and the tick marks on the boxes correspond to the same tick marks as in the left panel. The scale bar in the lower right is 10'' long. The green boxes denote the spectral regions analyzed in the Letter. The brightest region is the bright stripe; the co-addition of the fainter regions constitutes the faint stripes.
Download figure:
Standard image High-resolution image3. ANALYSIS
3.1. Location of the Stripes
Before investigating the nature of the stripes, we first must locate them within the three-dimensional volume of the remnant. The canonical picture of a young SNR consists of three distinct fluid discontinuities: the blast wave, which marks the shock propagating into the ambient medium, a Rayleigh–Taylor (R–T) unstable contact discontinuity (CD) at the ejecta-interstellar material boundary, and a reverse shock that propagates into the stellar remains. Warren et al. (2005) set an upper limit for the azimuthally dependent projected radius of the reverse shock in Tycho using the location of the Fe Kα emission. Adopting their center of expansion, the western stripes peak at a radius of 220'', well outside the 190'' position of the reverse shock at that azimuth. While the position of the stripes does coincide with the Warren et al. estimate of the CD, the regularly spaced, linear morphology of the non-thermal stripes does not correspond to any features in the R–T plumes of thermal emission tracing the ejecta boundary, nor is the CD a prominent feature elsewhere in the 4–6 keV band. Conversely, the blast wave is a bright source of 4–6 keV emission, and we identify the stripes as projected features of this forward shock.
Tycho's blast wave is traced by a very thin shell of X-ray emission, with a typical thickness only 1%–2% of its radius (Warren et al. 2005). Since the stripes are seen in projection away from the rim, their line-of-sight path length through the shell is small. Thus, their intrinsic emissivity must be high relative to the limb regions. We examined two regions of different brightness on the western rim with minimal ejecta contamination, and assumed a spherical shell model with a radius of 214'', chosen to match the curvature of the western limb. The radial brightness profile of the brighter rim region is too narrow and peaked to be consistent with a simple projected shell geometry, meaning that its high surface brightness likely arises from a local enhancement in emissivity, perhaps similar to the stripes. In contrast, the profile of the fainter region is well fit by a shell with thickness 2% of its radius and is likely more typical of the blast wave as a whole. This simple model predicts that features at 80% of the shock radius (where the stripes are located) would have a surface brightness 20% that of the limb. The observed peak surface brightness of the stripes is, however, five times that of the faint limb region. Thus, the peak intrinsic emissivity of the synchrotron-emitting plasma in the stripes must be a factor of 25 higher than is typical for the blast wave. In principle, this brightening could be due to a local enhancement in the ambient density and/or magnetic field. While we cannot entirely exclude this possibility, we consider the existence of a pre-existing structure around Tycho with the right combination of increased density, magnetic field, and, as we show below, turbulence necessary to produce the observed correlations between the ordered structure and spectral variations improbable. In contrast, models of CR-driven magnetic field amplification produce structure in the precursor density and field, and we find it more likely that the stripes mark a region extensively modified by the acceleration process. This assumption is implicit in the analysis in this Letter.
3.2. Spectroscopy
The spatial position of the stripes, seen in projection against the bright thermal X-rays of the shocked ejecta, greatly complicates spectroscopy. This can be mitigated by restricting analysis to the 4.2–10 keV range, where the emission is dominated by the synchrotron continuum and the Fe Kα line complex at ∼6.45 keV. Throughout this work we set the absorbing column to NH = 7 × 1021 cm-2, which has negligible effect at these energies. The spectrum of the brightest stripe is well fit with a power law of photon index of Γ = 2.11+0.08−0.10, significantly harder than the spectrum of the entire SNR at these energies (Γ = 2.72 ± 0.02; this fit includes faint lines identified by Tamagawa et al. 2009), and a co-addition of several of the lower surface brightness stripes (Γ = 2.52 ± 0.05; this fit includes an Fe K line).
While photon indices are useful for characterization of the non-thermal spectrum, the broadband spectrum gradually departs from a simple power law over several decades in energy. Detailed DSA models of synchrotron spectra show a small degree of curvature through the radio to UV, with a cutoff in the X-rays, set (in young SNRs like Tycho) by the short cooling time of TeV-scale electrons (Ellison et al. 2000). Absent detailed spectral calculations for Tycho, we adopt a common approximation and assume a power-law electron momentum distribution with an exponential cutoff, which produces a photon spectrum that is nearly a power law from the radio through the UV and is curved in X-rays (Reynolds & Keohane 1999). For this model, the low energy index (αradio) and the flux normalization are set by radio observations, while the location of the high energy cutoff is constrained with the X-ray spectrum. For the spectrum of the entire remnant, assuming a radio spectral index of αradio = 0.65, a flux density at 1 GHz of ∼50 Jy (Kothes et al. 2006), and again including the faint X-ray emission lines from Tamagawa et al. (2009), the fit to the Chandra data gives νcut = 1.9 × 10¹⁷ Hz(hνcut ∼ 0.79 keV). This provides a remarkably good fit (χ2ν = 1.05), and is consistent with measurements from Suzaku. (The statistical error on this number is so small as to be irrelevant; the precision to which we measure it is far greater than the efficacy of our emission model or the accuracy of the radio flux and spectral index measurements.) If we instead assume αradio = 0.61 (Klein et al. 1979), the fit is slightly worse (χ2ν = 1.10), and the cutoff moves to lower energies (νcut = 0.9 × 10¹⁷ Hz ; hνcut ∼ 0.37 keV). For the stripes, we estimated the radio flux in these regions from a Very Large Array (VLA) map. The fits favor slightly shallower indices (αradio ∼ 0.60) and higher cutoff energies, νcut = 19+13−9 × 10¹⁷ Hz(7.9+5.4−3.7 keV) for the bright stripe and νcut = (2.8 ± 0.2) × 1017 Hz(1.16 ± 0.04 keV) for the ensemble of fainter stripes. We plot the broadband synchrotron spectra of these regions in Figure 3.
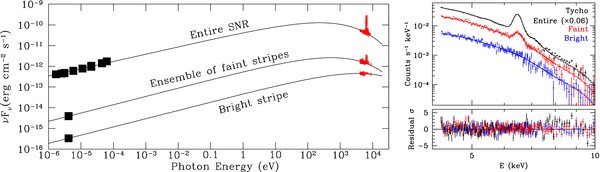
Figure 3. Left: broadband spectra of Tycho from the radio to the X-ray for the entire SNR (top), an ensemble of faint stripes (middle), and the bright stripe (bottom). The radio points for the latter two came from our own estimates based on the VLA radio data, taking account of the remnant's expansion. The integrated radio flux density values for the entire SNR are taken from Klein et al. (1979). The Chandra data are plotted in red and for the top two spectra the Fe K line is visible. The overplotted curves are the best-fit phenomenological model for the continuum emission of a power law (extrapolated from the radio band) with an exponential cutoff in the X-ray regime. Right: Chandra spectra of the three spatial regions analyzed. The top part shows the observed spectral intensity vs. photon energy (data points with error bars) along with the best-fit model. The bottom part shows the residuals (data − model) in units of the flux error. The data points and model curves here include instrumental effects, which have been removed for the X-ray data points plotted on the left panel.
Download figure:
Standard image High-resolution image
Although it is clear that the bright stripe and faint ensemble spectra require different best-fit parameter values, in principle these differences might be due to either different cutoff frequencies or radio spectral indices. Our spectral analysis (detailed in Table 1) allows us to discriminate between these two options. When the spectra for the bright and faint regions are fit with radio flux densities fixed at their nominal values, both regions prefer an index very close to the average for the entire remnant. Conversely, if we instead require that both regions have the same cutoff, the fitted radio indices are α = 0.565 (bright) and α = 0.623 (faint). We cannot reject this level of variation outright since measurements of the spatial variation of the radio spectral index are not available for Tycho, though in Cas A (a plausible comparison object) the radio index does vary spatially by much as ±0.1 (Wright et al. 1999). On the other hand, the best fit for a single cutoff frequency is clearly worse (Δχ2 = 13.8) than for independent cutoff values. An F-test shows that the fit including independent cutoff frequencies is an improvement at a significance level of more than 3σ. Thus, we conclude that the cutoff frequencies are significantly different in the bright and faint spectral regions analyzed.
Table 1. Stripe Spectroscopic Fits
| Region | α | Fν (1 GHz) | νcut | χ2/dof |
|---|---|---|---|---|
| (Jy) | (Hz) | |||
| Bright stripe | 0.61a | 3.33 × 10⁻²a | 2.60 ± 0.09 × 10¹⁸ | 194.89/205 |
| Bright stripe | 0.603+0.010−0.025 | 3.33 × 10⁻²a | 1.88+1.25−0.89 × 10¹⁸ | 194.30/204 |
| Bright stripe | 0.637+0.014−0.012 | 6.66 × 10⁻²a | 1.93+2.09−0.74 × 10¹⁸ | 194.26/204 |
| Bright stripe | 0.65a | 8.0+2.3−1.5 × 10⁻² | 2.37+1.64−1.00 × 10¹⁸ | 194.27/204 |
| Bright stripe | 0.61a | 4.2+0.8−1.1 × 10⁻² | 1.56+1.53−0.44 × 10¹⁸ | 194.27/204 |
| Faint ensemble | 0.61a | 0.39a | 3.52 ± 0.03 × 10¹⁷ | 667.29/687 |
| Faint ensemble | 0.601+0.009−0.004 | 0.39a | 2.84 ± 0.10 × 10¹⁷ | 666.31/686 |
| Faint ensemble | 0.635+0.011−0.004 | 0.78a | 2.88 ± 0.11 × 10¹⁷ | 666.55/686 |
| Faint ensemble | 0.65a | 0.899+0.032−0.026 | 3.53 ± 0.23 × 10¹⁷ | 666.37/686 |
| Faint ensemble | 0.61a | 0.394 ± 0.012 | 3.47+0.22−0.36 × 10¹⁷ | 667.25/686 |
Download table as: ASCIITypeset image
4. INTERPRETATION
4.1. The Diffusion Coefficient
DSA requires magnetic field inhomogeneities strong enough that particles can scatter multiple times across the shock front. This diffusion of CRs in the magnetized turbulence is generally assumed to be close to the Bohm regime, where the mean free path is the particle gyroradius. Departure from this limit can be parameterized as k0 = D0/D0,Bohm, where D0 is the diffusion coefficient at the electron cutoff energy. Parizot et al. (2006) show that for an electron distribution limited by synchrotron losses, the photon cutoff energy (Eγ, cut = hνcut) is set by the diffusion coefficient, shock velocity (V3, in units of 1000 km s−1), and compression ratio, r:
At a distance of 4.0 ± 1.0 kpc (Hayato et al. 2010), with a blast wave proper motion of 03 yr-1 (Katsuda et al. 2010), vs = 5700 km s-1. For an unmodified shock (r = 4) and our fit cutoff energies, k0= 5.8 (whole SNR), 3.9 ± 0.1 (faint stripes), and 0.6+0.4−0.3 (bright stripe). With a higher compression more applicable to Tycho (r = 7), these numbers become 3.8, 2.6 ± 0.1, and 0.4+0.3−0.2. (The error bars reflect only the statistical error in νcut, and not the ∼25% uncertainty in the distance to Tycho.) Our value for the whole SNR is near to those found by Parizot et al. (2006) for Tycho (k0 = 4.9–10), while the very small numbers for the brightest stripe are similar to their results for G347.3-0.5 and SN 1006 (k0 = 0.2–0.9). Since k0>1 for isotropic turbulence, this may be due to our oversimplified emission model, and could indicate that the photon spectrum falls more gradually to high energies, as seen in some DSA calculations (Ellison et al. 2010), or may be indicative of anisotropic diffusion (Reville et al. 2008). Regardless, our measured photon cutoff energies require an order of magnitude decrease in the diffusion coefficient in the stripes relative to the average value in Tycho, and indicate that diffusion in the stripes is very near the Bohm limit. Furthermore, since Bohm diffusion requires δB/B ∼ 1, k0 ∼ 1 implies fully developed turbulence, at least on the scale of the gyroradius of the highest energy (∼TeV) electrons in the brightest stripes.
4.2. The Origin of the Stripes
Might the spatial structure and enhanced turbulence in the stripes be a manifestation of the plasma instability driving the CR acceleration? The largest possible characteristic scale of the acceleration process is set by the gyroradius of the highest energy particles present. If we identify the gaps between the stripes (lgap ∼ 8'') with twice the proton gyroradius, an estimate of the magnetic field yields a measurement of the energy, given by Equation (2):
The choice of B is somewhat uncertain. If the stripes are a consequence of the highest energy CRs interacting with the non-amplified ISM field (B ∼ 3 μG), for a gap spacing of 8'', ECR = 2 × 10¹⁴ eV. However, these features may arise from a region where the field has already been somewhat amplified. For a shock velocity of 5700 km s-1, fits to models of Tycho's synchrotron emission (Cassam-Chenaï et al. 2007) predict an upstream field strength of B ∼ 30 μG, indicating ECR = 2 × 10¹⁵ eV—just at the knee of the Galactic CR spectrum.
5. CONCLUSION
If the Bell mechanism is active in the magnetic field amplification in SNR shocks, and if the pattern of stripes we observe in Tycho is an observable consequence of this process, the stripes are direct evidence of particles accelerated to the knee. There are several caveats to consider before accepting this conclusion. Most obviously, while MHD and PIC simulations of the CRCD generate structure in the amplified medium, they do not show the regular and nearly periodic pattern that we observe in Tycho. Secondly, when the CR back-reaction is included (Riquelme & Spitkovsky 2009), PIC simulations indicate that the Bell instability alone may be neither fast nor efficient enough to provide the observed amplification, particularly for Tycho's low ambient density. Additional instabilities are required, and seem to be indicated by the degree of turbulence in the stripes implied by our observations. Riquelme & Spitkovsky (2010) propose a new instability (the parallel current driven instability, PCDI) that acts on smaller scales (i.e., lower energies) and provides significant field amplification over that established by the CRCD. Further theoretical work on the degree of turbulence generated by proposed mechanisms on TeV particle scales seems particularly warranted. Regardless, the match in scales between the observed spacing of the Tycho stripes and the Larmor radius of knee region CRs—a scale intrinsic to the CRCD—is tantalizing, while the ordered structure presents a challenge to current models of DSA.
This work was partially supported by Chandra award (grant number GO9-0078X) to Rutgers University. E.M.R. is a member of the CIC (CONICET) and is funded by the CONICET, UBA, and ANPCyT projects. J.P.H. acknowledges helpful discussions with Mario Riquelme, Anatoly Spitkovsky, Tom Jones, Roger Blandford, and Martin Laming. We also thank Christopher McKee for contributing to the original Chandra proposal.
Facilities: CXO - Chandra X-ray Observatory satellite