

Abstract
Endochondral ossification (EO) is an essential biological process than underpins how human bones develop, grow, and heal in the event of a fracture. So much is unknown about this process, thus clinical manifestations of dysregulated EO cannot be adequately treated. This can be partially attributed to the absence of predictive in vitro models of musculoskeletal tissue development and healing, which are integral to the development and preclinical evaluation of novel therapeutics. Microphysiological systems, or organ-on-chip devices, are advanced in vitro models designed for improved biological relevance compared to traditional in vitro culture models. Here we develop a microphysiological model of vascular invasion into developing/regenerating bone, thereby mimicking the process of EO. This is achieved by integrating endothelial cells and organoids mimicking different stages of endochondral bone development within a microfluidic chip. This microphysiological model is able to recreate key events in EO, such as the changing angiogenic profile of a maturing cartilage analogue, and vascular induced expression of the pluripotent transcription factors SOX2 and OCT4 in the cartilage analogue. This system represents an advanced in vitro platform to further EO research, and may also serve as a modular unit to monitor drug responses on such processes as part of a multi-organ system.
Export citation and abstract BibTeX RIS

Original content from this work may be used under the terms of the Creative Commons Attribution 4.0 license. Any further distribution of this work must maintain attribution to the author(s) and the title of the work, journal citation and DOI.
1. Introduction
Endochondral ossification (EO) is a process critical to the development, post-natal growth and healing of the long bones of the human skeleton. During EO a cartilage template matures to hypertrophy, initiating a pro-angiogenic program resulting in vascular invasion that is integral to the transformation of cartilage into bone [1, 2]. The specifics of how bone develops in this way, and specifically how vasculature initiates the cartilage to bone transformation is still not fully understood. A deeper understanding of EO will bring about not just an improved basic understanding of this key aspect of bone biology, but could also lead to improvements in the treatment of a number of skeletal diseases, such as fracture non-unions [3], chondrodysplasias [4], and osteochondrosis [5]. Furthermore, such developments may improve our understanding of conditions involving aberrant cartilage to bone transformation, such as osteoarthritis [6], as well as enabling the development of novel tissue engineering strategies for the treatment of large bone defects [7]. At present, autografting is the current gold standard approach for large bone defect repair, but has inherent drawbacks such as donor site morbidity and limited supply [8]. As EO is central to long bone development and secondary fracture healing, recapitulating this process is forming the basis to emerging alternative tissue engineering strategies to repair large bone defects [9, 10]. Such approaches involve the implantation of a pre-cultured cartilaginous or hypertrophic tissue to stimulate the healing process and drive regeneration [11], and has shown significant promise in preclinical studies [10, 12].
Rodent models are currently the primary method for studying EO in both developmental [13] and regenerative contexts such as fracture healing [1]. These animal models are essential for research, as no in vitro system can replicate the complexity of an entire organism. However, rodents do not present haversian remodelling or closure of the epiphyseal growth plate as occurs in humans [14, 15], and therefore the underlying mechanisms of EO may differ between the species. Alternatively, in vitro models are less expensive, potentially of human origin, and can produce more specific, higher resolution information than animal models. A number of in vitro systems exist to model EO; for example, the murine-derived ATDC-5 cell line can undergo cellular condensation, proteoglycan synthesis, collagen type II secretion [16], and hypertrophic mineralisation [17, 18], and have been used as model cells for EO research. Additionally, ex vivo mesenchymal micromass cultures from the developing limb bud [19], isolated chondrocytes [20] and growth cartilage explants [21] can be used for EO research. The drawback of these models is that they are typically not of human origin, which in itself can result in poor predictive ability [22]. Additionally, these systems lie on either end of a spectrum of in vitro biological complexity; exhibiting a substantial trade off in experimental control and physiological relevance.
Next generation in vitro models of EO should exist in the centre of this spectrum, incorporating more physiological relevance to facilitate the advanced study of key developmental and regenerative processes. 3D bioprinting technologies, for example, can be used to generate such model tissues and have been employed to fabricate vascularised osseous tissues in vitro [23, 24]. Additionally, 3D bioprinting has been used to engineer constructs capable of executing a developmental paradigm to promote endochondral bone formation in vivo [25]. Alternatively, microphysiological systems (MPSs) are a candidate platform on which these next generation models can be built. A key feature of MPS technology relevant to modelling EO is the ability to generate three-dimensional tissues with physiologically relevant perfusable vasculature [26], which, if incorporated into an in vitro model of EO, could facilitate probing the essential role of vasculature in directing the transition of a cartilage template into bone, a crucial phase of EO. MPS technology has been used extensively to study vasculature [27], and its role in specific disease processes such as metastasis [28]. However, MPS applications in musculoskeletal research, particularly in cartilage and bone, are only beginning to emerge [29, 30]. Thus, MPS technology is particularly suitable for building models of cartilage biology that are more physiologically relevant.
The aim of this paper is to develop and validate a MPS model of EO. More specifically, the aim is to develop a MPS to model the vascular invasion of cartilage during EO in developing (or regenerating) bone. Thus, to further understand this developing bone–vasculature crosstalk, microscale developing bone organoids (µDBO) that represent different stages along the endochondral pathway were vascularised in an MPS device, and their response to vascularisation at the gene and tissue level was characterised. This MPS is able to predict the changing angiogenic profile of maturing cartilage, as well as the vascular induced activation of pluripotency associated genes in chondrocytes during EO.
2. Methods
2.1. Cell culture
2.1.1. Media formulations
2.1.1.1. Expansion medium (XPAN)
XPAN medium was used for monolayer expansion. XPAN medium consisted of high-glucose GlutaMAX Dulbecco's modified Eagle's medium (DMEM) supplemented with 10% v/v fetal bovine serum, 100 U ml−1 penicillin, 100 mg ml−1 streptomycin (all Gibco Biosciences, Dublin, Ireland) and 5 ng ml−1 FGF-2 (Peprotech, UK).
2.1.1.2. Basic chemically defined medium (CDM−)
CDM− medium was used for undifferentiated (UD) µDBO µwell culture. Chemically defined medium was prepared by adding 100 U ml−1 penicillin, 100 mg ml−1 streptomycin (all Gibco Biosciences, Dublin, Ireland), 100 μg ml−1 sodium pyruvate, 40 μg ml−1, L-proline, 50 μg ml−1 and 1.5 mg ml−1 bovine serum albumin (Sigma Aldrich, Ireland) to DMEM.
2.1.1.3. Fully supplemented chemically defined medium (CDM±)
CDM+ medium was used for early cartilage (EC) and mature cartilage (MC) µDBO µwell culture. CDM− was supplemented with; 4.7 μg ml−1 L-ascorbic acid-2-phosphate, 4.7 µg ml−1 linoleic acid, 10 mg ml−1 insulin, 5.5 mg ml−1 transferrin, 6.7 µg ml−1 selenium (Gibco), 100 nM dexamethasone (Sigma–Aldrich, Ireland), and 10 ng ml−1 of human transforming growth factor-b3 (TGF-b3) (Peprotech, UK).
2.1.1.4. Hypertrophic medium (HYP)
HYP was used for hypertrophic cartilage (HC) µwell culture, CDM− was supplemented with 4.7 μg ml−1 L-ascorbic acid-2-phosphate, linoleic acid, 10 mg ml−1 insulin, 5.5 mg ml−1 transferrin, 6.7 µg ml−1 selenium (Gibco), 100 nM dexamethasone (Sigma–Aldrich, Ireland), 7.5 mM β-glycerophosphate, and 25 ng ml−1 L-Thyroxine (Sigma Aldrich, Ireland).
2.1.1.5. Endothelial growth medium–2Microvascular (EGM)
EGM-2MV (herein referred to as EGM) was used for human umbilical vein endothelial cells (HUVECs) expansion and MPS culture. Endothelial Basal Media (CC-3156, Lonza) was fully supplemented (CC-4147) as per the manufacturer's instructions.
2.1.2. Cell culture and expansion
2.1.2.1. Human bone marrow stromal cells (hBMSCs)
Whole human bone marrow (Lonza, USA) was purchased and hBMSCs were isolated. Whole bone marrow was plated at 2000 cells cm−2 and expanded in XPAN for one week at 37 °C, 5% O2 and 5% CO2. Once colonies had formed, cells were trypsinized and subculutred until sufficient cell numbers were achieved, cells were then frozen down and stored in liquid nitrogen (LN2) before use. The donor used was evaluated for osteogenic, adipogenic, and chondrogenic capacity. For experimental expansion, hBMSCs were plated at 5000 cells cm−2, expanded in XPAN until confluent and passaged at 80% confluence. hBMSCs at P4 were used for all experiments.
2.1.2.2. HUVECs
Green fluorescent protein expressing HUVECs, herein referred to as HUVECs, were purchased from Angio-proteomie. HUVECs were expanded in microvascular endothelial growth media (EGM-2MV, Lonza) on rat-tail collagen coated T75 flasks at 10 µg cm−2. HUVECs were used at passage 8 for all experiments.
2.1.2.3. µDBO formation and harvesting
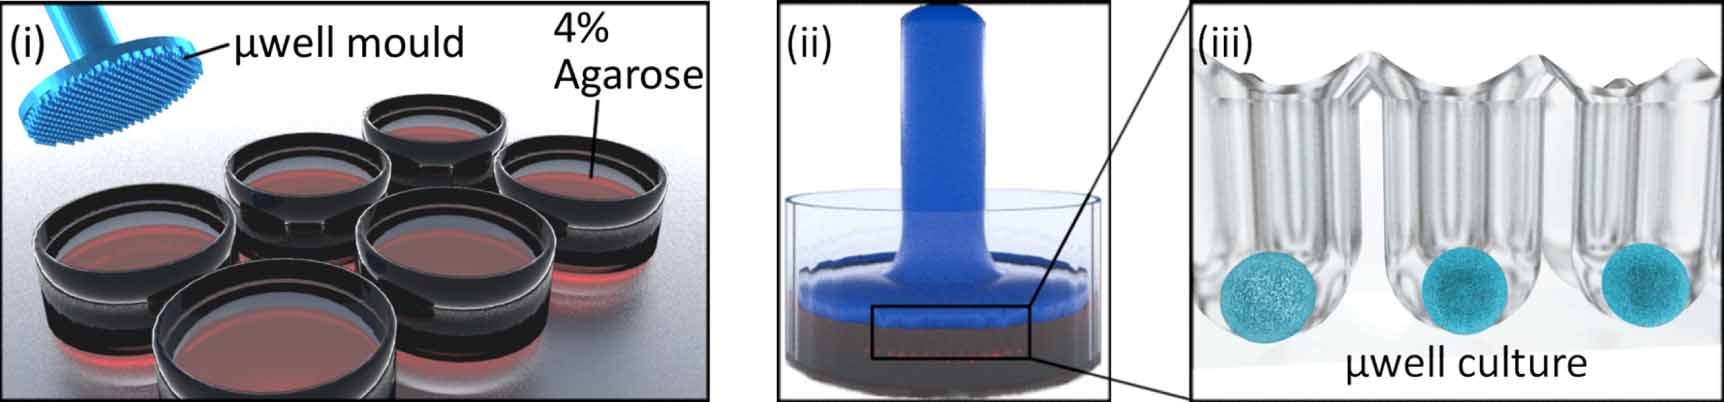
µDBOs were formed by seeding hBMSCs on an a 401 µwell agarose mould [31]. Custom designed master stamps were 3D printed (Form 3, Formlabs, USA), and sterilised with ethylene oxide before moulding. To create the multiwell moulds, 3 ml of 4% molten agarose (Sigma, Ireland) was pipetted into each well of a six well plate, stamps inserted, and agarose allowed to cool (figure 1). Upon removal of stamps, 3 ml of media is added and exchanged daily for two days to allow media contents to equilibrate in the agarose.

Figure 1. µDBO Fabrication. (i) µwells were fabricated in six well plates by pouring in 4% molten agarose into a six well plate and (ii) imprinting with a µwell mould. Once cooled, the µwell mould is removed and (iii) µwell culture wells are left imprinted in 4% agarose.
Download figure:
Standard image High-resolution imageTo form µDBOs, hBMSCs were pipetted on to the agarose mould, allowed to settle for 30 min in an incubator and centrifuged at 700 g for 5 min. About 3 ml of media was then exchanged every other day for the duration of culture. Four different organoids were fabricated to represent increasing cartilage tissue maturity: UD µDBOs (-ve control) were cultured in CDM− at 5% O2 for 7 days, EC µDBOs were cultured in CDM+ at 5% O2 for 7 days, MC µDBOs were cultured in CDM+ at 5% O2 for 21 days, and HC µDBOs were cultured for 21 days in CDM+ at 5% O2 and a further 7 days in HYP media at 20% O2.
To harvest µDBOs, high media flow from a 20 ml syringe and 20 g needle was used to release µDBOs from each individual well. Suspended µDBOs were then harvested directly from the medium, while µDBOs remaining in the well were removed by flipping the agarose moulds into a fresh six well plate and centrifuging for 600 g for 5 min and collecting in media. µDBOs were passed through a 500 µm filter to remove fused µDBOs and agarose fragments.
2.1.3. µDBO diameter
µDBO diameter was determined using image analysis. Images of µDBOs were taken during culture with a brightfield microscope and images were measured manually using FIJI software [32].
2.1.4. Biochemical analysis
After µwell culture, µDBOs were washed in phosphate buffered saline (PBS) and frozen in liquid nitrogen and stored at −80 °C. Each construct was digested with papain (125 μg ml−1) in 0.1 M sodium acetate, 5 mM L-cysteine–HCL, 0.05 M ethylenediaminetetraacetic acid, pH 6.0 (all from Sigma–Aldrich) at 60 °C and 10 rpm for 18 h. DNA content was quantified using a Quant-iT™ PicoGreen™ dsDNA Assay Kit (Invitrogen) as per the manufacturer's instructions. Sulphated glycosaminoglycans (sGAGs) were quantified using a 1,9-dimethyl-methylene blue (DMMB) assay. Briefly, digested samples were mixed with a DMMB staining solution and absorbance was measured at 530 nm and 590 nm. sGAG levels were interpolated from a standard curve of 530/590 nm absorbance ratio using a chondroitin sulfate standard.
2.1.5. Live-dead assay
Cell viability was assessed after µwell culture using a LIVE/DEAD™ viability/cytotoxicity assay kit (Invitrogen, Bioscience, Ireland). µDBOs were washed with PBS followed by incubation with PBS containing 2 µM calcein AM (green fluorescence of membrane for live cells) and 4 µM ethidium homodimer-1 (red fluorescence of DNA for dead cells; both from Cambridge Bioscience, UK). µDBOs were again washed in PBS, imaged with a Leica SP8 scanning confocal excited at 494 nm and 528 nm, and read at 517 nm and 617 nm respectively.
2.1.6. Microphysiological chip fabrication
Microfluidic devices were fabricated using replica moulding (figure 2). Master moulds were fabricated by laser cutting the channel geometries from 1 mm thick PMMA Poly(methyl methacrylate) sheets and adhering to 30 mm diameter PMMA plates using acrylic glue (Scigrip 4SC, USA). Master moulds were then glued to the bottom of 100 mm diameter petri dishes. To create microfluidic chips, sylgard 184 polydimethylsiloxane (Dowsil, USA), was mixed at 10:1 (polymer:catalyst), degassed under 40 mbar vacuum for 10 min and poured on master moulds. PDMS was allowed to cure overnight at 80 °C. Once cured, PDMS replicas were removed by cutting around the circumference of the mould and removing with a spatula. PDMS replicas were then trimmed and cleaned using adhesive tape. To form the microfluidic devices, PDMS replicas and 1.5 thickness glass coverslips were plasma treated with corona plasma (Corona SB, BlackHole Labs, Paris) for 1 min each and pressed together. Devices were then placed in an oven overnight at 60 °C for hydrophobic recovery. Finally, devices were sterilised using ethylene oxide and allowed to air for two days before culture.
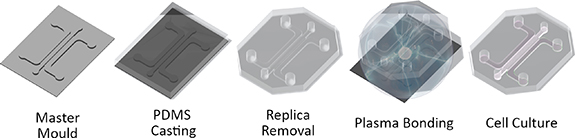
Figure 2. Microphysiological system fabrication. MPS systems fabricated using replica moulding. PDMS is cast on to a master mould to create a MPS replica. The replica is removed and treated with corona plasma and bonded to a 1.5 thickness glass coverslip. The bonded MPS is then treated at 60 °C overnight and sterilised before cell culture.
Download figure:
Standard image High-resolution image2.1.7. Microfluidic device culture
Microfluidic devices were seeded with a co-culture of µDBOs and HUVECs. Each device holds 100 µl of hydrogel. µDBOs and HUVECs were harvested and resuspended in medium containing with 4 U ml−1 thrombin (Sigma Aldrich, Ireland). About 50 µl of cell/µDBO suspension was then mixed with an equal volume of 6 mg ml−1 bovine fibrinogen (Sigma Aldrich, Ireland), mixed and quickly pipetted into the microfluidic devices to minimise µDBO settling. Fibrin was allowed to clot for 40 min in a humidified incubator, after which EGM-2MV is added to each device. Media was exchanged daily. Final concentrations were 2000 µDBOs ml−1 (200/device) and 4 × 10⁶ HUVECs/ml (400 000/device).
2.1.8. Histology
µwell culture µDBOs were fixed overnight at 4 °C in 4% paraformaldehyde (PFA), washed with PBS and allowed to settle at the bottom of a well of a flat bottom 96 well plate. Once settled, PBS was removed, and a 4% molten agarose solution was pipetted on to the settled µDBOs and allowed to cool to hold them in place. For MPS culture, devices were washed with PBS, fixed with 4% PFA at 4 °C overnight, and again washed with PBS. To remove tissues from the MPS devices, coverslips were covered with tape to avoid cracking and a scalpel was used to separate the PDMS device from the coverslip. Both µwell culture and MPS samples were then dehydrated in a graded series of ethanol, embedded in paraffin wax, sectioned at 5 µm and affixed to microscope slides. Samples were stained with H + E to assess cell and tissue morphology, picrosirius red to assess collagen deposition, alizarin red to assess mineralisation, and alcian blue to assess glycosaminoglycan (GAG) deposition.
2.1.9. Vascular network morphology analysis
Entire MPS devices were imaged after seven days to analyse vascular formation. Images were analysed using a custom macro to automate processing in FIJI [32]. Two regions of interest were cropped for the analysis; vasculature formation in the bulk gel, and vasculature formation around the µDBO. The images of these vasculature regions were processed for improved signal to noise ratio; images were despeckled, contrast adjusted and Gaussian blurred and thresholded to form a binary image. Finally this image was processed to form a simple skeletonised image and analysed using FIJI's analyse skeleton function [33]. Automated thresholding was checked against the original image. To compare vascularisation in the two regions, a 1.37 µm2 area was analysed. For regions without µDBOs, this region is a simple square of area 1.37 µm2. For regions with a µDBO, this region is a square with the area of the µDBO removed from the analysis, but also of area 1.37 µm2 (supplementary figure 1).
2.1.10. Perfusion
Vascular network perfusion was evaluated at day 7 by perfusion of fluorescent dextran. 70 kDa rhodamine conjugated dextran (Sigma Aldrich, Ireland) was diluted in PBS to 2 mg ml−1, vortexed and stored at 4 °C protected from light. To perfuse the vascular networks contained in the MPS devices, media was removed from both media side channels and device placed on a Leica SP8 scanning confocal microscope stage. Once positioned for imaging, dextran was introduced to one side of the vascular network by filling the channel to the top of the feeding port of each device; creating a hydrostatic pressure gradient across the vascular network. Images were taken immediately to avoid excessive diffusion of dye across the bulk hydrogel.
2.1.11. Gene expression analysis
2.1.11.1. Sample handling
At termination of µDBO µwell culture, µDBOs were washed in PBS and snap frozen in liquid nitrogen before RNA isolation. Upon termination of in MPS culture, fibrin gels containing the µDBO/HUVEC co-culture was removed from the MPS device. The hydrogel was then transferred to 1.5 ml Eppendorf and 1 ml of a fibrinolytic solution; prepared by dissolving 50 FU ml−1 (fibrin degradation units) of nattokinase (NSK-SD; Japan Bio Science Laboratory Co. Ltd), was added and rotated at 37° for 40 min. The resulting µDBO/HUVEC suspension was passed through a 100 µm cell strainer and washed with 10 ml of PBS to separate µDBOs from individual HUVECs. The µDBOs were then retrieved from the filter, placed in a 1.5 ml Eppendorf, spun down to remove excess PBS and frozen in liquid nitrogen. Samples were stored at −80 °C until RNA isolation.
2.1.11.2. RNA isolation and cDNA transcription
µDBOs frozen at −80 °C were thawed on ice. Once thawed, 500 µl of TRIzol (Invitrogen, LifeTechnologies, Carlsbad, CA) was added and µDBOs were mechanically disrupted with a pestle (treated with diethyl pyrocarbonate) for 10 s and centrifugation to pull insoluble material to the bottom of the Eppendorf. This process of disruption and centrifugation was repeated until no insoluble material remained in the Eppendorf (∼2 times). The pestle was then rinsed with another 500 µl of TRIzol into the sample for a total volume of 1 ml. The sample was then left to stand at room temperature for 7 min. About 200 µl Chloroform (Sigma, Ireland), was then added to each sample, vortexed and incubated for 5 min at 4 °C. Samples were then centrifuged at 12 000 g for 15 min at 4˚C. About 500 µl of the top aqueous, RNA containing phase of the sample was removed and transferred into an RNAse free Eppendorf. About 500 µl of 2-Propanol (Sigma, Ireland) and 2 µl of GlycoBlue co-precipitant (Invitrogen) were mixed to precipitate the RNA and left to stand at room temperature for 10 min. Samples were the centrifuged at 14 000 g for 15 min at 4 °C. Supernatants were removed and each RNA pellet was washed with 1 ml of 75% ethanol and incubated at −20 for one day. Samples were then centrifuged at 7000 g for 5 min at 4 °C. All ethanol was then removed and the RNA pellet was resuspended in 20 µl of RNAse free water. RNA quantity and quality was checked with a spectrophotometer.
RNA samples were immediately transcribed into CDNA following isolation. Reverse transcription was carried using a CDNA RT kit (Applied Biosystems, USA) according to the manufacturer's instructions using a thermocycler. Following reverse transcription, cDNA was measured using a Qubit™ ssDNA assay kit (Invitrogen, USA) as per the manufacturer's instructions using a Qubit™ fluorometer (Invitrogen, USA). Samples were stored at a concentration of 2ng/µL at −20 °C.
2.1.11.3. PCR
Levels of gene expression were measured with real-time PCR (ABI 7500-fast, Applied Biosystems) using SYBR green master mix (Applied Biosystems) and human specific primers (table 1). The quantity of gene transcripts was normalised to that of a stable housekeeping gene, in this case GAPDH. Efficiency of all primer pairs were calculated by 10-fold serial dilutions of cDNA starting at 50 ng per reaction.
Table 1. List of primer pairs used for PCR reactions.
| Gene name | Gene full name | Forward/Reverse | Tm (°C) in use | Tm (°C) predicted |
|---|---|---|---|---|
| GAPDH | Glyceraldehyde-3-Phosphate Dehydrogenase | F: 5ʹ ACAGTTGCCATGTAGACC 3ʹ | 60 | 59.0 |
| R: 5ʹ TTGAGCACAGGGTACTTTA 3' | 58.3 | |||
| RUNX2 | Runt-Related Transcription Factor 2 | F: 5ʹ GCAGTATTTACAACAGAGGG 3ʹ | 60 | 58.1 |
| R: 5ʹ TCCCAAAAGAAGTTTTGCTG 3' | 59.3 | |||
| MMP-13 | Matrix Metallopeptidase 13 | F: 5ʹ AGGCTACAACTTGTTTCTTG 3ʹ | 60 | 58.4 |
| R: 5ʹ AGGTGTAGATAGGAAACAT 3' | 55.1 | |||
| COL10a1 | Collagen Type X Alpha 1 Chain | F: 5ʹ GCTAGTATCCTTGAACTTGG 3ʹ | 60 | 50.2 |
| R: 5ʹ CCTTTACTCTTTATGGTGTA 3' | 54.5 | |||
| SOX2 | SRY-Box Transcription Factor 2 | F: 5ʹ ATAATAACAATCATCGGCGG 3ʹ | 60 | 57.1 |
| R: 5ʹ AAAAAGAGAGAGGCAAACT 3' | 58.1 | |||
| POU5F1 (OCT4) | POU Class 5 Homeobox 1 | F: 5ʹ GATCACCCTGGGATATACAC 3ʹ | 60 | 58.1 |
| R: 5ʹ GCTTTGCATATCTCCTGAAG 3' | 59.1 | |||
| NANOG | Nanog Homeobox | F: 5ʹ CCAGAACCAGAGAATGAAATC 3ʹ | 60 | 60.1 |
| R: 5ʹ TGGTGGTAGGAAGAGTAAAG 3' | 55.9 | |||
| THBS1 | Thrombospondin 1 | F: 5ʹ GTGACTGAAGAGAACAAAGAG 3ʹ | 60 | 55.6 |
| R: 5ʹ CAGCTATCAACAGTCCATTC 3' | 57.3 | |||
| SPARC | Secreted Protein Acidic and Cysteine Rich | F: 5ʹ AGTATGTGTAACAGGAGGAC 3ʹ | 60 | 52.9 |
| R: 5ʹ AATGTTGCTAGTGTGATTGG 3' | 57.6 | |||
| COL18a1 | Collagen Type XVIII Alpha 1 Chain | F: 5ʹ TTACGACAGCAATGTGTTTG 3ʹ | 60 | 59.8 |
| R: 5ʹ AGAAAGTCAAACGGAAACTG 3' | 58.4 |
2.1.12. Statistical analysis
GraphPad Prism (GraphPad, USA) was used for all statistical analysis. Comparisons made between two groups, or multiple groups were conducted using student's t-test or one-way analysis of variance (ANOVA) respectively. Two-way ANOVA was used to compare multiple groups at multiple levels. Non-parametric tests were used where assumptions of normality could not be justified. Graph notation for deemed significance is as follows: * p < 0.05, ** p < 0.01, *** p < 0.001, **** p < 0.0001.
3. Results
3.1. Fabrication of DBOs for modelling EO
To investigate the changing cross-talk between vasculature and developing bone as it matures, microscale cellular anaolgues of developing bone (here termed µDBOs) suitable for MPS applications were utilised. hBMSCs were aggregated in a µwell culture system prior to seeding in vascularised MPS devices. These µDBOs can be maintained in culture until they progress towards an HC phenotype and accumulate a mineralised cartilageneous matrix, or removed from culture at earlier timepoints for DBOs representative of earlier stages of maturation (figures 3(A) and (B)). GAG deposition (normalised to DNA) increases as µDBOs mature, with no further increase as they progress from MC to HC (figure 3(C)). Cell and tissue distribution througout the µDBOs was also analysed using a hematoxylin and eosin stain. Nucleii and extracellular matrix were observed throughout the engineered tissues (figure 3(D)). Finally, gene expression analysis revealed a culture duration dependent expression of genes associated with hypertrophy and osteogenesis; with the relative expression of RUNX2, MMP13 and COL10a1 increasing in the DBOs as they mature from EC, to MC and finally to HC (figure 3(E)).

Figure 3. Fabrication of DBOs for modelling EO within MPS systems. (A) Time plot showing increase in µDBO diameter as µDBOs synthesise matrix over 28 days. (B) Representative histological sections of early cartilage (EC), mature cartilage (MC) and hypertrophic cartilage organoids. EC and MC sections are stained with Alcian Blue to assess sGAG deposition, while HC was stained with alizarin red to assess mineralisation. (C) sGAG deposition normalised to DNA for each stage of DBO maturity. (D) Hematoxylin and eosin staining showing cell and tissue deposition; Scale bar = 100 µm. (E) Hypertrophic genes RUNX2, MMP13, and Col10a1 increase in expression as µDBOs mature to hypertrophy.
Download figure:
Standard image High-resolution image3.2. Vascularisation of DBOs in a MPS device
Having developed µDBOs to model developing endochondral bone, these organoids were then vascularised within a MPS device (figure 4(A)). To this end, HUVECs and MC µDBOs were seeded into MPS devices within a fibrin hydrogel, resulting in the development of vascular networks around the µDBOs over seven days in culture. In order to optimise resource requirements for the model, two µDBOs cell densities, 4000 cells/µDBO (as per previous figure) and 1000 cells/µDBO were evaluated. Additionally, to better mimic the low oxygen environment in a fracture callus, and given the sensitivity of osteoprogenitors to oxygen tension [34], 20% O2 and 5% O2 levels were also investigated. 4000 cell µDBOs cells are viable (figure 4(B)), whereas in 1000 cell µDBOs some cell death is observed, and disconnected vasculature forms with evidence of cell debris, which was confirmed semi quantitatively (figure 4(D)). Furthermore, 4000 cell µDBOs also supported the development of perfusable vasculature within 75% of MPS devices, as evident by the transport of 70kDa rhodamine conjugated dextran through the vascular networks at 20% O2. (figure 4(C)). At lower levels of external oxygen (5% O2), the µDBO were viable and vascular network formation was observed, however these networks were not perfusable. Given the favourable network formation and prefusion characteristics of the 4000 cells/µDBO group at 20% O2, these experimental parameters were used in subsequent studies.
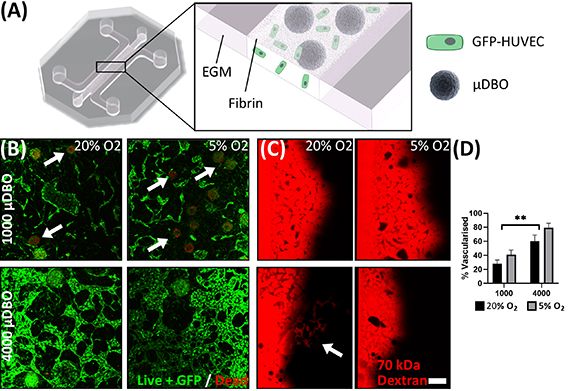
Figure 4. Optimisation of vascularised µDBO culture. (A) Schematic illustrating the vascularised µDBO culture, GFP labelled HUVECs and µDBOs are seeded in a fibrin gel and cultured in EGM. (B) LIVE/DEAD staining of vascularised µDBOs. Cytotoxicity was observed in µDBOs with lower cell numbers (white arrows) (C) Vascularised µDBO perfusion with Rhodamine conjugated dextran identifies perfusable vasculature in 4000 cell µDBOs. (D) % area vascularised. Scale bar = 200 µm.
Download figure:
Standard image High-resolution image3.3. Vascular network development is dependent on the phenotype of the DBOs
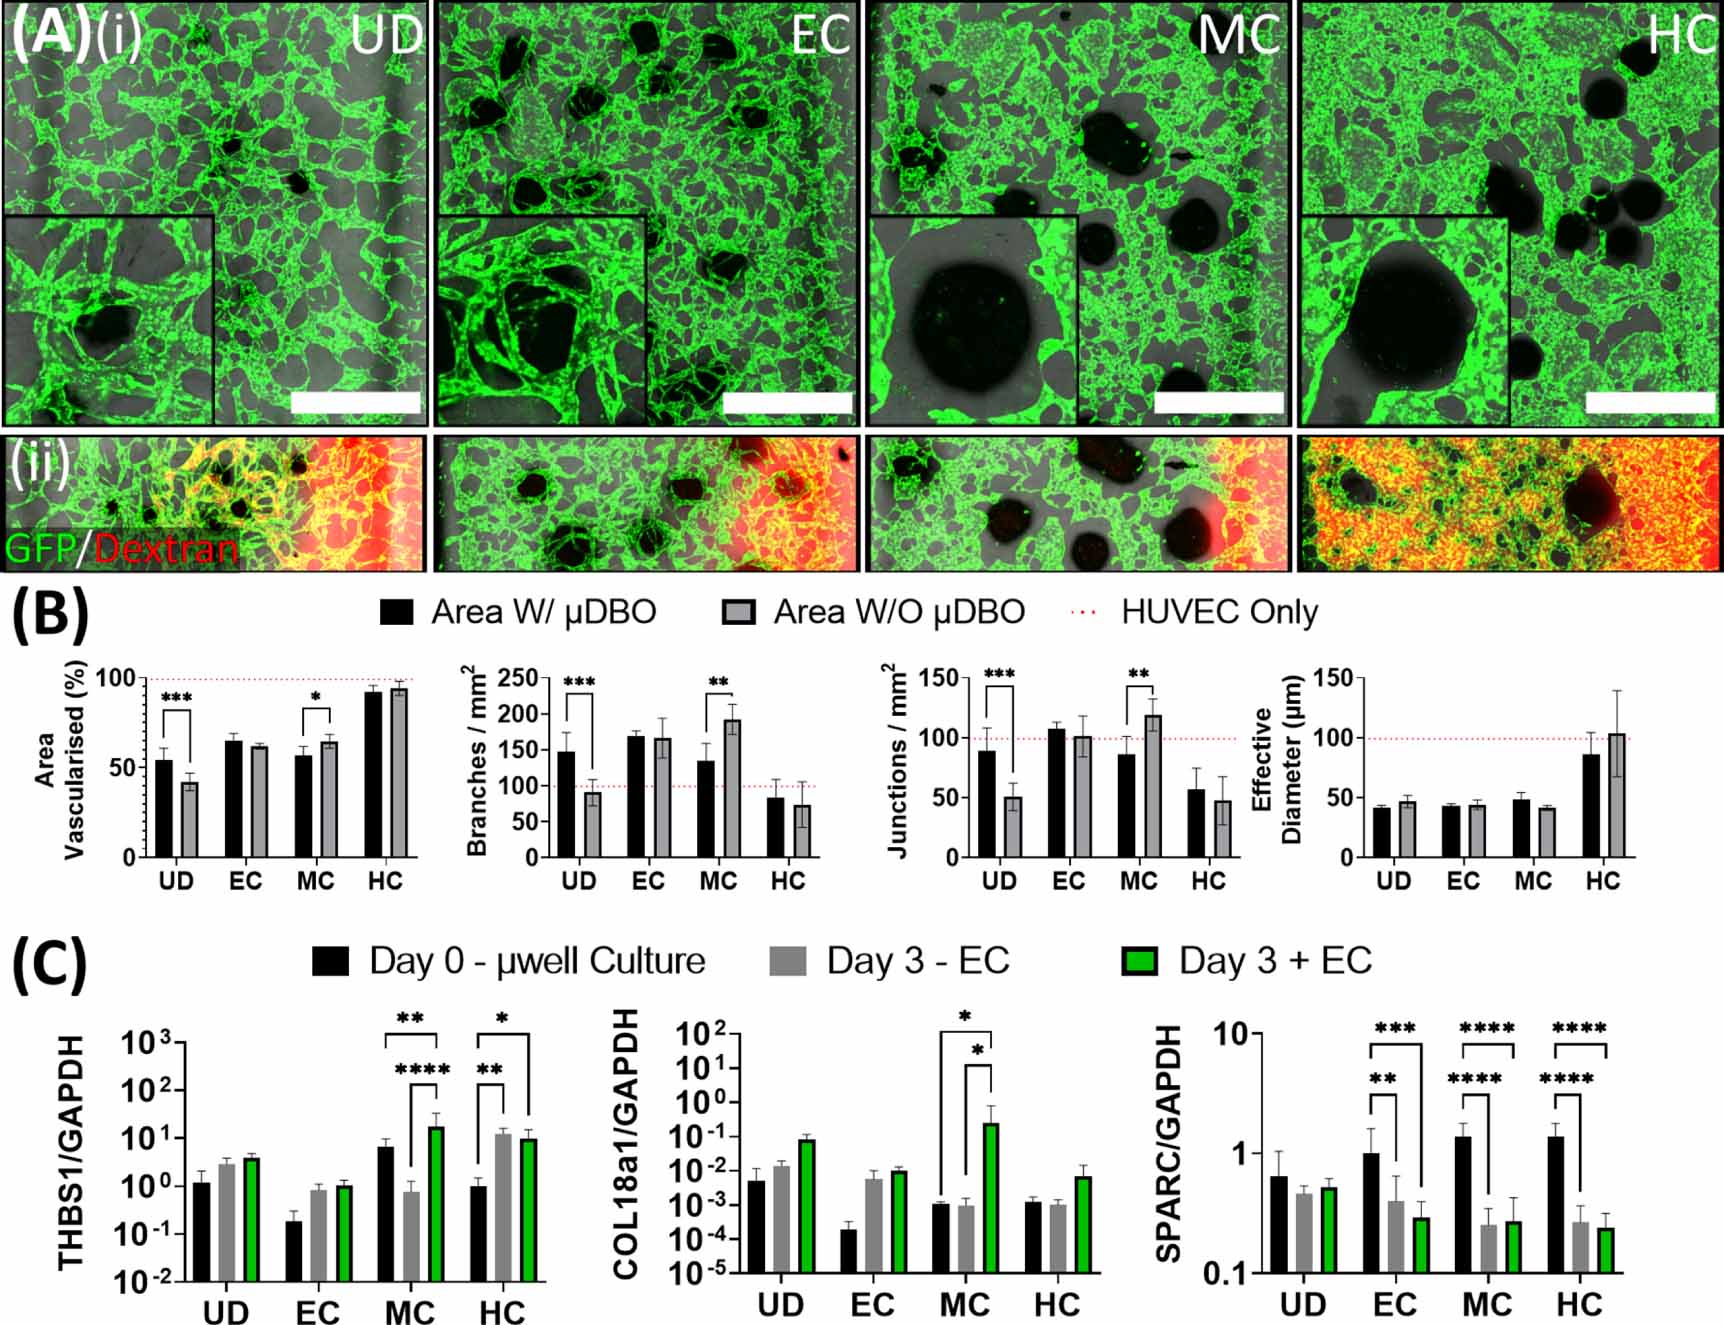
Having identified conditions to vascularise the µDBOs within the MPS device, the next step was to characterise µDBO-vascular cross talk and assess whether the phenotype of the µDBOs (EC, MC, HC) influenced the development of the vascular network. At day 3 of MPS culture, no discernible differences were observable between groups, as vascular structures have not formed and cross talk between the two tissue niches was yet to have an appreciable effect (supplementary figure 2). However, by day 7, striking differences in vascular morphogenesis with µDBO maturity were observed (figure 5(A)(i)). The EC µDBOs exhibited a pro-angiogenic phenotype that drives the invasion of small diameter vessels towards the µDBOs. In contrast, the more differentiated MC µDBOs exhibit an anti-angiogenic phenotype that inhibits vascular invasion in the area surrounding the µDBO. Additionally, the vessels around MC µDBOs were of larger diameter than with EC µDBOs. As the µDBOs mature to hypertrophy (HC), a morphologically different vasculature again surrounds the µDBOs, with higher vascular coverage in the bulk gel. In an attempt to determine if paracrine factors secreted by the µDBOs were responsible for changes in vascular formation, HUVEC only MPS devices were cultured in µDBO conditioned media for seven days. Interestingly, similar vascular morphologies were observed in HUVEC only MPS devices fed with µDBOs conditioned media (see supplementary figure 2), thus the observed differences in vascular morphology are at least partially attributable to paracrine mechanisms. Perfusion of the formed vasculature shows that chondrogenic differentiation of the µDBO impacts network development and function, as the vasculature surrounding these µDBOs was unperfusable (figure 5(A)(ii)). However further µDBO maturation to hypertrophy correlates with a switch to a more pro-angiogenic phenotype, as evident by the development of patent and perfusable vasculature.
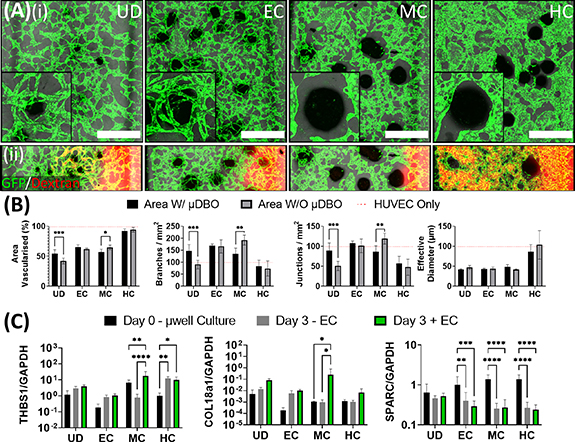
Figure 5. Vascularised µDBOs mimic in vivo maturity-dependent vascular response. (A) (i) Wide microscopic images of vascularised µDBOs show a range of vascular morphologies form and are sensitive to µDBO maturity. Inset—higher magnification image of single representative µDBO. Scale bar wide image = 1 mm. (ii) Perfusion of the formed vascular networks with Rhodamine-conjugated dextran. (B) Semi-quantification of vascular morphology in vascularised µDBOs indicates inhibited vascularisation around mature cartilage. n= 6 (C) Expression of anti-angiogenic genes THBS1, COL18a1 and SPARC by vascularised µDBOs. n = 6.
Download figure:
Standard image High-resolution imageQuantification of developing vascular networks confirmed the suppression of vascularisation around MC µDBOs (figure 5(B)). Area vascularised, branch density, and junction density were significantly reduced in the area directly around the MC µDBOs compared to vasculature in other regions of the same hydrogel. Even in regions of the gel distant to the µDBO, the vasculature morphology was strongly dependent on phenotypic maturation, with markedly different morphologies depending on the µDBO maturity. Less branched, thicker vessels were observed in the presence of hypertrophic µDBOs. In addition, while µDBOs dramatically influenced vascular architecture, the presence of ECs did not appear to alter the morphology of the µDBOs histologically (see supplementary figure 3).
To investigate the mechanism by which µDBOs exert their changing pro or anti-angiogenic effects, the expression of three anti-angiogenic genes was assessed; thrombospondin-1 (THBS1), Collagen type 18 (COL18a1) and Secreted Protein Acidic and Cysteine Rich (SPARC)/OSTEONECTIN (SPARC) (figure 5(C)). These genes were quantified before MPS culture (µwell culture), and after three daysof MPS culture in the absence (−EC) and presence (+EC) of HUVECs. The expression of THBS1 and COL18a1 were both significantly upregulated in MC µDBOs in the presence of ECs, correlating with the inhibition of vascularisation observed morphologically. In contrast, SPARC was downregulated in all differentiated spheroids in both vascularised and unvascularised conditions.
3.4. Vascularisation enhances the expression of the pluripotent factors SOX2 and OCT4 in DBOs
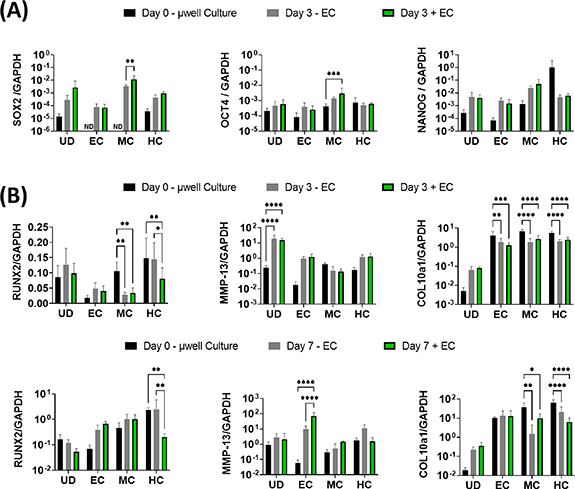
We next sought to examine whether this MPS could capture some of the key events observed during EO in vivo; the induction of pluripotency genes in chondrocytes with vascular invasion, and their subsequent trans-differentiation into osteoblasts. For this, gene expression in unvascularised µDBOs (−ECs), vascularised (+EC), and µDBOs before MPS seeding (Day 0—µwell culture) were quantified using quantitative Reverse Transcription - Polymerase Chain Reaction (qRT-PCR). Interestingly, MPS culture (Day 3 ± EC) generally increased the expression, though non-significantly, of pluripotency genes in all µDBOs compared to day 0 µwell culture (figure 6(A)), indicating a possible effect of the angiogenic factors in the medium. However, the specific presence of vasculature significantly increased the expression of the pluripotency associated genes SOX2, and OCT4 in MC DBOs, having no effect on the expression of these genes in UC, EC or HC µDBOs. This indicates specific endothelial cell driven induction of pluripotency in the MC µDBOs.
Figure 6. Vascularised µDBOs mimic key events in endochondral bone development. (A) Expression of pluripotency genes in µDBOs prior to MPS culture (µwell culture), after three days culture unvascularised (−EC) and after three days vascularised culture (+EC). (B) Expression of hypertrophic genes in µDBOs prior to MPS culture, after three and seven days culture unvascularised, and after three and seven days vascularised culture. n = 6.
Download figure:
Standard image High-resolution image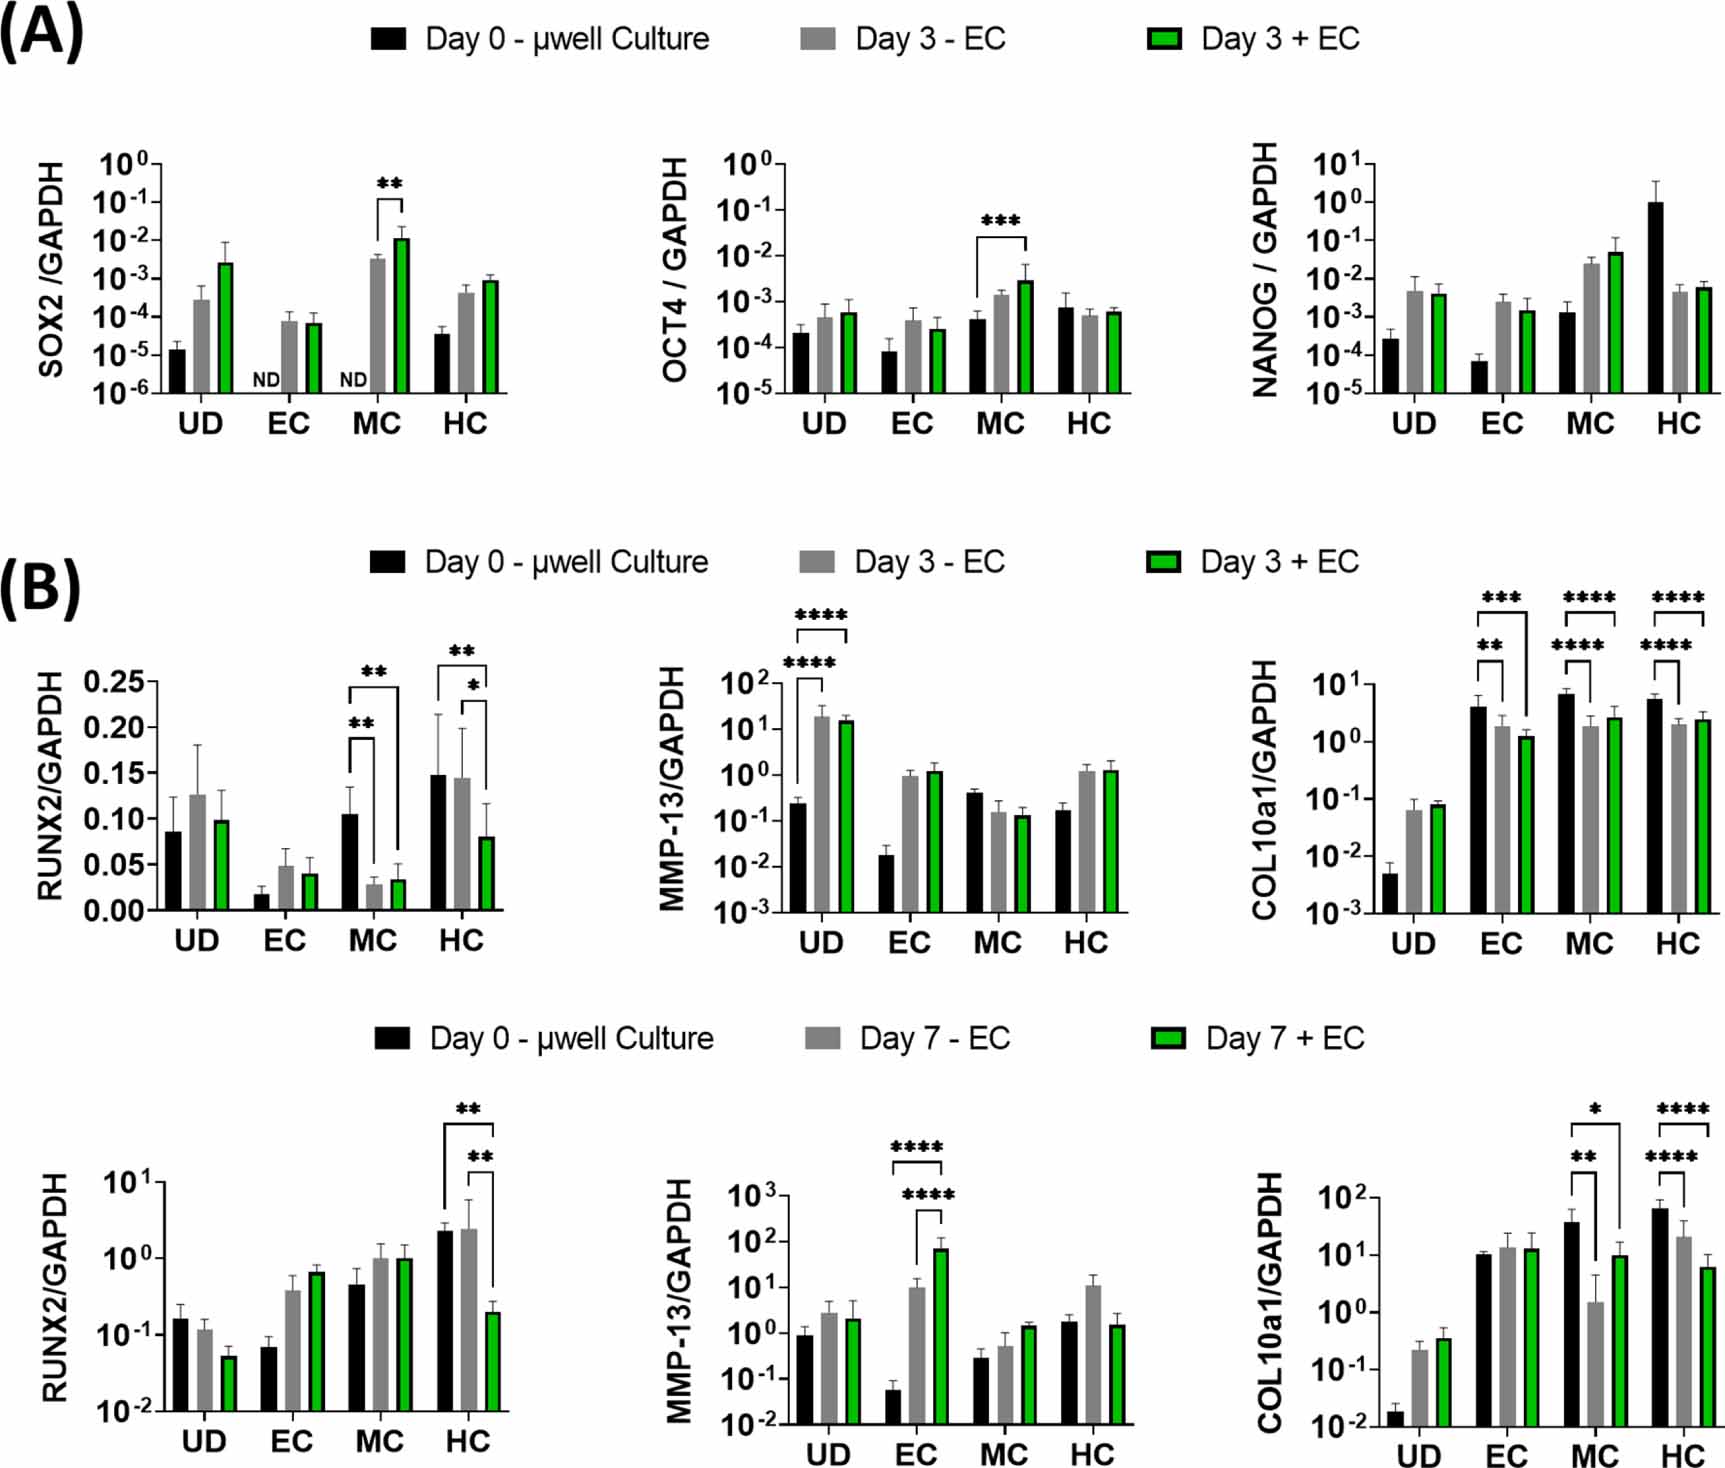
Next, the extent to which µDBO vascularisation accelerated hypertrophy and progression towards an osteogenic phenotype was examined. Hypertrophic/osteogenic genes RUNX2, MMP13, and COL10a1 were quantified after three and seven days in unvascularised and vascularised µDBOs (figure 6(B)). At day 3, the presence of vasculature alone lead to a reduction in RUNX2 expression in HC DBOs, but otherwise had little effect on hypertrophic/osteogenic gene expression. After seven days, the presence of the vasculature enhanced the expression of MMP-13 in the EC DBOs, but had no effect on RUNX2 or COL10a1 expression. Gene expression was largely unaffected by vascularisation in MC µDBOs. Finally, in HC µDBOs, the presence of vasculature again reduced the expression of RUNX2, but has no effect on MMP-13 or COL10a1 expression. Taken together, these results suggest vascularisation induces upregulation of hypertrophic genes, specifically MMP-13, in EC µDBOs, but not in MC or HC µDBOs for the relatively short culture periods assessed in this study (three or seven days).
4. Discussion
Transition of a cartilage template to bone during endochondral ossification is essential in bone development and regeneration, yet it is still poorly understood. The cartilage template matures over time during EO, initially supressing but later promoting vascularisation of the developing bone template [35–37]. The change in cross-talk between these two tissue niches ensures proper bone development, and, in a therapeutic context, also dictates the potential of a cartilage template to effectively develop into bone tissue [10]. Currently, in vitro model systems to model and further understand this process are lacking [38]. Until advanced in vitro bone models have been developed and validated, the bone research community will continue to rely on animal models that are under ethical scrutiny [39], can be prohibitively expensive, and do not adequately predict efficacy when translating bone therapies to humans [40]. In light of this problem, this study describes the design and development of an in vitro model of human EO consisting of DBOs and their interaction with invading vasculature. This MPS system is validated by demonstrating its potential to recapitulate key events observed during EO.
Angiogenesis of the developing bone rudiment occurs as the cartilage template matures towards hypertrophy. Thus, to further understand the crosstalk between vasculature and developing bone as it matures, a range of DBOs representative of different stages of early bone development (EC, MC, HC) was required. To achieve this, a µwell culture system was used to generate microscale cartilage µDBOs for seeding within an MPS platform. Consistent with the literature [41], it was demonstrated that these microscale DBOs accumulate a cartilaginous matrix, mineralise, and exhibit an upregulation of genes associated with hypertrophy. Interestingly, mineralisation in these hypertrophic µDBOs occurred in the core of the spheroids, which we have previously observed [31]. However, mineralisation on the outer surface of hMSC spheroids has also been observed in similar experiments [10]. The localisation of mineralisation is likely to be influenced by how specific experiment setups and spheroid sizes influences the oxygen tension within the spheroid, which has been shown to be a strong modulator of hypertrophic mineralisation [42]. As we used a standard model for inducing MSC chondrogenesis, we focused our analysis on the expression of hypertrophic and endochondral markers. Chondrogenesis with time in culture was confirmed by sGAG accumulation and standard histology; for further characterisation of such organoids, the interested reader is referred to our other work where we used these for putative therapeutic applications [25, 31, 43]. By simply terminating µwell culture at specific stages, microscale DBOs (µDBOs) with unique phenotypes representative of the different stages observed in early endochondral bone development can be fabricated. Once primed in µwell culture, µDBOs can be vascularised by seeding with endothelial cells in a matrix that permits vascular formation. Vascular networks form within 4–7 days, which is consistent with systems using similar cells and matrices [44–46]. The advantage of this approach is that vasculogenesis can proceed in the presence of the µDBOs, and the two tissues can be subsequently separated and analysed.
This model was able to recreate key biological phenomena that have been observed in vivo. Firstly, stable cartilage is avascular, and inhibits angiogenesis through the expression of anti-angiogenic factors [47] such as thrombospondin-1 [48], collagen type 18 [49], and SPARC [50], among others. In the model, inhibition of vascular invasion was observed around MC organoids, which correlated with an upregulation of THBS1. THBS1 exerts its antiangiogenic properties by three different mechanisms: ligation of CD36 on ECs to induce apoptosis [51], binding with the VLDL receptor to induce cell cycle arrest [52], and direct binding and inhibition of vascular endothelial growth factor (VEGF) via the low density lipoprotein receptor-related protein-1 (LRP-1) [53]. Morphologically, no cellular debris indicative of apoptosis was observed in the model, thus cell cycle arrest or VEGF inhibition would be more likely candidate antiangiogenic mechanisms, which could be deciphered by probing for downstream effectors of both mechanisms with Ki67 or an LRP-1 antagonist. COL18a1 was also upregulated in MC µDBOs in the presence of vasculature. Endostatin is a cleaved fragment of collagen XVIII (gene product of COL18a1) that has well documented anti-angiogenic properties and is being trialled for treatment of solid tumours [54]. COL18a1 was found to be upregulated in both unvascularised and vascularised µDBOs, with vascularised µDBOs having significantly upregulated expression, which corresponded with decreased vascularisation. Collagen XVIII is strongly expressed in cartilage and fibrocartilage [49] but not much else is known about its biogenesis, or induction of its expression. Finally, a downregulation of SPARC was observed in all µDBO groups, irrespective of the presence of vasculature. Downregulation of SPARC coincided with both increased vascularisation around EC µDBOs and decreased vascularisation around MC µDBOs. The effects of SPARC are complex, as it has been demonstrated to have both angiogenic and antiangiogenic effects [55]. In this case, SPARC could potentially be regulated by another protein that modulates its activity post-transcriptionally, such as TGF-β activation [56], where it is the variance in this factor that induces the variance in vascular phenotypes. Further studies would be required to test such hypotheses. Nevertheless, this model can successfully replicate the complex interaction between cartilage templates and invading vasculature during EO.
The MPS model was also able to recapitulate the vasculature-induced induction of pluripotency associated genes in hypertrophic chondrocytes, a phenomena observed during EO in fracture healing [1, 57, 58]. There was a general trend of increased SOX2 expression in all µDBOs in MPS culture relative to µwell culture. However, a significant increase in SOX2 expression was evident in MC µDBOs in the presence of vasculature. This correlates with vasculature induced SOX2 expression observed in EO bone formation [1]. Thus, the model recreates vasculature induced expression of pluripotency genes in vitro and warrants exploration of canonical angiogenic growth factors as possible mediators of this induction. Similarly, there was a general trend of increased OCT4 expression in µDBOs cultured in MPS devices compared to µwell culture, with a significant upregulation in MC µDBOs when co-cultured with vasculature. This finding on the chip agrees with the increased OCT4 expression observed in chondrocytes undergoing EO mediated bone formation [1].
In the context of hypertrophy, the presence of vasculature had little effect on the expression of hypertrophic/osteogenic genes across all µDBOs at day 3 post seeding in MPS devices. The exception to this was in HC, where vasculature actually downregulated RUNX2 expression. IGF-1, which is an essential component of the medium used in these experiments, has been used to promote stable cartilage formation and inhibits the expression of RUNX2 and MMP-13 [59], which may partially account for this particular observation. At day 7, vasculature again generally had little effect on osteogenic/hypertrophic gene expression, with MMP-13 upregulation in EC µDBOs the notable exception. This observation was amongst a general increasing trend in hypertrophic gene expression observed from day 3 to day 7 in all µDBOs. It has been shown that angiogenic factors, such as VEGF, direct MSCs toward an osteoblastic phenotype, possibly accounting for this observation [60].
Additional steps are required to facilitate further development and validate the EO MPS. Firstly, our data suggests that ECs contribute to induction of pluripotency in µDBOs, particularly in MC µDBOs. However, it is also clear that µDBOs are perhaps more sensitive to the angiogenic milieu of the EGM-2MV media that contains a number of angiogenic growth factors. While the model still substantiates the canonical actions of endothelial cells in EO driven bone formation, it also suggests that secreted angiogenic factors may have a significant role to play. In the context of model construction, HUVECs were used as they are a practical and well characterised primary human EC type for MPS applications. However ECs are a heterogeneous population that vary depending on their origin [61], and ECs specifically from bone have been shown to be sensitive to key signalling molecules involved in EO, such as PTHrP, while those from other tissues have not [62]. Nonetheless, the results described here indicate that the introduction of vasculature, and/or the angiogenic milieu, regulates the phenotype of human DBOs with MPS, enabling the developing of in vitro models of EO that mimic key phenomena observed in vivo.
5. Conclusions
This study details the development of an advanced in vitro model of EO. Specifically, we model the critical cross talk between developing bone and vasculature in EO that underpins the cartilage to bone transition. Our model mimics key events in endochondral bone development: the changing angiogenic profile of cartilage as hypertrophy proceeds as well as the vasculature induced expression of pluripotency associated genes in the cartilage template. Further development of these advanced in vitro systems could bring about a more complete understanding of EO, and has the potential to expedite the development of therapeutics for a range of skeletal conditions.
Acknowledgments
The authors gratefully acknowledge the financial support from Science Foundation Ireland (13/RC/2073).
Data availability statement
All data that support the findings of this study are included within the article (and any supplementary files).
Supplementary data (0.7 MB PDF)