

Abstract
The urothelium covers the inner surface of the urinary tract, forming a urinary tract barrier. Impairment of the integrity and dysfunction of the urinary tract barrier is associated with the occurrence and development of various diseases. The development of a three-dimensional model of the urothelium is critical for pathophysiological studies of this site, especially under physiological fluid shear stress stimulated by the urinary flow. In this study, a urothelium on-chip is fabricated with micromilling and replica molding techniques, which contains a microfluidic chip for cell culture and a pump-based fluid perfusion system. The mechanical properties of the human urinary tract are simulated by adjusting the concentration and degree of amino substitution of the gelatin methacrylate hydrogel. The matrix stiffness is similar to the natural urinary tract. Pulsatile flow and periodic flow are provided to simulate the fluid environment of the upper and lower urinary tracts, respectively. The results show that the physiological fluid shear stress could promote the differentiation and maturation of urothelial cells. The model could simulate the three-dimensional structure of urothelium and urinary flow microenvironment, showing morphological structure close to the natural urothelium, specific differentiation and maturation markers (uroplakin 2, cytokeratin 20), and urothelial barrier function.
Export citation and abstract BibTeX RIS

Original content from this work may be used under the terms of the Creative Commons Attribution 4.0 license. Any further distribution of this work must maintain attribution to the author(s) and the title of the work, journal citation and DOI.
Abbreviations
| 2D | Two-dimensional |
| 3D | Three-dimensional |
| ECM | Extracellular matrix |
| FSS | Fluid shear stress |
| PDMS | Polydimethylsiloxane |
| GelMA | Gelatin methacrylate |
| PBS | Phosphate buffered saline |
| DAS | Degrees of amino substitution |
| LAP | Photoinitiator phenyl-2meme 4 trimethylbenzoyl phosphite lithium |
| SEM | Scanning electron microscopy |
| H&E | Hematoxylin-eosin |
| qRT-PCR | Quantitative real time polymerase chain reaction |
| RNA-seq | RNA-Sequencing |
| DEGs | Differentially expressed genes |
| GO | Gene ontology |
| KEGG | Kyoto encyclopedia of genes and genomes |
| G30 | GelMA hydrogel with degrees of amino substitution of 30% |
| G60 | GelMA hydrogel with degrees of amino substitution of 60% |
| G90 | GelMA hydrogel with degrees of amino substitution of 90% |
| IHC | Immunohistochemistry |
| AR | Aspect ratio |
| CK 5 | Cytokeratin 5 |
| CK 20 | Cytokeratin 20 |
| GAG | Glycosaminoglycan |
| ZO-1 | Zonula occludens-1 |
1. Introduction
The urothelium is primarily transitional epithelium, which is widely distributed in the inner surface of the urinary tract, including renal pelvis, ureter, bladder, prostate and urethra [1]. Urothelium consists of 3–7 layers of urothelial cells, which can be divided into three layers, namely: the basal cell layer, intermediate cell layer, and superficial layer [2]. Functionally, it forms a barrier to the urinary system, forming an expandable tissue that can hold and store urine, while preventing uncontrolled material exchange between urine and the blood supply. The damage of urinary barrier integrity and dysfunction are related to the occurrence and development of a variety of diseases and lower urinary tract symptoms, such as urethral stricture, urothelial carcinoma, urinary tract infection and overactive bladder, seriously affecting the health and quality of life of patients [3].
Traditional studies of urinary diseases are based on cell culture and animal models, such as bladder pain syndrome/interstitial cystitis cell models [4] and urinary tract infection animal models [5]. These research methods are not sufficient to simulate the relatively real physiological or pathological microenvironment. The 2D cell culture model is simple and convenient, yet lacks a 3D microenvironment that simulates cell physiology in vivo, and does not allow for cells, ECM components and dynamic spatial interactions through biochemical, mechanical and structural stimulation [6]. The 3D cell culture model provides the matrix microenvironment of 3D cell culture, but cannot apply mechanical stimulation. At the same time, because the mechanical properties of ECM-like is different from those of the body, the 3D cell culture model has not been applied on a large scale. Although animal models can make up for the above shortcomings, their application is still limited by ethical problems, high prices, and limited representation of the human environment. Moreover, they are not suitable for monitoring and visualizing biological changes occurring within live organs in real-time. To overcome these shortcomings, there is an urgent need for a new research system to integrate the physical-biochemical microenvironment and better reproduce the in vivo environment of cells, so as to study the pathophysiology of urothelium and occurrence and development of diseases more deeply and comprehensively.
Microfluidic, also known as organ on-chip or microphysiological system, is a new research technology, which can integrate a variety of experimental operations into one chip [7]. It has the advantages of flexible design, easy real-time monitoring, high throughput, and low cost [8]. Compared with the macro model, microfluidics can realize multi-cell co-culture on the micro-scale and regulate the cell microenvironment in time and space to reconstruct the bionic environment [8]. Urinary flow is one of the unique microenvironments of the urinary system. Microfluidic can reproduce the key structural characteristics of the organization. Mechanical intervention can be applied to the cells through external equipment to realize the simulation of urinary flow environment. The flow of microfluids can excrete metabolites and eventually achieve long-term culture, while providing mechanical clues for cell growth and development. It can be combined with biomaterials such as hydrogel and acellular matrix for 3D cell culture. In this study, based on microfluidic technology, we constructed a urothelium on-chip, which can simulate the 3D structure and urinary flow microenvironment, and assessed the effect of FSS on the structure and function of the urothelium.
2. Materials and methods
2.1. Scheme of the experimental design
The natural urinary tract can be divided into upper (kidney, ureter) and lower urinary tracts (bladder and urethra). In this study, to better simulate the upper and lower urinary tract, we constructed urothelium on-chip models of upper urinary tract and urothelium on-chip models of lower urinary tract by imposing different flow patterns, respectively. The flow patterns of the upper urinary tract were set to pulse flow (unidirectional flow, continuous flow, peristaltic pump, rotational speed: 0.01–150.0 rpm min−1) and the lower urinary tract was set to periodic flow (unidirectional flow, 10 min every 4 h, achieved by syringe pump). The inner diameter of the silicone tube is 1 mm and the outer diameter is 3 mm. Pumps were controlled through programming that set the flow rate, perfusion time, pause time, and cycle time. Observation was conducted on days 1, 3, and 7 of stimulation.
2.2. Chip design and fabrication
The structure of microfluidic chip was designed using computer-aided design programs. The microfluidic device was made of PDMS (Dow Corning). The microstructure of the chip was fabricated using micromilling and replica molding techniques. The master plate was made of stainless steel. The prepared mold was placed into a petri dish, and mixed with PDMS and curing agent at a weight ratio of 10:1. The PDMS mixture was placed into a vacuum pump for degassing until there were no bubbles, and poured over stamps and cured overnight at 60 °C. The entrance of the upper microchannel was punched with a 15-gauge dedicated punch. It is worth noting that the chips were sterilized under high pressure thermal prior to use (121 °C, 30 min). Then treated with an oxygen plasma (Plasma Etch) for 30 s, and then the upper and lower PDMS channels were aligned and bonded under a microscope. The chips used for the 3D culture are slightly different. The surface of the microchannel was treated with plasma, then the hydrogel (the hydrogel was sterilized with a 0.22 µm filter prior to use) was injected into the lower microchannel. The upper and lower layers of the chip were bonded after the hydrogel has solidified. The bonding process needs to be completed within 5 min. GelMA hydrogel was crosslinked by ultraviolet light (365 nm, UtraFire) irradiation for 30 s.
2.3. Calculation of FSS
The urine flow in the urinary tract is a laminar flow pattern, and the urine is considered to be an incompressible Newtonian fluid. The viscosity of urine was 0.654 mPa s and the density was 1003 kg m−3 [9]. Previous study indicated that the urine flow-induced shear stress ranges from 0.2 to 2 dynes cm−2 at normal flow rate [10]. Therefore, in this study, we used the unidirectional and laminar flow model, and the urothelium model designed was a rectangular tube. The appropriate urine flow velocity (Q) is calculated according to the Navier–Stokes equations (1) and (2):
where τ is the FSS, Q is the volume flow of the fluid, μ is the viscosity of the fluid (0.0008 Pa s). h and w are the height and width of the channel above the cell, respectively.
At the same time, according to the relationship between volume flow and velocity in the microfluidic model:
where S is the cross-sectional area of the microfluidic channel and V is the entrance velocity of the channel.
2.4. COMSOL simulation
The fluid in microfluidic channel was simulated by finite element analysis software COMSOL Multiphysics 4.2a (COMSOL, Inc. Palo Alto, CA, USA). COMSOL was used to evaluate the velocity distribution in microfluidic channels and the FSS on cells at different flow rates. To simulate the velocity field in the microfluidic channel, we used a 2D asymmetric laminar single-phase fluid flow interface and set the liquid to water. At the same time, the fluid was considered to be incompressible and stable, and there was no slip on the wall of the microchannel.
2.5. Cell culture and digestion
Human urothelial cell line (SV-HUC-1) was purchased from Binsui Biotechnology Co., Ltd The complete medium (89% DMEM + 10% fetal bovine serum + 1% penicillin/streptomycin) was cultured in a 37 °C incubator of 5% CO2. Digest and passage when the cells reach a fusion degree of about 80%. The medium was discarded, washed with PBS (Gibco), digested with 0.25% trypsin-EDTA (Gibco) at 37 °C for 3 min, and then terminated with complete medium. The cell suspension was collected and centrifuged, and the supernatant was discarded and resuscitated with fresh culture medium to prepare cell suspension.
2.6. Cell planting and culture in microfluidic chips
PDMS is a hydrophobic material. To promote cell adhesion in microchannels, the inner surfaces of all microchannels were incubated with fibronectin (Roche, Switzerland) solution of 25 µg ml−1 for 12 h after sterilization. The control group was static culture, and the culture medium was changed once a day. The experimental group (periodic and pulsed flow) was perfused culture. The liquid transfer device was used to inject 1 × 10⁶ cell suspension into the microchannel through the entrance, which was cultured overnight in an incubator; nonadherent cells were removed, and a fresh culture medium was added. The perfusion experiments were performed by attaching the tubing to the chip 9 h post seeding. The experimental and the control groups were observed and collected on days 1, 3, and 7.
2.7. Immunofluorescence
Use PBS to flush the microchannel. Urothelial cells in the microfluidic channel were fixed with 4% paraformaldehyde (Servicebio) for 15 min. Wash 3 times with PBS for 3 min each time. Then cells were permeabilized using 0.1% Triton X-100 (Servicebio) solution for 10 min, followed by blocking solution containing 5% bovine serum albumin (Thermo) in Dulbecco's phosphate buffered saline (DPBS) and washed again with PBS for 3 min each time. The fixed cells were incubated with primary antibodies (1:100) at 4 °C overnight. After being washed with PBS for 3 times for 3 min, the secondary antibodies (1:500) coupled with Alexa-594 or-488 were incubated at room temperature for 2 h. The nuclei were stained with DAPI (KeyGEN Biotech, KGA215) and incubated at room temperature for 20 min. Use a confocal microscope (Leica) to take pictures. Using Image J software (NIH, Version 1.51a) to analyze fluorescence image. The primary antibodies used included Zonula occludens-1 (ZO-1, Proteintech, 21773), uroplakin 2 (Proteintech, 21149), AE1/AE3 (Invitrogen, 53900382) and F-actin (Yeasen biotechnology, 40734ES75).
2.8. Histology
The attached cell hydrogel was fixed at room temperature with 4% paraformaldehyde for 12 h. It was then embedded in paraffin and sliced in the middle of the sample with a thickness of 5 μm. The sections were stained with H&E. Antibodies used in this study are CK 5 (Abcam, ab64081), CK 20 (Abcam, ab76126), and P63 (Abcam, ab124762).
2.9. GelMA hydrogel preparation
Gelatin methacryloyl (GelMA, DAS:30%, 60%, and 90%) and LAP for synthesis of GelMA hydrogel were purchased from Engineering for Life (Suzhou, China). Briefly, LAP was combined with the corresponding PBS solution making a concentration of 0.25%. The solution was heated in a 45 °C water bath for 15 min while shaking. The corresponding mass of GelMA was added to the preheated LAP solution and then heated in a 65 °C water bath for 30 min while stirring until GelMA was completely dissolved. GelMA solutions with different concentrations and DAS were then prepared.
2.10. SEM
The samples on days 1, 3, and 7 were fixed for 24 h with 4% paraformaldehyde. Discard the fixed solution and rinse the sample with PBS for 3 min each time. It is then gradient dehydrated with ethanol (30%, 50%, 70%, 90% and 95%), each concentration in turn for 10 min. Finally, dehydrate with 100% ethanol twice for 10 min each time. After the samples were frozen overnight at −80°, freeze-drying was carried out by using a freeze dryer. The freeze-dried samples were sputtered and plated and observed by SEM (ZEISS Gemini 300).
2.11. Material characterization
2.11.1. Swelling and degradation of hydrogels
To measure the equilibrium swelling of hydrogels, the hydrogels with different concentrations and DAS after photocrosslinking were soaked in PBS (pH = 7.4) at 37 °C for 24 h until the swelling equilibrium was reached.
After removing it and wiping off the excess moisture with filter paper, the weight was recorded as swelling mass (Wp) and was freeze-dried at −50 °C, and its dry weight (W0) was determined. The equilibrium swelling ratio (SR) is calculated according to equation (3):
In addition, the freeze-dried hydrogel was soaked in PBS (n = 3) at 37 °C for 1, 3, and 7 days, respectively. The samples were taken out and freeze-dried at each time point, and the dry weight Wj was determined. The mass loss rate (ML) was calculated as follows:
2.11.2. Mechanical properties
The mechanical stiffness of hydrogel was determined via compression tests. The heated hydrogel was injected into a polytetrafluoroethylene mold with a diameter of 10 mm and a height of 10 mm, and 365 nm was irradiated with ultraviolet light for 30 s to crosslink it. The cured hydrogel cylinder was compressed to 40% at the compression rate of 5 mm min−1 using an instron instrument. The elastic modulus was calculated from the linear slope of the stress–strain curve. Three experiments were conducted for each sample.
2.11.3. Biocompatibility
To evaluate the biocompatibility of hydrogels, LIVE/DEAD ®cell viability kits (Invitrogen) were used for live/dead staining on days 1, 3, and 7, respectively, according to the manufacturer's instructions. Simply put, urothelium microfluidic chips were treated proportionally with calcein acetoxymethyl ester (Calcein AM) (green) and propidium iodide (red) in PBS at 1:3, and then incubated 15 min at 37 °C. After washing with PBS, the samples were photographed with Nikon inverted fluorescence microscope. Image J software was used to calculate living cells and dead cells. Finally, cell viability was expressed as a percentage of the total number of living cells.
2.12. Extraction and quantification of total RNA
According to the manufacturer's suggestion, the total RNA was extracted using RNeasy Mini kit (Invitrogen). One percent agarose gel and Agilent 5400 were used to evaluate the quality. The concentration and integrity of RNA were detected by Nanodrop spectrophotometer (Thermo Scientific) and Agilent 5400 Bioanalyzer.
2.13. qRT-PCR analysis
Cells were treated according to the experimental group for seven days (2D static, 3D static, Pe-4, Pu-4 group). The total RNA of urothelial cells was extracted with TRIZOL reagent (Invitrogen). About 10 mM dNTPmixture (TaKaRa) was used to complete reverse transcription to cDNA. Using SYBR Premix Ex TaqTM II (TaKaRa) and Applied Biosystems real-time PCR system (Applied Biosystems) for qRT-PCR. The cycle condition of PCR is 95 °C cycle 3 min, then 40 cycles, including 95 °C cycle 30 s, then 60 °C cycle 30 s. The forward and reverse primer sequences of uroplakin 2, E-Cadherin, GAG, ZO-1, cytokeratin 20 (CK20) are listed in table S2. The expression level of mRNA was quantified with β-actin as internal control. The threshold cycle method is used to calculate the cyclic quantization value. The multiple change of gene expression was calculated by 2−ΔΔCT method. All the samples were set up with three repeated experiments.
2.14. RNA-sequencing (RNA-seq)
The total RNA of cells in 2D static, 3D static, Pe-4, and Pu-4 group were isolated and extracted on day 7. Agilent 2100 bioanalyzer (Agilent Technologies, Palo Alto, CA, USA) and Qubit2.0 Fluorometer (Life Technologies) were used to quantify and identify RNA. RNA was subjected to ribosomal RNA removal, reverse transcription synthesis of double-stranded cDNA, cDNA terminal repair and cDNA plus junction treatment. According to the manufacturer's plan, the cDNA libraries of the above four groups were constructed using KAPA RNA HyperPrep kit and RiboErase (Kapa Biosystems, Wilmington, MA, USA), respectively, and RNA-seq transcriptome analysis was carried out on Illumina HiSeqTM 4000 sequencing platform. The sequencing data raw data of each sample was processed by fastp software [11], and the Clean reads is obtained, and the Q30 value and guanine and cytosine (GC) content (%) are calculated. Three independent biological replicates were set up in the control group and each experimental group, with a total of 12 samples, expressed as 2D-static 1, 2D-static 2, 2D-static 3, 3D-static 1, 3D-static 2, 3D-static 3, Pe-4-1, Pe-4-2, Pe-4-3, Pu-4-1, Pu-4-2 and Pu-4-3.
2.15. Water permeability of urothelium on-chip
To examine the water permeability of urothelium on-chip, PBS solution containing Allura red dye (496.42 Da, Lot # MKBT6061V) was injected into the microfluidic channel and placed in a 37 °C incubator. The red solution was removed at different points (1, 10, and 30 min), rinsed with PBS, and placed under an inverted microscope (Olympus) to observe and image. Image J software was used to calculate the gray value based on the color depth. The lower the gray value, the darker the color. The control group was the blank group, while the experimental group was hydrogel, 3D static, upper urinary tract, and lower urinary tract groups.
2.16. Bioinformatics analysis
We used the HISAT2 software to align the quality-controlled clean data reads to the reference genome [12]. Based on comments from GENCODE version 30, the featureCounts software was used to calculate genes count [13]. The Galaxy platform (www.bioincloud.tech/) was used to analyze the DEGs expression. Based on the results of difference analysis, the genes with false discovery rate (FDR) < 0.05 and |log2FoldChange| > 1 were listed as significantly DEGs. R language clusterProfiler package was used for GO and KEGG enrichment analysis [14]. The interaction network analysis of proteins encoded by DEGs was carried out by using the interaction option in STRING protein interaction database [15].
2.17. Statistical analysis
For statistical analysis, GraphPad InStat software (GraphPad Software Inc. San Diego, CA, USA) was used for one-way ANOVA analysis. All data were expressed as mean± standard error, and when p < 0.05, the difference between groups was considered to be statistically significant.
3. Results and discussion
3.1. Urothelium on-chip design and simulation
The designed urothelium on-chip consisted of a microfluidic chip for cell culture, a control system based on a syringe pump/peristaltic pump, and a corresponding perfusion system of polytetrafluoroethylene tube/silicone tube. The microfluidic part was composed of four integrated microchannels (1000 μm × 1000 μm × 15 mm) to meet the application of various flow rates. The inlet of the microchannel was connected to the syringe through a polytetrafluoroethylene pipe/silicone tube, and the outlet was connected to the waste liquid collection device through the polytetrafluoroethylene pipe (figure 1).

Figure 1. Construction of urothelium on-chips culture platform. (A) Design (a) and manufacture (b) of urothelium on-chips; Pattern diagram of the urothelium on-chips (c); (B) Schematic representation of the culture and perfusion platform of the urothelium on-chips (e); The verification of urothelium on-chips (e). (C) Contact angle of plasma treated (a) and untreated (b) PDMS surfaces; According to the standard equation for fluid shear stress (FSS) in rectangular microchannel, the average FSS τ is calculated (c). (D) Results of COMSOL simulation at different flow rates and flow patterns in the channel. Velocity (a) and FSS (b) and (c) distribution by COMSOL in urothelium on-chips.
Download figure:
Standard image High-resolution imageThe microchannel surface was hydrophilic after plasma treatment (figure 1(C)). The FSS generated in the channel depends on the velocity (figure 1(C-a)). To evaluate the velocity distribution and FSS in microfluidic channels under different flow rates (4, 40, and 80 µl min−1) and flow patterns (periodic and pulsed), computer simulations were carried out using the MEMS simulation module of COMSOL Multiphysics software. The simulation results showed that the urothelium on-chip model designed in this study has stable velocity distribution under different flow rates and flow patterns. In the microchannel, the fluid distributes parallel to the channel wall, and the velocity distribution was stable (figure 1(D-a)). The flow rate is highest in the middle of the microchannel and decreased in both sides. In addition, to determine the FSS in each region of the microchannel, the distribution of this parameter was simulated (figure 1(D-b)). The highest FSS occurred at the outlet of the microchannel. The FSS in the channel decreased from the middle to both sides, while the lowest FSS occurred in the center of the channel, which was 4–5.5 times lower than that of the inlet and outlet. With the increase of flow rate, the FSS increases accordingly.
The corresponding FSS at 4 µl min−1 flow rate is the physiological parameter of the cell. To observe the effect of different intensity flow rates on cells, we selected 4 µl min−1, 40 µl min−1, and 80 µl min−1 perfusion rates to apply to urothelial cells, which represent low flow rate, medium flow rate, and high flow rate. According to equations (1) and (2), the FSS applied to cultured cells was calculated to be 0.2, 2, and 4 dyn cm−2, respectively.
3.2. Properties of hydrogels
In urothelium on-chips, hydrogel plays the role of ECM. In this study, nine kinds of GelMA hydrogels were prepared according to the DAS and polymer concentration, which are 5% G30, 10% G30, 15% G30, 5% G60, 10% G60, 15% G60, 5% G90, 10% G90, and 15% G90 (a% Gb indicates that the DAS of GelMA is b%, and the concentration is a% (w/v). The matrix stiffness of hydrogel increased with the increase of concentration and DAS, and there were statistical differences among the groups (p < 0.05). Five percent G30 was too soft to be measured, while the matrix stiffness of 5% G60 can be up to 2.11 ± 1.13 kPa. Fifteen percent G90 is the hardest hydrogel (matrix stiffness can reach 78.5 ± 0.48 kPa). In particular, the matrix stiffness of 15% G60 and 15% G90 hydrogels is close to that of the rabbit bladder matrix (56.57–68.48 kPa) (figure 2).
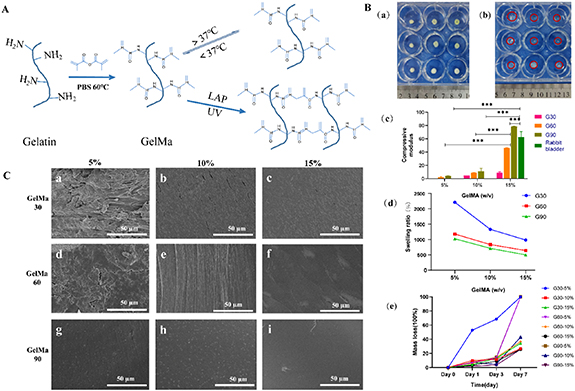
Figure 2. Morphology and properties of methacrylate Gelatin (GelMA). (A) Schematic diagram of synthesis and crosslinking of GelMA hydrogels. (B) Equilibrium swelling and degradability of GelMA hydrogels. (a) Dried hydrogel morphology. (b) Hydrogel morphology after equilibrium swelling (The red circle is the outline of the hydrogel). (c) Matrix stiffness, (d) degradability, and (e) equilibrium swelling of GelMA hydrogels with different concentrations and degrees of amino substitution in the wet state. *p < 0.05, **p < 0.01, ***p < 0.001; n = 3. (C) Surface morphologies of GelMA hydrogels with different concentrations and degrees of amino substitution were observed using scanning electron microscopy.
Download figure:
Standard image High-resolution imageThe swelling and degradation experiments of hydrogels showed that with the increase of concentration and DAS, the swelling ratio and degradability of the hydrogels gradually decreased (figure 2(B)). Among them, the hydrogel swelling of 5% G30 was the highest (up to 22.1 times) and degraded the fastest (68.5% in 3 d). The hydrogel swelling of 15% G90 was only 5 times, while the degradation rate was 25.6% in seven days. The above results showed that the mechanical and degradation properties of GelMA hydrogels can be easily adjusted to meet the experimental requirements by changing the concentration and the DAS of GelMA. SEM results showed that the hydrogel surface was rough at low concentrations and DAS, and the surface gradually became smooth with the increase of the concentration and DAS (figure 2(C)).
3.3. Cell viability, adhesion, and proliferation in static culture
At low concentrations, the cells adhered less and aggregated in clumps. With the increase of hydrogel concentration and DAS, the adherence rate of cells gradually increased, and the cell morphology was island-like or block-like (figure S1(A)). However, at high concentrations, cell differentiation was inhibited and the cells appeared round. There was no significant difference in the viability of various types of hydrogels, and cell live/dead staining showed a viability of approximately 90% (figures S1(B) and (C)).
This indicates that GelMA has good biocompatibility, and the hydrogel with hard matrix stiffness is more conducive to cell adhesion. In particular, the matrix stiffness of the 15% G60 and 15% G90 hydrogels is close to that of the natural rabbit bladder matrix [16]. Combined with the results of cell differentiation and viability, we determined that the 15% G60 hydrogel with moderate matrix stiffness and smooth surface morphology could be used for the construction of ECM in the urothelium on-chip.
3.4. Urothelium on-chip model of upper urinary tract
3.4.1. The morphology of cells
In urothelium on-chip model, when the 2D static culture was performed, the cells were well differentiated and arranged disorderly. The morphology was island-like or sheet-like. Under the condition of 2D culture, the cells reached the state of fusion after one day, and the cell proliferation rate decreased. Compared with the control group, cells continued to proliferate and the cell density increased under physiological FSS, which indicated that the low flow rate could promote cell proliferation (figures S2(A)–(D)).
The medium and high flow rate fluid had a scouring effect on cells, and with an increase in the flow rate, the FSS increased accordingly, the cell proliferation rate gradually reduced, and cell extension and proliferation were inhibited, showing a round shape (figure S2(A)). This indicates that larger FSS has a damaging effect on the cells. Due to fluid erosion, dead cells and metabolites can be excreted on time. Cell live/dead staining showed a cell viability of >85% at different flow rates (figures S2(C) and (D)).
The application of fluid changed the cell morphology and arrangement. At different flow rates, the angle of the cell and fluid direction, cell aspect ratio (AR), and cell circularity were different (figure S2(E)). The results showed that, as the flow rate increases, the AR distribution of cells gradually became organized from the disordered state at the initial stage of stimulation, and the AR value gradually reached '1' (figures S3–S6). The cell circularity gradually approached '1', showing a quasi-round shape. In the natural human environment, the urothelium is constantly exposed to the mechanical stimuli of the urinary stream, which affects the morphology, differentiation, and phenotype of cells.
3.4.2. Immunofluorescence results
To further characterize the effect of FSS on urothelial cells' cytoskeleton and function, urothelium on-chip in different culture periods was stained for cytoskeleton and epithelial barrier markers and observed using a confocal microscope. The results showed that the immunostaining of uroplakin 2 was weak under 2D static conditions, but under dynamic conditions, uroplakin 2 was continuously arranged around the cells, enhanced (figures 3(A)–(C)). Among them, the expression of uroplakin 2 in medium and high flow rates was higher than that in low flow rate in different culture times; with the extension of culture time, the expression of uroplakin 2 in each group increased continuously, and the enhancement of uroplakin 2 was the fastest at a low flow rate. The dynamic fluid environment can promote the maturation of urothelial cells. In static 2D culture, the expression of F-actin was very weak, while the expression in dynamic culture was obvious, and gathered to the periphery of the cells, resulting in obvious rearrangement (figures 3(A)–(C)).
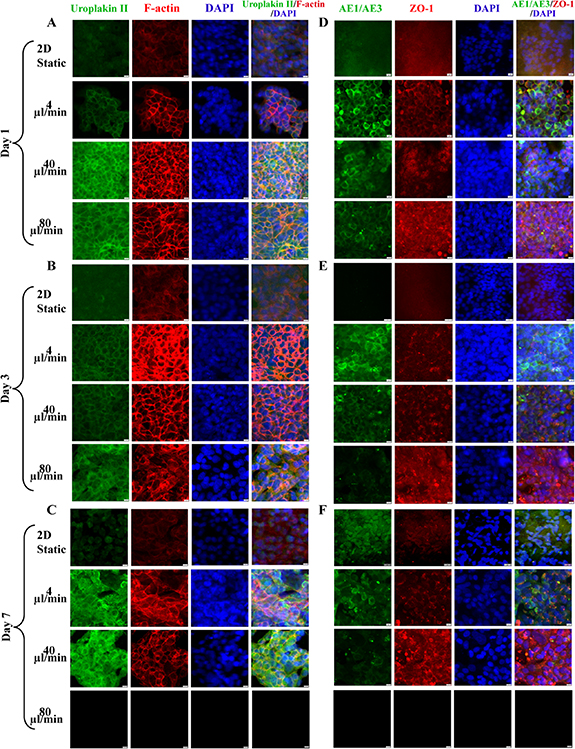
Figure 3. Immunofluorescence images of epithelialization and barrier function of urothelium on-chip in upper urinary tract. Confocal images of uroplakin2 (green) and F-actin (red) in urinary tract epithelial cells at days 1 (A), 3 (B) and 7 (C) at different flow rates (nuclei in blue); confocal images of AE1/AE3 (green) and ZO-1 (red) in urothelial cells at days 1 (D), 3 (E) and 7 (F) at different flow rates (nuclei in blue). Scale bar = 200 μm.
Download figure:
Standard image High-resolution imageZO-1 did not exist in 2D static conditions, but expressed positively in dynamic culture, forming a complete intercellular junction with a continuous linear arrangement (figures 3(B)–(F)). Although, at the initial stage of culture, the expression of ZO-1 at low flow rate was lower than that at the medium and high flow rate, the boundary around the cell was clearer, and the expression of ZO-1 increased with the increase of flow rate, and the distribution extended to the whole cell membrane. At the same time, at medium and high flow rates, the low proliferation rate of cells led to discontinuous urothelial cells, especially at high flow rates; no urothelial cells were observed in the visual field. After 24 h of culture, AE1/AE3 did not exist in the 2D static condition, while the expression gradually increased with the extension of culture time. While in dynamic culture, the expression of AE1/AE3 was the strongest under physiological FSS, which was higher than that of medium and high flow rates.
3.4.3. Histological results
Under continuous pulsed flow, the urothelial cells showed a monolayer or double-layer structure on the first day under static and dynamic conditions (figure 4(A)). Although the urothelium was continuous and the thickness of the epithelium was increasing, the number of cell layers of the urothelium did not increase (figure 4(B)). The urothelium thickness was 9.542 ± 1.30, 9.83 ± 1.12 and 12.24 ± 1.69 μm on days 1, 3 and 7, respectively. Although there is a lack of human physiological data, it is similar to the urothelium thickness in rats [17]. At medium and high flow rates, the cells proliferated during the initial three days, but in the later stage, with the continuous application of fluid, the cell proliferation was inhibited and gradually fell off, and the urothelial cells were discontinuous. Especially at a high flow rate, urothelial cells were unable to adhere to the wall.
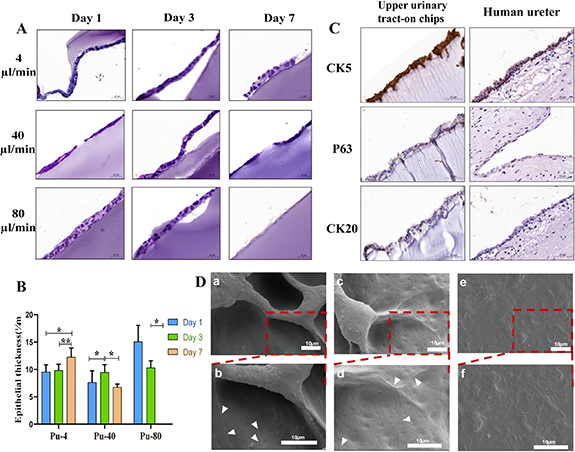
Figure 4. Histology and ultrastructure of urothelium on-chips in upper urinary tract. (A) H&E staining of the urothelium at days 1, 3 and 7 after urothelial cells seeding under different flow rates. Cross-sections of urothelium showing extracellular matrix composed of GelMA hydrogel (blue) on which urothelial cells (purple) lie (×20). (B) Thickness of urothelium (Pu-4: 4 μl min−1 pulse flow; Pu-40: 40 μl min−1 pulse flow; Pu-80: 80 μl min−1 pulse flow). (C) IHC analysis of urothelium on-chips and human ureter (specimen from a patient with hydronephrosis) for CK 5, P63, and CK 20 as indicated. (Scale bars, 50 μm). (D) Scanning electron microscopy micrographs (a) and (c) and (e) and partial magnifications (b) and (d) and (f) of the surface of urothelial cells in the urothelium on-chip under dynamic culture on day 7. Arrows show cell boundaries and tight junctions. Scale bar = 10 μm. *p < 0.05, **p < 0.01, ***p < 0.001; n = 3.
Download figure:
Standard image High-resolution imageNext, we performed IHC to determine the cellular composition of the uroepithelial on-chips. Using antibodies to basal (CK 5), intermediate (P63), and umbrella (CK 20) cell markers, we observed that cells under dynamic conditions displayed a mature stratified cell layer with basal, intermediate, and superficial cells similar to natural uroepithelial cells (figure 4(C)).
3.4.4. Micromorphology under SEM
The SEM results showed that in 2D static culture, the morphology of urothelial cells was not typical and hence difficult to distinguish, while after seven days of stimulation at low and medium flow rates, the morphology of urothelial cells was clear, and cell boundaries and tight junctions appeared between cells (figure 4(D)). At a high flow rate, the urothelial layer failed to form due to the scouring effect of the fluid.
3.5. Urothelium on-chip model of lower urinary tract
3.5.1. The morphology of cells
For the lower urinary tract simulations, cell viability exceeded 90% under periodic flow (figures S7(A)–(C)). Among them, the cell viability of static 3D culture and the low flow rate was as high as 95%. In static culture, urothelial cells proliferated rapidly. At the initial stage of dynamic culture, the number of cells decreased regardless of the flow rate, which may be due to the scouring effect of fluid. Under physiological FSS, the number of cells increased gradually with the extension of culture time (figure S7(D)). However, the cell proliferation rate decreased at medium and high flow rates, and continuous urothelium could not be formed. The number of cells at a low flow rate was higher than that at the middle and high flow rates, which was not significantly different from that of static culture (p > 0.05).
There were differences in the angle between the cell and the fluid direction, the AR, and the circularity of the cell. This result was similar to that of the upper urinary tract. The angle distribution map showed that at a low flow rate, the angle between the cell's long axis and fluid direction gradually increased with the extension of culture time (figure S6(E)). While at the medium and high flow rates, the cell differentiated and extended along the flow direction with the extension of culture time (figures S8–S10). The angle gradually decreased. At medium flow rate, the cells were polygonal on day 1, and some of them showed long shuttle shapes. As the culture time increased, the cells started to retract from a long shuttle shape to a short shuttle shape on day 3, and the cell roundness increased, at which time the cell density decreased and some cells started to be shed; on the day 7, the cell circularity gradually approached to '1' and the cell area decreased (figure S11), at which time the cells appeared to flocculate and shed. At high flow rate, the cells appeared flocculent shedding on day 3.
3.5.2. Immunofluorescence results
Immunofluorescence showed that under the action of periodic fluid, the simulated urinary flow microenvironment could significantly change the distribution of the cytoskeleton in the lower urinary tract model constructed in this study. At the initial stage of dynamic culture, there was little difference in cytoskeleton expression among different flow rates; with the enhancement of culture time and fluid, especially at medium and high flow rates, the cytoskeleton (F-actin) was significantly rearranged and the boundary between cells was messy compared with the static state. Even at medium and high flow rates, the cells fell off and the urothelium coverage decreased (figures 5(A)–(C)).
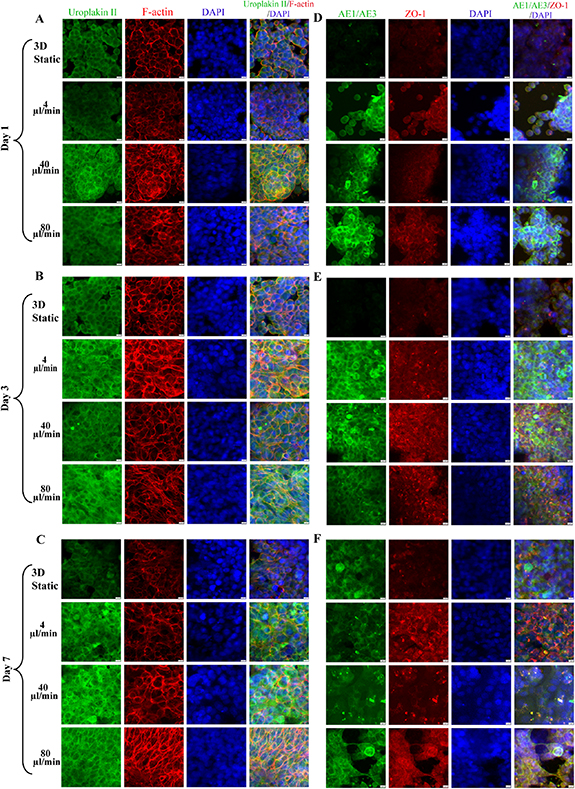
Figure 5. Immunofluorescence images of epithelialization and barrier function of urothelium on-chip in lower urinary tract. Confocal images of Uroplakin2 (green) and F-actin (red) in urinary tract epithelial cells at days 1 (A), 3 (B) and 7 (C) at different flow rates (nuclei in blue); Confocal images of AE1/AE3 (green) and ZO-1 (red) in urinary tract epithelial cells at days 1 (D), 3 (E) and 7 (F) at different flow rates (nuclei in blue). Scale bar = 200 μm.
Download figure:
Standard image High-resolution imageUnder 3D static and dynamic conditions, uroplakin 2 showed positive staining, but the expression in dynamic culture was stronger than that in static culture, and uroplakin 2 was arranged continuously around the cells. In terms of time effect, with the prolongation of stimulation and the increase of stimulation intensity, the expression of uroplakin 2 was gradually strengthened. ZO-1 and AE1/AE3 were weak in 3D static conditions, but strongly expressed in dynamic culture (figures 5(D)–(F)). In static culture, ZO-1 was incomplete, but under physiological FSS, ZO-1 was more complete and the boundary between cells was clear. With the increase of flow rate, a dot-like accumulation of ZO-1 expression between cells was also observed, especially after seven days of physiological FSS.
3.5.3. Histological results
H&E staining images showed that the urothelial cells were stratified and flattened (figure 6(A)). Under the stimulation of static and periodic flow, the urothelial cells showed a monolayer or double-layer structure on the first day. With the extension of culture time, the thickness of urothelium gradually increased (p < 0.05). Under physiological FSS, the number of cell layers also gradually increased with the extension of culture time. After 1, 3, and 7 days, the urothelium thickness was approximately 19.54 ± 3.47, 20.07 ± 2.06 and 35.02 ± 6.67 μm (figure 6(B)). On the day 7, the number of urothelial cell layers was significantly higher than that of static culture. At medium and high flow rates, the cells exhibited a proliferative state for the first three days. However, with the continuous application of fluid in the later period, cell proliferation was inhibited, and the thickness of the urothelium decreased (p < 0.05). At this time, the urothelial cells were clustered and the urothelium was discontinuous. IHC results were similar to those of the upper urinary tract, and mature stratified cell layers were also observed, with basal, intermediate, and superficial cells, similar to the natural urothelium. H&E staining showed that the thickness of the hydrogel gradually decreased with increasing culture time. The hydrogel structure remained largely intact after seven days of culture. The hydrogel showed uneven degradation inside. At medium to high flow rates, no cells were observed on day 14 (figure S12).
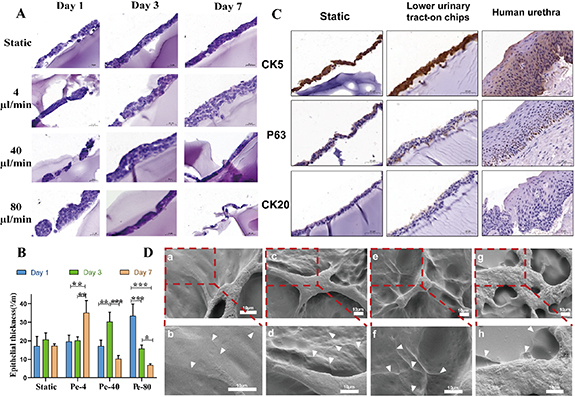
Figure 6. Histology and ultrastructure of urothelium on-chip in lower urinary tract. (A) H&E staining of the urothelium at days 1, 3 and 7 after urothelial cells seeding under different flow rates. Cross-sections of urothelium showing extracellular matrix composed of GelMA hydrogel (blue) on which urothelial cells (purple) lie. Scale: 50 μm (×20). (B) Thickness of urothelium (Pe-4: 4 μl min−1 periodic flow; Pe-40: 40 μl min−1 periodic flow; Pe-80: 80 μl min−1 periodic flow). (C) IHC analysis of urothelium on-chips and human urethra (specimen from a patient with urethral stricture) for CK 5, P63, and CK 20 as indicated. (Scale bars, 50 μm). (D) Scanning electron microscopy micrographs (a) and (c) and (e) and partial magnifications (b) and (d) and (f) of the surface of urothelial cells in the urothelium on-chip under dynamic culture on day 7. Arrows show tight junctions. Scale bar = 200 μm. *p < 0.05, **p < 0.01, ***p < 0.001; n = 3.
Download figure:
Standard image High-resolution image3.5.4. Micromorphology under SEM
SEM results showed that after urothelial cells were stimulated at different flow rates for seven days, the cell morphology was clear, with recognizable cell boundaries and tight junctions between cells (figure 6(D)). This is similar to the results in the upper urinary tract model. Notably, although tight junctions were also present under static conditions, expression was relatively weak. Compared with reports in other literature, the expression of intercellular junctions in this study is relatively early [18].
3.6. Transcriptomic profiling of the urothelium on-chip
An average of 45 million reads were sequenced per sample, and the average Q30 scores were all over 90.0% (table S1). According to the quality control indicators, the RNA integrity numbers of all samples were between 8.4 and 10.0. The average GC content of the 12 sequencing samples was approximately 50%, while the base content tended to be average. The 3ʹ deviation was approximately 50%, while the 5ʹ deviation 80%. There as a good correlation between samples (figure S13).
To explore the effects of the 3D environment, flow and flow pattern on gene expression in urothelial cells, we compare them respectively (2D-static and 3D-static; 3D-static and pulse flow group; 3D-static and periodic flow group; periodic flow group and pulse flow group).
In the 2D-static and 3D-static group, the volcano plot (figure 7(A)) showed that a total of 2836 genes had statistical differences, of which 1733 genes were significantly upregulated and 1103 were downregulated. To gain insight into the biological processes affected by the 3D environment, we analyzed DEGs with GO functional annotation. The results showed that the apical plasma membrane, ECM, epithelial cell proliferation, cell-cell/matrix interaction, and cell adhesion molecules were significantly expressed. The KEGG signaling pathway enrichment analysis (figure 7(B)) showed that DEGs were enriched in 88 signaling pathways, among which the genes of FSS, cell adhesion molecules, and ECM-receptor interaction were enriched. The heatmap (figure 7(C)) revealed significantly expressed genes; we observed significant expression of genes for cell adhesion molecules (PCDH18, PCDH7, ITGB6, CDH16, DSC2, and ICAM2), ECM (MMP13, FGF1, COL4A5, and TIMP3), and intercellular junctions (DSG1, DSC3, PCDH12, ITGA5, and CLDN4).
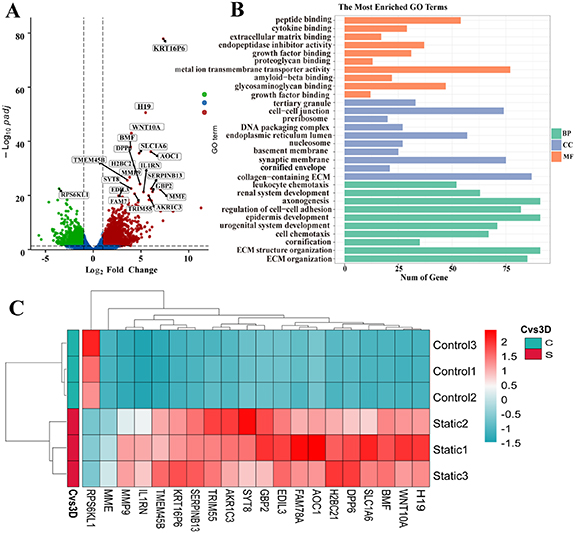
Figure 7. RNA-seq analysis results of two-dimensional and three-dimensional groups in static culture. (A) Volcano plots showing all differentially expressed genes between 2D static culture group and 3D static culture group, with the left (blue) and right sides (red) presenting downregulated and upregulated genes, respectively. (|log 2 (FoldChange)| > 1, p < 0.05); (B) Gene ontology (GO) term enrichment analysis depicting upregulated DEGs associated with the cellular compartment, molecular function, and biological processes, respectively. (C) Heat map showing 20 differentially expressed genes related to the structure and function of urothelial cells in each group, with the upregulated and downregulated genes were red and green respectively.
Download figure:
Standard image High-resolution imageIn 3D-static and pulse flow group, a total of 1643 genes were statistically different, of which 937 genes were significantly upregulated and 706 were downregulated (figure 8(A)). GO functional annotation analysis of DEGs showed that epithelial cell differentiation, cell cycle, ion transport, and growth factor were significantly enriched (figure 8(B)). The results of the KEGG signal pathway enrichment analysis (figure 8(C)) showed that DEGs were enriched into 40 signal pathways, including ribosome, IL-17, and inflammatory response. The effects of pulsed flow on cells are mainly reflected in cell responses to mechanical stimulation (TMEM150C, BMP6), cell morphology (ADAM8, NRG1, GREM1), cell differentiation (BDH2, KRT family, and FGFR2), and cell adhesion (COL6A5, ITGAL, and PCDH19) related genes.
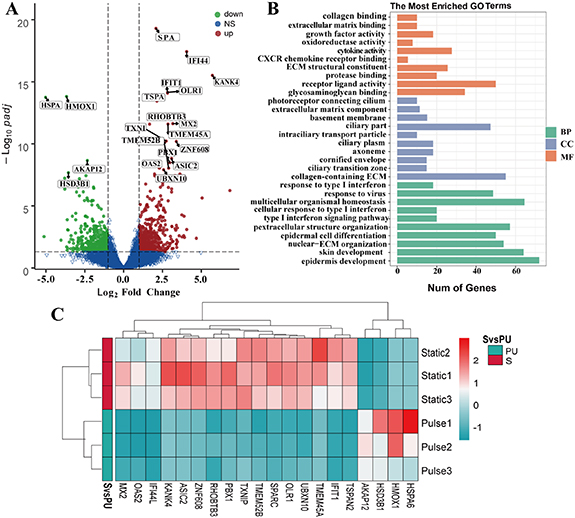
Figure 8. RNA-seq analysis results of three-dimensional static groups and pulse flow groups in static culture. (A) Volcano plots showing all differentially expressed genes, with the left (blue) and right sides (red) presenting downregulated and upregulated genes, respectively. (|log 2 (FoldChange)| > 1, p < 0.05); (B) Gene ontology (GO) term enrichment analysis depicting upregulated DEGs associated with the cellular compartment, molecular function, and biological processes, respectively. (C) Heat map showing 20 differentially expressed genes related to the structure and function of urothelial cells in each group, with the upregulated and downregulated genes were red and green respectively.
Download figure:
Standard image High-resolution imageIn 3D-static and periodic flow group, a total of 735 genes were statistically different, of which 443 genes were significantly upregulated and 292 were downregulated (figure 9(A)). GO functional annotation analysis of DEGs showed that cell chemotaxis, epithelial cell differentiation, and calcium transport were significantly enriched. The results of the KEGG signal pathway enrichment analysis (figure 9(B)) showed that DEGs were enriched into 60 signal pathways, of which genes such as the calcium signaling pathway, ECM-receptor interaction, and focal adhesion pathway were enriched. Among them, periodic flow can promote cell adhesion (ITGB3, COL4A6) and ion transport (ATP2B1), cell differentiation (SPATA13, FGF5, and SMOC1), cell maturation and growth (AXL) related gene enrichment (figure 9(C)).
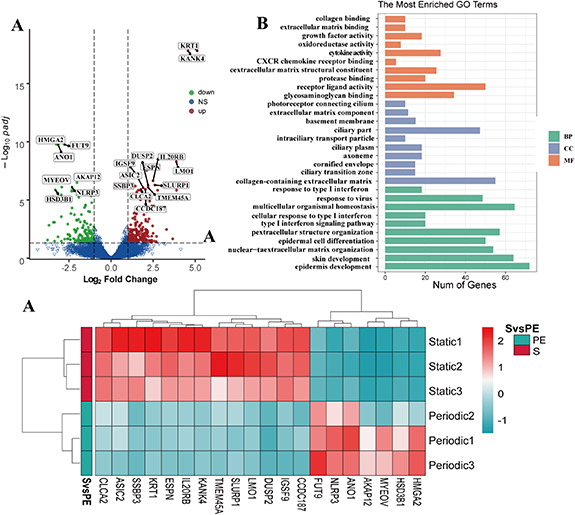
Figure 9. RNA-seq analysis results of periodic flow groups and three-dimensional static groups. (A) Volcano plots showing all differentially expressed genes between periodic flow groups and three-dimensional static groups, with the left (blue) and right sides (red) presenting downregulated and upregulated genes, respectively. (|log 2 (FoldChange)| > 1, p < 0.05). (B) Gene ontology (GO) term enrichment analysis depicting upregulated DEGs associated with the cellular compartment, molecular function, and biological processes, respectively. (C) Heat map showing 20 differentially expressed genes related to the structure and function of urothelial cells in each group, with the upregulated and downregulated genes were red and green respectively.
Download figure:
Standard image High-resolution imageIn periodic flow group and pulse flow group, a total of 934 genes were statistically different, of which 463 genes were significantly upregulated and 471 were downregulated (figure 10(A)). GO functional annotation analysis (figure 10(B)) of DEGs showed that cilium, chemokine-mediated signaling pathway, cell surface, external side of plasma membrane, and excretion were significantly enriched. The results of the KEGG signal pathway enrichment analysis (figure 10(C)) showed that DEGs were enriched into 65 signal pathways, of which genes of the JAK-STAT signaling pathway and cytokine-cytokine receptor interaction pathways were enriched.

Figure 10. RNA-seq analysis results of periodic and pulsed flow groups. (A) Volcano plots showing all differentially expressed genes between periodic and pulsed culture groups, with the left (blue) and right sides (red) presenting downregulated and upregulated genes, respectively. (|log 2 (FoldChange)| > 1, p < 0.05). (B) Gene ontology (GO) term enrichment analysis depicting upregulated DEGs associated with the cellular compartment, molecular function, and biological processes, respectively. (C) Heat map showing 20 differentially expressed genes related to the structure and function of urothelial cells in each group, with the upregulated and downregulated genes were red and green respectively.
Download figure:
Standard image High-resolution image3.7. qRT-PCR
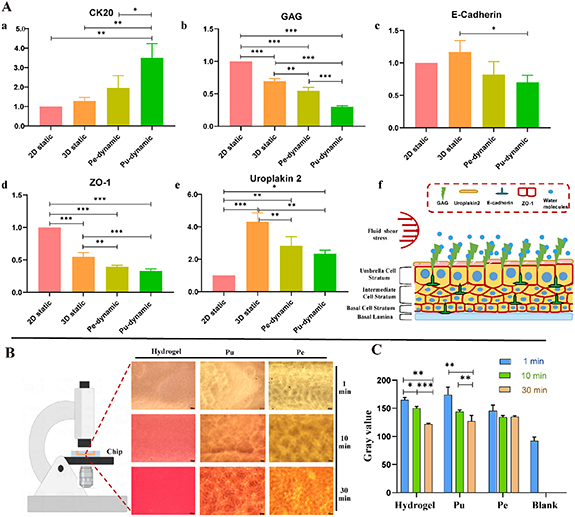
Statistical analysis showed that compared with static culture, the mRNA expression of CK20 was significantly up-regulated during dynamic culture. The mRNA expression of E-Cadherin was the highest in the 3D static group, while the expression in the static group was higher than that in the dynamic culture group, although not significantly (p > 0.05). Under dynamic culture conditions, the expression of GAG was downregulated, and there was a large statistical difference among the groups (p < 0.01); the expression of uroplakin 2 and E-Cadherin was upregulated in 3D culture. However, under dynamic stimulation, the expression of uroplakin 2 and E-Cadherin was significantly lower than that in 3D static culture (p < 0.01); while the expression of ZO-1, a marker reflecting epithelial cell barrier function, was consistent with that of GAG. Compared with static culture, its expression was down-regulated in a dynamic culture. There were statistical differences among the groups (p < 0.01) (figure 11(A)).
Figure 11. Expression level of genes related to urothelial barrier and water permeability of urothelium on-chip. (A) Expression levels of urothelial barrier-specific genes, uroplakin 2, CK20 (a), GAG (b), E-Cadherin (c), ZO-1 (d), and uroplakin 2 (e) with respect to the housekeeping gene β-catain on day 7 under either dynamic or static coculture conditions; and pattern diagram of urothelial barrier function (f). (B) Relative water permeability of blank group, hydrogel, pulse culture, and periodic culture covered with urothelium (Pe: periodic flow group; Pu: pulse flow group). The lower the gray value, the darker the color. *p < 0.05, **p < 0.01, ***p < 0.001; n = 3.
Download figure:
Standard image High-resolution image
3.8. Water permeability of urothelium on-chip
The urothelium is a barrier to the urinary tract, preventing urine from penetrating the matrix. To evaluate the water permeability of the constructed urothelial on-chip model, we assessed the water permeability of the blank control group, naked hydrogel group, and chip covered with urothelial cells. The permeability was characterized by the amount of red solution permeated into the hydrogel at different time points. The results showed that the permeability of the naked hydrogel was the highest, while the gray value was the lowest after 30 min, which was close to the blank control group (figure 11(B)). Interestingly, the permeability of the upper urinary tract was lower than that of the lower urinary tract (with higher gray value), and the gray value of the lower urinary tract reached balance after 10 min. This indicated that there is a synergistic barrier function between GelMA hydrogel and urothelial cells.
3.9. Discussion
Building functional bionic models has been challenging due to the inability to remodel complete tissue details. Evidence suggests that the microenvironment plays a crucial role in tissue remodeling and regeneration. Given the genetic interspecies differences, findings in animal models often do not translate into effective interventions for human patients [19]. Traditional cellular models, on the other hand, lack tissue microenvironments and fail to reproduce tissue-tissue and cell-ECM interactions, which are required to model tissue growth and development and pathophysiology [20]. Organ-on-a-chip technology encapsulates key elements of the tissue microenvironment and can bridge the gap with real models [21]. The urothelium on-chip model constructed in this study has the following characteristics: firstly, it simulates the 3D ECM and urinary flow microenvironment, which is the key to tissue maturation; Secondly, the model exhibits the morphological structure, specific differentiation, mature markers, and uroepithelial barrier function of the natural urothelium.
The urothelial cells are frequently subjected to mechanical stimuli, including FSS, tension, and ECM, which together comprise the urinary microenvironment. The ECM of the urinary tract is usually composed of proteins such as laminin, fibronectin, and collagen and varies in proportion at each site, which results in different matrix stiffness and porosity. The ECM components were simulated by adjusting the GelMA hydrogel concentration and DAS to meet the mechanical properties of human tissues. Matrix stiffness was similar to that of natural tissues [17]. Less swelling and degradation maintain its mechanical strength and pore morphology, and better biocompatibility is the basis for cell culture. These excellent mechanical and biological properties make GelMA hydrogels a preferred choice for constructing urinary tract epithelial matrices.
The urinary tract is the site of urine filtration, storage, concentration, and excretion, and has a unique urinary flow microenvironment. The flow of urine in the urinary tract is laminar and includes both pulsatile and periodic flow forms. In this study, the fluid environment of the upper and lower urinary tract was simulated by introducing controlled syringe and peristaltic pumps, and the simulation reproduced the FSS distribution in the channel, which is unmatched by conventional models. Urothelial cells are key to the study of urological diseases. However, primary urothelial cells obtained from the normal bladder or urethra can proliferate in vitro due to the limitations of culture conditions and culture methods, but their structure and function are not yet mature. These cells express characteristics of basal and intermediate cells, but do not express markers of urothelial cell differentiation [4, 22]. The findings suggest that mechanical stimulation, represented by the ECM and urinary flow, can influence the expression of the morphological structure and function of the cells and promote their maturation.
Gene enrichment analysis showed that compared with 2D culture, 3D culture promoted ECM synthesis, adhesion and apical plasma membrane gene expression in urothelial cells, which is critical for the formation of urothelium structure. This includes GAG, collagen, and laminin, of which GAG is an important part of the urothelial barrier [23]. Compared with 3D static culture, the introduction of dynamic urinary flow microenvironment of various flow patterns is beneficial to explain the difference of functional expression between upper and lower urinary tract, and demonstrates the efficacy of the model in simulating urothelium function. The differences in gene expression between the upper and lower urinary tracts are mainly manifested in functions such as cell chemotaxis, cell surface, and lateral plasma membrane, especially the expression of cilia-related genes, which are required for their mechanical transduction signals and morphological maintenance [24]. The expression of urothelial barrier proteins was further verified by qRT-PCR. Among them, GAG, CK20, and uroplakin 2, which are markers of differentiation of mature urothelial cells and the key components of urinary tract barrier, were distributed on the surface of urothelial cells. The changes in the expression of their genes were also reflected in the results of transcriptome sequencing. It indicates that the combined effect of 3D matrix and urinary flow microenvironment is helpful in the construction of a bionic urothelium.
The morphology, structure, and maturity of the urothelial cells directly affect the structure and function of the urothelium. The natural urothelium can be divided into three layers, from the basement membrane upwards, the basal, the intermediate, and the umbrella cell layers [1]. The cells showed a cobblestone-like distribution with tight junctions between cells (figure S14). The urothelium on-chips in this study were histologically visible as multilayered urothelium with a thickness of 40–50 µm, which is similar to the physiological thickness. In the identification of epithelial cell types, the IHC results indicated that the urothelium on-chips had the stratified structure of natural urothelium and most of the cells were basal cells. This is similar to the urothelium organoids model constructed by Mullenders et al [25] and the spatial distribution of natural urothelial cells. The basal cell layer was the thickest, the intermediate layer was the next, and the umbrella cells were mostly in a single layer.
For the culture time, we selected seven days as the maximum time point for observation. We referred to previous in vitro models of urothelium, including cellular and animal models. Related studies have shown that in vivo urothelium regeneration is completed within 7–14 days [26]. In a bladder bioreactor study, urothelial cells after seven days of culture had high viability and were able to undergo adaptive changes in a mechanically stimulated environment [27]. In a mouse model of postoperative prostatic hyperplasia, monolayer uroepithelium expressing uroplakin 2 was found at the wound site five days after urethral wounding, indicating that re-epithelialization of the wound had been completed [28]. At day 7, there were multiple layers of urothelium with uroplakin 2 expression, indicating that repair was complete. From the analysis of the developmental biology of the urothelium, both apoptosis and cell replacement are essential processes during epithelial development in the stratified epithelium. Related studies have demonstrated that from birth, urothelial cells desquamation occurs between days 7 and 10 [29]. During the study, we found that a large amount of shedding on the surface of the urothelium on days 5–7 (figure S15), and we speculate that the surface epithelial cells mature and shed at this time, completing a renewal. Therefore, we believe that seven days may represent the time of renewal of the urothelial cells.
The urothelium is the barrier of the urinary system, and disruption of barrier function may eventually lead to various urothelium diseases, such as urinary tract infection, urothelium injury, urothelium tumors, and interstitial cystitis [3]. The urothelium is continuous under light microscopy, which is the basis of the urinary tract barrier. Structurally, the barrier function of the urothelium on-chips benefits from the proliferation and migration of urothelial cells (multi-layered urothelium) as well as differentiation (mature urothelial cells). Functionally, the specific markers of the epithelial barrier as well as the permeability assay demonstrate the barrier function of the constructed urothelium. Tight junctions between cells under physiological FSS, which are critical for cell-cell interactions and maintenance of urothelial barrier function, were observed using SEM. ZO-1 is a tight junction protein in urothelium, which is closely related to urinary tract barrier function [30]. Under physiological FSS, ZO-1 was arranged linearly and the boundary between cells was clear and complete. F-actin is the key feature of cell structure maintenance and is also involved in the regulation of ion absorption and endocytosis [31]. Uroplakin 2 is mainly distributed in the urothelial umbrella cell layer and is a specific marker of urothelium maturation. Its main function is to form a blood-urine barrier in the urothelium and prevent urine and other solutes from transporting across cell membranes [4]. The destruction and abnormal expression of uroplakin 2 can damage the function of the urothelium barrier. Related studies have shown that the expression of uroplakin 2 in the upper urinary tract is lower than that in the lower urinary tract [16], which is consistent with our immunofluorescence staining results.
In pathophysiological conditions, in addition to the disruption of the integrity of the barrier function, urinary flow disorders are a major challenge. In vivo, FSS in physiological conditions varies from 0.2 to 2.0 dynes cm−2 [10]. However, fluid stimulation at supraphysiological values (urinary flow disturbances) is common in urinary tract diseases such as polycystic kidney, ureteral reflux and obstruction, and overactive bladder [32–34]. In the present study, cell proliferation and differentiation were inhibited at high flow rates. Although the mechanism of cellular damage by high shear was not explored in this study, it is evident from the published literature that cellular damage is caused by supraphysiological FSS [35]. The most striking feature is the rearrangement of the cytoskeleton. Urothelial cells are sensitive to mechanical stimuli, and when cells are subjected to supraphysiological values of shear, mechanical signals are transmitted to various parts of the cell with the help of molecular receptors on the cell membrane to activate the corresponding effector molecules, which affect cell proliferation, division, and motility [36]. This involves several mechanosensitive ion channels, such as Piezo1 and calcium channels [37].
Microfluidics has driven organ-on-a-chip from single-cell culture to membrane-based co-culture of two types of cells to multi-cell co-culture based on micro-pillar and 3D printing technologies [38]. During development, the microenvironment is enriched. Microfluidic chips have evolved from single channels to integrated, high-throughput channels with increasing utility and standardization. This will certainly drive the development of urothelium models, especially the construction of pathophysiology and disease models. For example, by adding pathological parameters or using diseased cells to construct their pathological microenvironment.
The microenvironment is the basis for cellular homeostasis and function. Remodeling the tissue microenvironment is of great clinical importance for the construction of physiological and pathological models, especially for organ on-chips. The microenvironment in the urinary tract includes the physical or chemical microenvironment of urine flow, gravity, traction, and chemical stimulation of urine. With the continuous improvement of research methods, it is possible to make urothelium on-chip with multiple microenvironment integration. Also, the model is more flexible in the choice of cell types; in addition to primary or cell lines, microtissues, and stem cells can also facilitate the construction of complex tissues. With the addition of novel research methods and materials, the urothelium on-chip is more functional. In the future, this model can be used for the construction of more complex urinary tract models (multicellular and multisystem), including those of urothelium-associated diseases. And on this basis to further explore the cellular and molecular biological mechanisms of urinary tract diseases.
4. Conclusion
The 3D urothelium on-chip model constructed in this study has the characteristics of natural urothelium in terms of morphology and function. By introducing hydrogels and controllable fluids, the 3D matrix of the urothelium and the urine flow microenvironment were simulated to a great extent. This is also the first urothelium microfluidic model. This novel in vitro model is of great significance for the study of urothelial physiology, injury repair, and urothelial diseases.
Acknowledgments
This work was supported by the National Natural Science Foundation of China (No. 81974085), the Natural Science Foundation of Shanghai (No. 18ZR1429200), the International Cooperation Fund of the Science and Technology Commission of Shanghai Municipality (No. 19410741700) and the Discipline Leader of Shanghai Municipal Health (No. 2022XD015). We acknowledge BioRender.com for providing icons of illustrations.
Data availability statement
All data that support the findings of this study are included within the article (and any supplementary files).
Conflict of interest
The authors declare no conflict of interest.
Supplementary data (3.0 MB PDF)