

Abstract
Temperature is one of the most fundamental drivers governing microbial nitrogen (N) dynamics in rivers; however, the effect of climate change-induced warming on N processing has not been sufficiently addressed. Here, annual, and seasonal (spring and summer) N loads exported from the Po River watershed (Northern Italy), a worldwide hotspot of eutrophication and nitrate pollution, are investigated in relation to water temperature trends over the last three decades (1992–2019). Despite large inter-annual variations, from the early 1990s, the Po River experienced a significant reduction in total N loads (−30%) represented mainly by nitrate, although agricultural N surplus in croplands and other watershed conditions have remained constant. In parallel, the Po River water is steadily warming (+0.11 °C yr−1, for average annual temperature) and the number of warm days is increasing (+50%, in the spring–summer period). The inverse relationship between water temperature and N loads strongly indicated that the higher temperatures have boosted the denitrification capacity of river sediments along the lowland reaches. Overall, over the last three decades, annual total N loads declined by around one-third due to a near 3 °C increase in temperature and this evidence was even more marked for the summer season (−45% for total N loads and +3.5 °C for temperature). Based on these observations, it is suggested that near-term effects of climate change, i.e. warming and an increase in the duration of low-flow periods in rivers, may have negative feedback on eutrophication, contributing to partially buffer the N export during the most sensitive period for eutrophication.
Export citation and abstract BibTeX RIS

Original content from this work may be used under the terms of the Creative Commons Attribution 4.0 license. Any further distribution of this work must maintain attribution to the author(s) and the title of the work, journal citation and DOI.
1. Introduction
Anthropogenic reactive nitrogen (N) inputs in agricultural watersheds have dramatically increased during the 20th century, with multiple detrimental environmental effects including water pollution, eutrophication, aquatic ecosystem functioning, biodiversity loss, and human health impacts [1–3]. The interaction between land use, hydroclimatic, and biogeochemical drivers over space and time mainly influences N use efficiency in croplands, runoff rates, and riverine N export from watersheds [4–6]. The amounts of N that reach coastal zones depend on an array of processes occurring across the landscape (e.g. crop uptake, leaching from the soil, nitrification, denitrification, etc) that are temperature- and precipitation-dependent. Thus, the alteration of the hydrological cycle and thermal regimes under climate change scenarios is expected to significantly affect both the magnitude and timing of N processing and delivery to inland waters and ultimately the sea [7–9]. Changes in precipitation frequency, intensity, and duration alter watershed hydrological cycles by emphasizing extreme hydrologic events (floods and droughts) and, consequently, the seasonality of N load generation and transport from land to aquatic ecosystems via runoff. Reductions in precipitation and higher evaporation rates are expected to decrease discharge in summer, whereas higher winter rainfall or periods with short-term but heavy precipitation likely result in increased discharge and N leaching from agricultural areas outside the growing season [10, 11].
Studies on climate change and river water quality have almost exclusively focused on assessing the impact of altered hydrological regimes on runoff and nutrient loss from croplands and riverine transport. However, the impact of climate change on watershed biogeochemical cycles (N in particular) depends not only on changes in precipitation and runoff but also on water temperature changes. While trends in climatic variables (i.e. air temperature and precipitation) are well documented in many watersheds worldwide, studies concerning the trajectories of river water temperature are still limited due to the scarcity of long-term and high-resolution datasets. Thus, the effect of climate warming on the thermal regime and thus on microbial activity and N budget of river systems is still understudied [e.g. 12–14]. Warmer waters may stimulate, both directly and indirectly, the N-removal capacity of rivers, thereby reducing the amount of N transported to coastal zones. Denitrification, the anaerobic reduction of nitrate ( ) to N gas, is regarded as one of the main regulating ecosystem functions provided by rivers and is a crucial process that counteracts eutrophication [15, 16]. Like all microbial processes, denitrification is controlled by temperature, and higher water temperatures also enhance sediment oxygen demand and the extent of hypoxic or anoxic conditions in the benthic compartment [17, 18].
An interesting scientific question is how watersheds react to climate change with respect to N inputs to water bodies and the resulting timing of in-stream transformation, removal, and transport processes. For example, increasing water temperature induced by climate change, especially in summer, may strengthen the N-removal capacity of rivers, thereby attenuating the N loads transported to coastal zones during the most eutrophication-sensitive period. Studies targeting N budgets in watersheds and related N loads and processing in rivers are usually conducted on an annual scale [4, 6, 19]. Whilst annual N export is a useful indicator in temporal or comparative studies, is not sufficient for assessing eutrophication risk. The management of the timing and impacts of N export requires the detailed quantification of seasonal N loads, particularly in spring and summer when eutrophication potential is the highest in terminal water bodies [20, 21].
In the Mediterranean region, which is characterized by warm dry summers and wet winters, the impacts of climate change may be among the most severe worldwide [5, 22, 23]. The Po River basin (Northern Italy) is a worldwide hotspot of eutrophication and  pollution and, as such, represents a useful study area that has been experiencing high flow variation and increased frequency and severity of air temperature anomalies and drought over the last few decades [19, 24–28]. Comprehensive studies have demonstrated a significant increase in both minimum and maximum temperature extremes in all seasons in Northern Italy, although the strongest warming trends have been detected from the early 1980s in summer, with an average rate of change of approximately 0.5 °C every 10 years together with an increasing frequency of heatwaves, which has resulted in a longer growing season [29–32].
In human-impacted watersheds, the study of N load formation, transport, and delivery is a key issue for implementing environmental policies aimed at protecting the coastal zones, with strong implications for productive sectors and urban wastewater management, and it must necessarily consider the climate change that is altering the inland waters. At present, it remains unknown whether climate change and water temperature affect in-stream N processing and transport in the Po river. To address this knowledge gap, for the first time, the present study explored the relationship between the Po River water temperature and N loads over the last three decades (1992–2019). The main hypothesis is that the occurrence of higher temperatures over longer periods boosts the sedimentary microbial processes responsible for N removal (i.e. nitrification and denitrification) and, thus, decreases N export to the Adriatic Sea, particularly during the spring and summer months, the most sensitive period for eutrophication.
2. Materials and methods
2.1. Study area
The Po River is the longest river in Italy, flowing eastward across Northern Italy for over 650 km (figure 1), and is also the largest river, with an average discharge of ∼1500 m3s−1 at its closing section [33]. The Po drainage basin extends over an area of ∼75 000 km2, a large portion of which constitutes the widest and most fertile lowland in Italy (∼47 000 km2). The Po River is supported by both Alpine and Apennine's tributaries, fed mainly by snowmelt and rainfall, respectively, resulting in an annual flow regime that is characterized by two flood periods (in spring and late autumn) and two low-water periods (in summer and winter) [34]. The basin covers the transition zone between the sub-continental climate of Central Europe and the Mediterranean climate, with an average annual precipitation of approximately 1200 mm [35]. The Po River basin is densely urbanized and an intensely exploited area, accounting for 40% of Italy's gross domestic product and 35% of national agricultural production. With some of the highest rates of N losses to surface water and groundwater [19, 36, 37], this region is responsible for approximately two-thirds of the total nutrient inputs to the Northern Adriatic Sea [38–40].
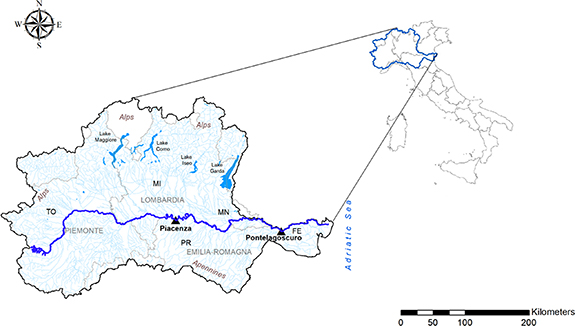
Figure 1. Map of the Po River basin and its hydrographic network. The blue line represents the main Po River course, and the two monitoring stations are indicated as black triangles. The borders of the Italian Regions are shown as gray lines with the following main cities indicated: Turin (TO), Milan (MI), Parma (PR), Mantua (MN), and Ferrara (FE).
Download figure:
Standard image High-resolution image2.2. Datasets of river water temperature
Accurate and continuous water temperature datasets, representative of the middle-lower reach of the Po River, were acquired from two monitoring stations, operated by energy companies, located at the cooling water intake of the power plants. Daily average water temperature data were recorded near the city of Piacenza (Emilia-Romagna Region, stream kilometer 330) at La Casella Power Station by the ENEL group (Italian multinational manufacturer and distributor of electricity and gas; www.enel.com/it/media/esplora/ricerca-foto/photo/2020/03/italia-centrale-la-casella) from 1992 to 2005, and at Piacenza Power Station by the A2A Life Company Group (www.a2a.eu/en/group) from 2006 to 2019, giving a complete dataset for the period 1992–2019. Water temperature measurements were carried out using resistance temperature detector (RTD) probes with platinum Pt100 resistance thermometers having a nominal resistance of 100 Ω at 0 °C defined according to IEC 751 (EN 60751) .Other sensor characteristics: measuring range 0–40 °C; accuracy ±0.1 °C at 0° C; 4-wire connection; signal conversion electronics with 4–20 mA output in measuring range 0 °C–40 °C. The validation procedure to reconstruct a continuous three-decade time series is reported in the supplementary material 1. From temperature daily data, the annual and seasonal trends in average values were analyzed for the spring (April–June) and summer (July–September) periods.
2.3. Calculation of riverine N loads
Monthly  and ammonium (
 ) loads and total nitrogen (TN) exported to the Adriatic Sea were calculated using discharge and concentration datasets for the study period (1992–2019) at the closing section of the Po River basin, which is conventionally located at Pontelagoscuro (44°53'19.34''N, 11°36'29.60''E) near the city of Ferrara (Emilia-Romagna Region; stream kilometer 586). Daily average discharge was acquired from the permanent records of a gauge operated by the Environmental Agency (ARPAE) of the Emilia-Romagna Region and retrieved from the 'Hydrological Annals—Second Part' published by ARPAE, the electronic versions of which are available on the Regional Open Data Portal (https://simc.arpae.it/dext3r/). Nitrogen species concentrations were obtained from fortnightly (or monthly) sampling campaigns carried out by ARPAE under the framework of the environmental monitoring program (https://dati.arpae.it/group/acqua). Sample collection and analysis were performed in accordance with standard methods and analytical protocols adopted by regional environmental agencies [41]. When not provided, TN concentrations were calculated from the concentrations of DIN (
 +
+  ) according to the formula TN = 0.93 × DIN + 0.75 (r2 = 0.54; p < 0.001), obtained by relating time series including simultaneous TN and DIN measurements.
Nutrient loads were calculated as the product of the daily discharge and nutrient concentration (measured fortnightly or monthly and interpolated to daily intervals) and aggregated into monthly means. The method employed for the monthly load calculation was based on the linear interpolation of concentration values between two subsequent sampling events [42, 43], as follows (1):
where Cj int is the daily N species concentration (g N m−3) linearly interpolated between two measured samples, Qj is the daily discharge (m3 s−1), n is the number of days in each month, and k is a conversion coefficient to take the recorded period into account (e.g. 365 d for annual loads). Seasonal load trends in the spring and summer periods (t N season−1) were evaluated according to the following monthly clustering: April–June (spring) and July–September (summer). Annual loads (t N yr−1) were computed by summing up all the monthly contributions. To validate the annual loads calculated by the interpolation concentration method, the obtained values were compared to those calculated by flow-adjusted concentration method. Flow-adjusted concentrations are commonly employed for assessing annual loads and are recommended in monitoring guidelines [44] and international conventions (e.g. OSPAR-Convention for the protection of the marine environment of the North-East Atlantic) [45], but they are not valid for calculating monthly (and thus seasonal) loads because the environmental monitoring quality programs typically carry out just one sampling per month. A very good correlation between the annual values calculated by the two methods was found (r2 = 0.99, p < 0.001) and a discrepancy of about 5% on average (see supplementary material 2).
With the aim of assessing if long-term nutrient load trends might be mediated by the Po River water temperature trends, monthly flow-normalized loads (Ln) were calculated according to [46] to remove the effects of varying inter-annual hydrological conditions on N transport:

where Kh (hydrological coefficient). The hydrological coefficient was obtained as the ratio of the long-term (period 1992–2019) average outflow of a specific month to the monthly outflow of a particular year. The annual normalized loads were computed by summing up the monthly normalized loads. Similarly, the seasonal normalized loads were calculated by summing up the normalized loads from April to June and from July to September, for spring and summer period, respectively.
2.4. Reconstruction of historical changes in diffuse and point N sources
Because the Po River basin is among the most agriculturally productive and densely populated areas in Italy, changes in agricultural practices and populations could result in changes in riverine N loading. The temporal evolution of diffuse and point N sources in the watershed was checked by collecting census data at an almost 10 year time interval for agricultural land occupied by different crop types and production systems, numbers of farmed animals, synthetic fertilizer application practices, and human population. Statistics were integrated in a N budgeting approach previously applied to several sub-basins of the Po River system [37, 47, 48]. Details regarding the data sources, computational methods, and uncertainty assessment of the diffuse and point N sources are presented in supplementary material 3.
2.5. Statistical analyses
Annual and seasonal time series of temperature, riverine N loads, and water flow were analyzed using parametric (linear regression) and non-parametric tests (Mann–Kendall, Sen's slope, and Pettitt's test). Pearson correlation analysis was used to investigate the relationship between temperature and riverine N loads. All statistical tests were performed using the software R (Core Team, 2021) with the Kendall package for the Mann–Kendall test and the Trend package [49] for the other analyses. The tested factors and trends were considered statistically significant at p < 0.05. Details of the statistical tests are presented in supplementary material 4.
3. Results and discussion
3.1. Nitrogen load trends
During the period 1992–2019, the annual TN loads at the closing section of the Po River basin showed a significant negative trend (p< 0.05, figure 2(a)), decreasing by nearly 33%, corresponding to a reduction of approximately 2000 t yr−1. Depending on outflow variations linked to precipitation, the TN export varied greatly among years, ranging between ∼68 000 t N yr−1 (2007 and 2017) and ∼237 000 t N yr−1 (1996). As is commonly found in agricultural settings [15, 16], the nitrate load accounted, on average, for >75% (range = 62%–86%) of the TN load, whereas the contribution of  was comparatively minor (range = 1%–5%) (figure 2(a)). Compared to the early 1990s, the
  load declined over the study period by more than 30% (p < 0.05, figure 2(a)), showing inter-annual variations that coincided with those detected in the TN load. The highest annual
  export (∼160 000 t yr−1) occurred in 1996, while the lowest amount (∼50 000 t N yr−1) occurred in both 2007 and 2017. Over the study period, the annual
  load decreased by approximately two-thirds (p< 0.001, figure 2(a)) from ∼6300 t N yr−1 in the early 1990s to less than 2000 t N yr−1 in recent years. The hydrological conditions have also varied significantly during this period, although there has been no significant long-term trend in the annual outflow. For example, 2007 and 2017 were extremely dry, with outflow values 42%–45% lower than the long-term average and corresponding to lower N transport. Conversely, 2014 was an extremely wet year with an annual outflow >50% higher than the long-term average, and consequently higher N transport. In the Po River, early signals of climate change effects have been reported over the last three decades, when hydrological extremes have become progressively amplified [19, 33, 34], with large floods followed by persistent drought conditions [50, 51].

Figure 2. Temporal trends in nutrient loads ( ,
,  , and other N forms) and outflow measured at the closing section of the Po River basin on an annual basis (panel (a)), in spring (panel (b)), and in summer (panel (c)).
  +
+  + other N forms = TN. Note that the Y-axis differs between the panels.
Download figure:
Standard image High-resolution imageThe trajectories of riverine N loads were not related to human pressures, productive sectors and the associated generation of N loads from diffuse and point sources. Indeed, the N balance across the croplands of the Po River basin revealed a steadily constant surplus during the 1990–2019 period, averaging ∼180 kt N yr−1 (figure 3). The total N input during this period was estimated to exceed 600 kt N yr−1, mostly derived by manure spreading (36%), synthetic fertilizers (33%) and biological fixation (26%). The total N output during the study period was estimated to exceed 430 kt N yr−1, mainly associated with crop harvesting (74%). Total watershed N inputs to croplands showed a slight decline in 2010 (∼14%) with respect to the previous two decades, but this was coupled to a decrease also in total N outputs (∼15%) resulting, if the associated uncertainty is considered, in a net budget (i.e. surplus) not significantly different over the studied period. While the human population in the Po River basin has remained relatively constant over the last three decades at ∼17 million, important legislative acts aimed at improving urban wastewater treatment plants (e.g. Directive 91/271/EEC) were followed by an appreciable reduction in the direct discharge of untreated or poorly treated domestic wastewater [28]. Nitrogen loads from point sources decreased by nearly 45% between 1990 and 2000 and then remained almost constant until 2019 (figure 3) and this may have been partly responsible for the clear decrease of riverine  loads. Despite this, the decrease was not in the order of magnitude to explain the decrease recorded for the riverine TN loads. Overall, over the entire investigated period, N loads from urban areas accounted for less than 5% of the total N input from diffuse agricultural sources. Since the early 1990s,
  pollution has become the main concern for surface water and groundwater in the Po River basin because the measures introduced by the European Directives for controlling widespread agricultural and livestock sources (i.e. 91/676/EEC, 2000/60/EC) have been largely ineffective [27, 52]. Recent studies have shown that in agricultural landscapes, artificial water bodies such as irrigation canals and drainage ditches may act as natural wetlands in terms of provision of biogeochemical services, i.e. the mitigation of N excess via denitrification [47, 53]. The capillary network of artificial waterways crossing the Po River plain was implemented over the centuries, from the Etruscan age to the 1960s, with multiple purpose, i.e. irrigation, drainage, and flood control [54–56]. It is reasonable to hypothesize that the N amount removed via denitrification by the whole canal network remained stable along the three decades analyzed in the present study and thus it is very unlikely to explain the major reduction observed in the Po River
  loads, whose cause is to be found elsewhere.
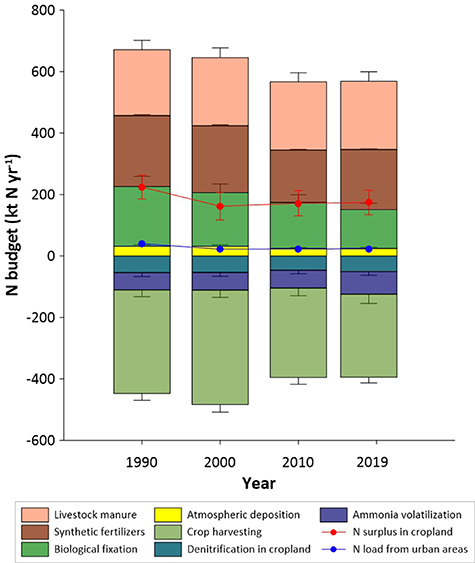
Figure 3. Decadal changes (1990–2019) in diffuse and point N sources (kt N yr−1) in the Po River basin.
Download figure:
Standard image High-resolution imageSpring and summer nutrient loads represented on average 19%–24% and 13%–14% of the corresponding annual values, respectively (figures 2(b) and (c)). Summer TN and  loads exhibited high inter-annual variations, ranging from ∼8000 (2003) to ∼3000 t N season−1 (2002), and from ∼5500 (2003) to ∼27 600 t N season−1 (2002), respectively. The analyzed dataset contained years with rather extreme summertime hydrological conditions; the summers of 2002 and 2014 were very wet, with outflow 56%–66% higher than the long-term summer average. In contrast, the summers of 2003 and 2007 were extremely dry, with outflow 39%–53% lower than the 1992–2019 average. The period from 2003 to 2007 was characterized by frequent and persistent summer drought that culminated in daily discharge frequently <300 m3s−1. Of the six most-prolonged drought events recorded during the last century, four occurred between 2003 and 2007, with the lowest daily discharge of ∼170 m3s−1 occurring in July 2006 [33, 57, 58]. The time series of summer loads exhibited a negative trend for TN and
  (p < 0.01, figure 2(c)), decreasing on average by 42%–47%, while a significant downward trend, if tested by linear regression, was not detected in spring when load variations among years were more erratic (figure 2(b)). Differently to TN and
  ,
,  loads decreased by nearly 62% in spring (p < 0.01; figure 2(b)), whereas linear regression was no statistically significant in summer (figure 2(c)).
Summer outflow decreased by nearly 34% (1.3% per year), highlighting that drought events have been exacerbated during the more recent decades as previously demonstrated by hydrological studies [25, 33, 34]. The calculation of flow-normalized loads showed that the annual transport of TN,  , and
, and  at the Po River closing section decreased by 15%, 14%, and 61%, respectively, along the entire investigated period (figures 4(a), (d), and (g)). The results of the Mann–Kendall and Sen's slope analyses on flow-normalized nutrient loads showed negative Z values, confirmed by a negative slope, indicating downward trends since 1992 both at the annual and seasonal scale (table 1). The Pettitt's test showed that the decline in seasonal nutrient loads began in 2006 (figures 4(b), (c), (e) and (f)), except for
  for which trends began in 2008 for spring (figure 4(h)) and in 2009 for summer (figure 4(i)), resulting in annual loads started to decrease around 2010.

Figure 4. Temporal trends in flow-normalized N loads (TN,  , and
, and  ) measured at the closing section of the Po River basin on an annual basis (panels (a), (d), and (g)), in spring (panels (b), (e), and (h)), and in summer (panels (c), (f), and (i)). Note that the Y-axis differs between the panels. Dashed lines show statistically significant trends.
Download figure:
Standard image High-resolution imageTable 1. Results of the statistical analyses.
| Linear regression | Mann–Kendall | Sen's slope | Pettitt | |||||
|---|---|---|---|---|---|---|---|---|
| Period | p-value | p-value | S | Z | Q | K | Year | |
| Flow-normalized TN loading | Annual | 0.001 | <0.001 | −132 | −2.59 | −744.77 | 134 316 | 2010 |
| Spring | 0.001 | <0.001 | −170 | −3.34 | −326.40 | 33 282 | 2006 | |
| Summer | — | <0.001 | −74 | −1.44 | −66.61 | 20 519 | 2006 | |
Flow-normalized  loading loading | Annual | 0.05 | <0.001 | −92 | −1.80 | −630.06 | 104 556 | 2011 |
| Spring | 0.001 | <0.001 | −152 | −2.98 | −221.59 | 24 275 | 2006 | |
| Summer | — | <0.001 | −26 | −0.49 | −19.93 | 15 024 | 2006 | |
Flow-normalized  loading loading | Annual | <0.001 | <0.001 | −214 | −4.21 | −126.44 | 5493 | 2005 |
| Spring | 0.01 | <0.001 | −160 | −3.14 | −22.02 | 700 | 2008 | |
| Summer | — | <0.001 | −36 | −0.69 | −3.37 | 745 | 2009 | |
| Temperature | Annual | <0.001 | <0.001 | 236 | 4.64 | 0.12 | 14.0 | 2002 |
| Spring | 0.01 | <0.001 | 160 | 3.14 | 0.09 | 17.1 | 2002 | |
| Summer | <0.001 | <0.001 | 192 | 3.77 | 0.14 | 21.1 | 2002 | |
| Outflow | Annual | — | <0.001 | −62 | −1.20 | −0.39 | 60.45 × 10⁹ | 2002 |
| Spring | — | <0.001 | −122 | −2.39 | −0.14 | 12.60 × 10⁹ | 2002 | |
| Summer | 0.05 | <0.001 | −20 | −0.37 | −0.03 | 17.29 × 10⁹ | 2002 | |
3.2. Water temperature trends
Significant positive trends in the annual, spring, and summer water temperature series of the Po River were identified for the 1992–2019 period (figure 5), as demonstrated by the positive Sen's slope values (table 1). The annual average temperature increased during this period by ∼3 °C, corresponding to an overall warming rate of 0.11 °C yr−1, although the pattern of change showed two moments: the annual series from 1992 to 2002 were characterized by relative stability with an average temperature of 13.87 ± 0.22 °C and low inter-annual variability; while an abrupt increase occurred after 2002 with a slope of more than 0.18 °C yr−1 and high fluctuations among the years (average 15.88 ± 0.88 °C) (figure 5). The highest annual temperatures (up to ∼17 °C) were recorded in 2007 and 2015, 2 years marked by significant thermal (high air temperature) and meteorological (low precipitation) signals [26, 32]. Seasonally, the average spring and summer water temperatures increased by nearly 2 °C (0.07 °C yr−1) and 3.5 °C (0.13 °C yr−1) over the monitoring period, respectively (figures 5(b) and (c)), with the most marked warming trends and inter-annual variability starting in 2002 (table 1). These temperature increases resulted to be faster than the average increases observed in other large European and American rivers in temperate zones during similar periods [59, 60]. However, the present outcomes agree with previous studies indicating a major contribution to warming from the hottest period of the annual cycle with stronger positive trends for late spring–summer months and a significant advance of spring warming [61–65].
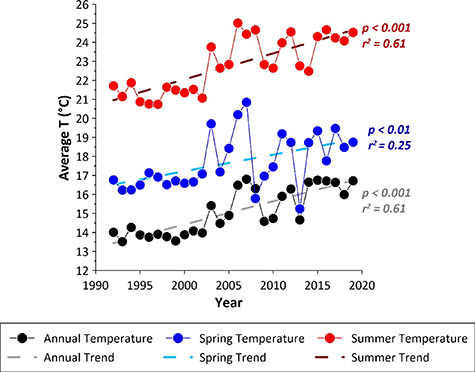
Figure 5. Annual (black line), spring (blue line), and summer (red line) average temperatures of the Po River water between 1992 and 2019. Dashed lines show statistically significant trends.
Download figure:
Standard image High-resolution imageMeteorological stations located nearby the Po River course showed a significant positive trend for air temperature, recording an increase of about 2 °C in annual and summer average values and an increase of about 1 °C in spring average values over the last three decades (figures S2 and S3, supplementary material 1). The present data was confirmed by previous meteorological studies that have demonstrated how the air temperature in Po River basin has been affected by warming in the period 1952–2002, recording an increase of over 1 °C for average annual values [66] and detecting stronger positive anomalies in the mountain areas compared to the lowlands and the delta region [67]. Further studies have demonstrated an increase in annual maximum temperatures with linear and constant trends of about 0.5 °C every 10 year and predicted a raise of 3 °C–4 °C by the end of the last decade, as it happened [68] and an even higher temperature anomaly for the next decades [66].
Pettitt's test on the Po River water temperature highlighted a positive trend starting in 2002 (table 1) and this was consistent with the most marked increase in air temperature detected from the beginning of the 2000s (figure S3, supplementary material). Despite long-term increases in river water temperatures being correlated to increases in air temperatures, surprisingly, the warming trend of the Po River water was stronger than the atmosphere, when the latter is supposed to contribute to the warming of the former. These unusual data may be ascribed to the joint effect of rising air temperature and reduced outflow on river temperature trends [65].
In parallel to the upward temperature trends, the annual occurrence of warm days (i.e. the number of days with water temperatures above the long-term average) increased by more than 50% for both the spring and summer periods (figure 6). This condition was in agree with previous studies reporting, for the Mediterranean area, a significant increase of the days with warm temperature extremes [69–71], suggesting that the growing season length is increasing. The occurrence of warm days in summer is often related to low-flow conditions, as was the case for the period from 2003 to 2007, which was characterized by prolonged drought in the Po River basin. However, this has not been the case in the last decade, indicating that the Po River is becoming more sensitive and vulnerable to such extreme temperature events with ongoing climate change, as demonstrated for other large European rivers [64].
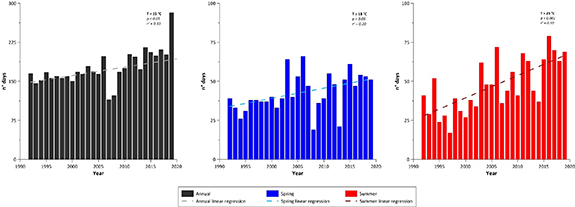
Figure 6. Numbers of days annually (black bars), in spring (blue bars), and in summer (red bars) having water temperature above the long-term average for the Po River (1992–2019). Long-term average values calculated from daily measurements were 15 °C, 18 °C, and 23 °C for the annual, spring, and summer periods, respectively. Dashed lines show statistically significant trends.
Download figure:
Standard image High-resolution image3.3. Negative feedback between climate change and eutrophication
The present outcomes demonstrated that the Po River water is steadily warming, with the number of warm days increasing over time and higher water temperatures corresponding to lower N loads during the entire spring–summer period, the time of year when the risk of coastal zone eutrophication is greatest [72, 73]. Indeed, highly significant negative (p < 0.0001) correlations were detected between average water temperature and monthly loads of TN and  (figures 7(a)–(d)). When the temperature increased by 1 °C, TN and
  loads decreased by approximately 7% and 4% in summer and spring, respectively. A weaker but still significant negative correlation (p < 0.05) was also found between the average water temperature and monthly
  loads in spring (figure 7(e)). The inverse relationship observed between temperature and TN loads (mainly
  ) strongly indicates that the higher water temperatures recorded during the last few decades have stimulated
  removal via denitrification in the river sediments along the lowland reaches (figure 7). This likely act to partially buffer the eutrophication risk in the coastal waters. While several studies suggest that water temperature increases may alter the biodiversity and biological structure and functioning of rivers [59, 74], the resulting effects on ecosystem functions (i.e. N removal) and, ultimately, the regulation of ecosystem services (i.e. self-depuration capacity) remains unclear and warrant greater attention. Experimental laboratory studies have shown that warming boosts nitrification and denitrification rates alongside enzymatic reactions in freshwater sediments [17, 18, 75], but there is a lack of systematic research forecasting global warming effects on N cycling in rivers and expected changes in N loads [76]. When a suitable substrate,
  , and labile carbon are available, denitrification generally responds positively to increases in water temperature. At the closing section of the Po River, dissolved organic carbon during the spring–summer months average 1.8 mg l−1, indicating that organic carbon is balanced with respect to
  availability (averaging 1.7 mg N l−1, 1992–2019 period) according to a theoretical ratio of ∼1 based on denitrification stoichiometry [77]. The dissolved organic carbon concentrations in the lower reaches of the Po River tally with those measured in other agricultural rivers [78, 79], which demonstrates that denitrification is not likely limited by the organic carbon supply. Higher water temperatures decrease oxygen solubility and increase sediment oxygen respiration, thereby limiting the oxygen penetration depth and resulting in a synergistic indirect effect that strengthens the denitrification capacity [17, 75]. The inverse relationship between water temperature and
  loads in spring also suggests that warming may stimulate nitrifying activity (figure 7(e)). Po River water column is indeed thoroughly mixed, thus dissolved oxygen concentrations are typically at or near 100% saturation, and the oxygenation of surface sediments is likely sufficient to support coupled nitrification–denitrification. However, as is widely reported, when water
  concentrations exceed 0.5 mg N l−1, denitrification is expected to be fueled mainly by
  diffusing from the water column to the anoxic sediment layers [15, 16].

Figure 7. Correlations between average water temperature and flow-normalized nutrient loads (TN,  , and
, and  ) measured at the closing section of the Po River basin in spring (panels (a), (c), and (e)) and summer (panels (b), (d), and (f)). Note that the Y-axis differs among the panels. Dashed lines show statistically significant correlations.
Download figure:
Standard image High-resolution image
All biogeochemical  dissimilative pathways, including denitrification and DNRA (dissimilatory
  reduction to
  ), may be affected by water warming, both as a direct temperature effect on enzyme activity and as indirect temperature effect on sediment redox conditions (i.e. oxygen shortage because of decreased oxygen solubility or enhanced consumption rates). Organic carbon availability generally determines whether denitrification or DNRA will dominate in
  reduction, with organic enrichment and reducing (sulfidic) conditions under persistent stratification shifting
  reduction towards more pronounced DNRA, with internal
  recycling to
  [80, 81]. However, this is not the case in the Po River where sediments are sandy and organic matter content is generally low [82]. Stimulation of DNRA by increased water temperature cannot be completely excluded, but this would have contributed to
  accumulation in water, a condition not evidenced. On the contrary, the inverse relationship between water temperature and
  loads suggested that warming might also have stimulated nitrifying activity as, in the Po River, the water column is constantly mixed and oxygen saturated, a condition favoring
  consumption via nitrification–denitrification coupling. Despite direct measurements are still lacking, on the base of the evidence reported here, DNRA is likely a negligible pathway of N cycling in the Po River sediments.
The links between climate change and eutrophication are being debated and outcomes of many previous studies pointed towards an aggravation of eutrophication due to warming lentic water bodies [83]. Differently, warming and an increase in the duration of low-flow conditions might enhance the denitrification capacity of the river as a whole and partially reduce the risk of eutrophic conditions in the coastal zones. As temperatures are projected to increase in temperate regions over the coming decades, the present outcomes suggest an enhanced future denitrification, representing a natural way to counteract the harmful effects of eutrophication. Air temperatures are expected to rise across the entire Po River basin during all seasons and water temperatures will likely track this trend with the most significant changes occurring in summer alongside reductions in discharge [84]. A decrease in eutrophication phenomena in the Po River delta and nearby coastal zones may be expected, in the medium term, due to negative feedback between climate change and eutrophication in association with a potential water quality improvement.
4. Conclusions
The present study demonstrated that water temperature is a critical factor regulating N dynamics in rivers and water temperature increase associated with climate change may exert primary control on watershed-scale N export. The observed Po River temperature increase was likely associated with enhanced rates of microbial processes and more favorable conditions for denitrification and  removal. Rivers are under pressure from eutrophication and warming, but an increased temperature-driven N dissipation capacity may ameliorate the quality of riverine water conveyed during the spring–summer period, partially preventing the degradation of coastal zones. As microbial communities drive key N cycle biogeochemical processes, understanding their response to climate change provides important insight into the river functioning regulation both now and in the future. Scenarios of in-stream N loads and export changes will benefit from further research into the relationships between climatic conditions and denitrification. The direct connection between climate warming and
  removal efficiency highlighted here demonstrates that differentiating climate change effects on denitrification during the spring and summer months is crucial for evaluating the N load delivery to the sea during those times of the year when the risk of eutrophication is greatest.
Acknowledgments
The research was developed within the research program 'Origin and dynamics of the nutrient loadings delivered by the Po River and other basins flowing into the Adriatic Sea' financed by the Po River District Authority. The authors are grateful to Dr Emilio Viganò (A2A gencogas S.p.A.) for providing water temperature dataset from Piacenza Power Station, to Dr Paolo Bronzi, President of the World Sturgeon Conservation Society, for precious advices and contacts relative to temperature data series, and to the Emilia-Romagna Agency for Environmental Protection for providing water quality data. Finally, the authors would like to thank Editage (www.editage.com) for English language editing.
Data availability statement
The data that support the findings of this study are available upon reasonable request from the authors.
Conflict of interest
The authors declare no conflict of interest.
Credit author contribution statements
Maria Pia Gervasio: investigation, formal analysis, writing−original draft preparation, visualization; Elisa Soana: conceptualization, methodology, investigation, writing−review and editing; Daniela Colombo: investigation; Tommaso Granata: investigation; Giuseppe Castaldelli: conceptualization, writing−review and editing, funding acquisition, supervision.
Supplementary data (0.8 MB PDF)