

Abstract
Nitrogen fertilizer (NF) is a major uncertainty surrounding the greenhouse gas (GHG) emissions of lignocellulosic biofuels. NF enhances agronomic yields and soil C inputs via plant litters, but results in soil organic carbon (SOC) decomposition, soil N2O fluxes, and a large fossil energy footprint. Thus, whether NF is beneficial or detrimental to the GHG mitigation of biofuels is unknown. Here, we show the potential GHG mitigation of fertilizing switchgrass (Panicum virgatum) at the NF rate that minimizes net GHG emissions across 7.1 million ha of marginal lands in the Midwest US, with long-term production advantages surpassing emitted GHG by 0.66 Mg CO2e ha−1 yr−1 on the aggregate. Marginal lands limited by poor N fertility could see a much greater benefit, but not SOC-rich lands, limited by low precipitation, or short growing seasons. The objectives of maximizing yield and minimizing GHG overlap only in a few environments, suggesting that maximum yield will reduce the climate benefit of cellulosic biofuels.
Export citation and abstract BibTeX RIS

Original content from this work may be used under the terms of the Creative Commons Attribution 4.0 license. Any further distribution of this work must maintain attribution to the author(s) and the title of the work, journal citation and DOI.
1. Introduction
Renewable lignocellulosic biofuels are one of the few mature technologies with significant potential to reduce fossil fuel consumption and greenhouse gas (GHG) emissions in the transportation sector (Gelfand et al 2020). Supplying sufficient lignocellulose feedstock to satisfy mandates for low-C biofuels will require massive land-use change, possibly involving the conversion of millions of hectares of existing cropland and marginally productive sites into perennial biomass crops (Gelfand et al 2013). Land-use change in such a scale, however, could have significant impacts on food security, biodiversity, and GHG emissions if bioenergy production directly or indirectly displaces food crops or sensitive habitats (Fargione et al 2008, Melillo et al 2009, El Akkari et al 2018). Furthermore, the potential carbon neutrality of lignocellulose-derived biofuel hinges on the ability of the production system to offset upstream and downstream supply-chain GHG emissions with the sequestration of atmospheric CO2 in soil organic carbon (SOC) pools (Robertson et al 2011), which is a process highly dependent on the pedo-climatic conditions (Agostini et al 2015, Paustian et al 2016). Thus, careful selection of sites and management practices used for feedstock cultivation has become the core of strategies seeking the sustainable and efficient deployment of lignocellulose-based bioenergy systems (Somerville et al 2010, Gelfand et al 2013, 2020, Field et al 2018, O'Neill and Maravelias 2021).
Nitrogen fertilizer (NF) stands as one of the major uncertainties in the production of perennial bioenergy crops. Application of NF can increase plant growth and agronomic yields (Mclaughlin and Kszos 2005, Ruan et al 2016), and the additional biomass may contribute to climate mitigation by increasing availability of biofuel feedstocks and improving efficiency of biofuel supply chains (O'Neill and Maravelias 2021). However, the responses of perennial bioenergy crops to NF additions are quite variable and poorly understood (Fike et al 2017, Monti et al 2019). Enhancing plant productivity with fertilizer additions also generally means increased C inputs to soils via plant litters (Miesel et al 2017), which may result in greater rates of SOC sequestration (Poffenbarger et al 2017). Yet, evidence suggests that in environments with low soil N availability to plants and microbes, NF additions can accelerate the rates of SOC decomposition and reduce soil C stocks, particularly in the mineral-associated fractions (Valdez et al 2017), with large uncertainty of whether NF will result in higher or lower SOC sequestration at a given candidate site. Moreover, NF also promotes microbial nitrification and denitrification processes, resulting in the release of nitrous oxide (N2O), a potent GHG with a global warming potential ∼265 times that of CO2 (IPCC 2014). These emissions are on top of those incurred by the fossil fuel energy used for manufacturing, transportation, and application of the NF itself, which on the aggregate could negate the GHG mitigation benefit from any additional feedstock produced (Crutzen et al 2008).
From a climate mitigation perspective, the question of whether bioenergy crops ought to receive NF—and at what rate—needs to balance the benefits and costs of the practice in terms of GHG emissions. The objective here is to minimize the net GHG contribution of N fertilization to the life-cycle greenhouse warming intensity (GWI, Mg CO2e ha−1 yr−1) of the producing lignocellulosic biofuel. That can be accounted as the differences in GWI between the fertilized ( ) and unfertilized (
 ) systems, as show in equation (1):

Solving this expression (methods) reveals that  can be quantified if we know how much additional GHG is emitted due to NF synthesis and distribution (
 ), field application (
 ), the changes in soil N2O emissions (
 ), SOC sequestration (
 ), and the negative emissions due to the additional replacement of gasoline by the biofuel (
 ):
):
here we examine the potential GHG mitigation benefit of fertilizing perennial bioenergy crops at the NF rate that minimizes GHGNet, at the US Midwest regional scale. Our analysis focuses on the production of upland ecotypes of switchgrass (Panicum virgatum), the leading candidate crop for deployment in the region (Mclaughlin and Kszos 2005), across 7.1 million ha of non-irrigated marginal lands identified in the Midwest. Understanding the magnitude of the potential benefits at each candidate production site, as well as their context-specific drivers, can aid in the design of targeted agronomic recommendations and policy incentives for the effective use of NF in bioenergy feedstock production.
2. Methods
2.1. Predictive model development
Given that data on upland switchgrass productivity and ΔSOC is available only for a few experimental locations in the Midwest, we project its NF response to heterogeneous soils, climate and management using a mixed-modeling approach that combines the strengths of process-based crop simulation models (CSMs) and machine learning (ML; figure 1(a)). To do this, we trained ML algorithms to replicate the ensemble mean of four CSMs using weather, soil, and management data summaries readily computed from available public databases. We selected the gradient boosting machine (GBM) among several algorithms examined because of its superior performance in prediction with this simulated dataset (supplementary figure 1 available online at stacks.iop.org/ERL/17/044004/mmedia). The CSM ensemble consisted of four process-based models (APSIM (Ojeda et al 2017)), DAYCENT (Field et al 2016), EPIC (Jones et al 2018) and SALUS (Martinez‐Feria and Basso 2020), all of which have been previously used to simulate upland ecotypes of switchgrass in the Midwest, and represent diverse model structures. We tested each of these CSMs and their ensemble against a dataset with plant and SOC measurements that encompass three decades of experimentation in the region and a range of NF application rates (figures 1(b), (c) and supplementary table 1). Further details about the development of the predictive models for switchgrass yield and ΔSOC are included in the supplemental information.

Figure 1. Approach used to project yields and ΔSOC of switchgrass upland varieties across marginal lands in the US Midwest. (a)–(f) Graphical summary of the approach. Four process-based CSMs were tested against measurements (b) from 28 experimental sites (c) and (d), and then used to generate simulations across a sample of 5000 agricultural sites. The CSM ensemble (e) was used to train a ML algorithm, GBM (f). The ML emulation technique reduced the computational burden of the in-silico experiments across a large set of marginal-land locations, weather-years, and management, allowing us to efficiently scale up the bottom-up estimates derived from the CSM ensembles without compromising accuracy. Color shading in (c) shows concentration of the marginal lands identified (methods), aggregated at the 0.01° spatial resolution. Line-range in (e) indicate the spread in the predictions among the CSM models.
Download figure:
Standard image High-resolution image2.2. In-silico nitrogen fertilizer rate experiments on marginal lands
We applied the developed predictive models to estimate geographical variations in switchgrass agronomic yield and SOC sequestration on Midwestern marginal lands across a gradient of NF additions. Growing bioenergy crops on marginal lands has been proposed as a strategy (Gelfand et al 2013) to avoid indirect emissions occur when biofuels production displaces agricultural production and causes additional land-use change that leads to an increase in GHG emissions elsewhere (Melillo et al 2009). Here, we consider marginal lands that could be good candidates for switchgrass establishment as those with soils under recent or current agricultural use, but with very severe limitations to row-crop production. Similar to previous studies (Gelfand et al 2013, Liu and Basso 2017), we identified these prospective sites by selecting fields that were planted with corn at least once during the period between 2008 and 2018 according to the crop frequency layer in the CropScape database (Han et al 2012). Then, we subset these soils to only those identified with land capability class (LCC) IV–VIII in the SSURGO database (Soil Survey Staff) (see supplementary table 2 for detailed LCC descriptions). Because we assume that marginal lands are not typically irrigated, we use the dominant capability class for non-irrigated conditions for each soil map unit (variable name: niccdcd). In total, area used for this experiment consists of 7.08 million ha distributed across the 12-state region (figure 1 and supplementary figure 2). The marginal land identified was layered with gridded NLDAS2 dataset (Xia et al 2012) (0.125° × 0.125° resolution), which resulted in 175 130 unique 'experimental' units, each representing an area of up to 6235 ha, or 40.4 ha on average. For each of these units, we conducted experiments in which we vary NF application rates from 0 to 200 kg N ha−1, in 10 kg N ha−1 increments, while randomly sampling other management inputs from the same distributions as for the crop model simulations (see supplementary text and supplementary figure 3). The prediction time windows were 20 randomly selected, contiguous weather years from 1980 to 2019. Because we are interested in characterizing responses of established stands, we discarded the first 2 years of the prediction. In total this amounted to more than 63 million individual predictions.
2.3. Estimating net emissions associated with nitrogen fertilizer additions
The impact of fertilizer additions on the life-cycle emissions of biofuel production was calculated as the net difference between the total GWI under a given NF rate minus the GWI under unfertilized management (N0) as shown in equation (1). The GWI of switchgrass production can be accounted as the sum of the GHG emitted by fossil fuel used for field operations (GHGFuel),seed production (GHGSeed), agrochemicals other than NF (GHGAgCh) and NF synthesis (GHGFertSyn), NF application operations (GHGFertApp), the biogenic direct and indirect N2O emissions (GHGN2O) and changes in soil C sequestration (GHGΔSOC) associated with fertilizer management, and downstream emissions related to conversion of the biomass feedstock into biofuel (GHGFeedstock):
Because GHGFuel, GHGSeed and GHGAgCh are not a function of NF, these can be ignored in the calculation of GHGNet. Additionally, GHGFertSyn and GHGFertApp equal zero under N0. Therefore:
GHGFertSyn was assumed to be 4.5 kg CO2 per kg of N, and GHGFertApp as 26 kg CO2e ha−1. Direct and indirect N2O emissions were estimated following the tier 1 method in the IPCC Guidelines for National Greenhouse Gas Inventories (IPCC 2019), which include N2O from nitrogen fertilizer, dead biomass residues and SOC loss (supplemental table 3). GHGΔSOC were the predicted yearly changes in SOC times 44/12 to convert to CO2e. Finally, for a given NR, GHGBioFuel is calculated as the product of the predicted agronomic biomass yield (YieldAg; Mg dm ha−1) and the net GHG offset (GHGoffset; Mg CO2e Mg−1 dm), that is, the emissions avoided from gasoline combustion:

The offset was estimated as −0.737 Mg CO2e Mg−1 of biomass. This value assumes a 1:1 replacement of gasoline by bioethanol on an energy basis and accounts for the supply-chain emissions associated with feedstock transportation (GHGTransp) and storage (GHGStorage), transportation and storage, conversion in biorefinery (GHGBioref), distribution of biofuel (GHGDist), and the CH4 and N2O emissions produced by biofuel combustion (GHGCombust):
where LT and LS (unitless) are the portion of biomass lost during transportation and storage, respectively; YieldBioFuel is the yield from biomass-to-ethanol conversion, NCVBF is the net caloric value of bioethanol and GWIGasoline is the life-cycle GHG emissions intensity of gasoline. Values for each of the parameters in equation (6) were populated from values reported in the GREET (Greenhouse gases, Regulated Emissions, and Energy use in Transportation) model database (Argonne National Laboratory 2020) and studies shown on supplementary table 3.
3. Results
3.1. Projected switchgrass response to nitrogen fertilizer additions on marginal lands
Consistent with previous CSM intercomparison studies (Rosenzweig et al 2013, Bassu et al 2014, Martre et al 2015, Basso et al 2018), the ensemble means of the CSMs proved superior to the prediction of any single model, reducing root mean square error of the prediction by 16% and 12% for yield and ΔSOC, respectively (supplementary figure 4). Loss of prediction accuracy by the GBM emulator was negligible (figure 1(f)), as demonstrated by the performance against the measured data which was similar to that of the CSM ensemble (supplementary figure 5).
Projected across all the marginal lands identified in the Midwest and 20 years of weather (figure 2), site-mean agronomic yields without NF are expected to range between 2.1 and 11.9 Mg ha−1, averaging at 5.6 Mg ha−1 (figure 2(a)). Our predictions, however, show substantial spatial variability due to differences in soil characteristics and climates (figure 2(b)). Highest yields of unfertilized switchgrass are predicted mainly in the upper Midwest, eastern areas of the Northern plains, and scattered pockets of Indiana and Ohio. Unfertilized yields are projected to be relatively low in the drier parts of the central and northern plains (west of the 99th meridian) and western Illinois. Further, most marginal land cultivated with upland switchgrass (∼95%) is expected to accumulate SOC under unfertilized conditions, with ΔSOC projected across all marginal land averaging 0.58 Mg C ha−1 yr−1 (figure 2(d)). Negative ΔSOC under unfertilized conditions is predicted in some areas in North Dakota and South Dakota, and isolated areas in Minnesota, Wisconsin, Ohio and Michigan (figure 2(e)).

Figure 2. Switchgrass agronomic yields and ΔSOC and their response to increasing doses of N fertilizer, as predicted by the emulator. (a)–(f) Predicted distributions (a), (d) and geographical extent (b) and (e) of agronomic yields (a)–(c) and ΔSOC with nitrogen fertilizer (0 N) applied, and in response to N fertilizer rate (c) and (f). Maps in (b) and (e) show the pixels aggregated as the area-weighted average at the 0.01° spatial resolution for display. Color gradient in (c) and (f) indicate the individual conditional expectation to the marginal effect to N fertilizer, binned by percentile. The median response is shown as a red solid line.
Download figure:
Standard image High-resolution imageAnalysis of emulator predictions reveals that NF rate is among the most important determinants of agronomic yields, ranking 3rd most important among all 40 variables included, and accounting for 17% of the total variance (supplementary figure 6). With annual applied NF (up to 200 kg N ha−1) upland switchgrass is modeled to respond positively in most marginal sites following diminishing-returns pattern. With full NF, the projected long-term mean yield boost averages 3.1 Mg ha−1 (or 54%), although yield increases are generally predicted to be small beyond 100 Kg N ha−1 rate (12% on average, figure 2(c)). This result is supported by findings from literature syntheses that suggests that 100–180 kg N ha−1 are generally needed to maximize yields (Parrish and Fike 2005, Chen et al 2019, Monti et al 2019).
Conversely, ΔSOC is projected to have a decreasing trend with increasing NF rate. This is consistent with the theory that NF in switchgrass has an overall dampening effect on the sequestration potential of in soil C pools via enhanced SOC decomposition (Valdez et al 2017). Yet, the mean effect is minimal, decreasing from 0.58 Mg C ha−1 yr−1 with no NF to 0.46 Mg C ha−1 yr−1 with full NF (figure 2(f)). In fact, NF rate seems to have much less influence in the emulator for predicting ΔSOC, ranking 9th in variable importance and accounting for less than 2% of the variance (supplementary figure 6). Nevertheless, both predicted responses to NF exhibit substantial spatial variation, explained in part by fundamental differences in soil characteristics and climates. For example, the yield response to NF is expected to be much more marked in sites with high precipitation, coarser texture and low SOC, whereas the negative ΔSOC response is more pronounced with increasing stand age, in sites with low precipitation and in soils with mesic levels of SOC (∼1%–2% C; supplementary figure 7).
3.2. Optimized nitrogen fertilizer rate based on minimizing net GHG emissions
Next, we contextualize these projected site-specific NF responses in terms of how they could impact the GHG emissions of the biofuel production system as defined in equation (2). In this calculation, we include the projected changes in yields and SOC sequestration, and the biogenic N2O emissions due to NF application using the IPCC tier 1 methodology (IPCC 2019). In addition, we apply a life cycle assessment (LCA) methodology to account for the upstream emissions due to fertilizer synthesis, transportation and application, and changes in the downstream emissions related to the manufacturing of the biofuel, its combustion, and the value replacement of gasoline fuel (methods).
A graphical example of the calculated net GHG balance as a function of NF rates is shown on figure 3. Here we display the mean GHG balances across all marginal land sites. In figure 3(a) we show both GHGFertSyn and GHGN2O increasing monotonically with NF applied, whereas GHGBioFuel (i.e. the emissions offset credit due to the additional biofuel produced) becomes more negative mirroring the yield response (figure 2(c)). Furthermore, GHGΔSOC is counted as net positive emissions, given the small dampening effect of NF on the SOC sequestration rate predicted by the model (figure 2(f)). Including all GHG sources and credits indicates net GHG emissions mitigation (i.e. negative GHGNet) for a wide range of NF levels up to 140 kg N ha−1.
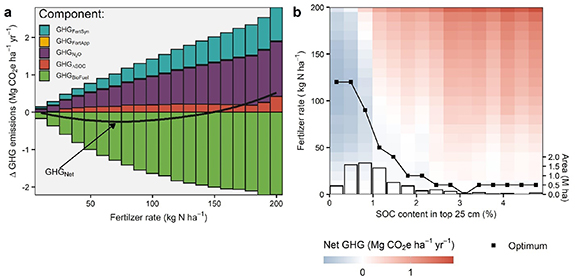
Figure 3. Example of N fertilization rate optimization based on minimization of net GHG emissions. (a) Net balance between the avoided gasoline due to the additional biofuel produce, and the additional emissions associated to nitrogen fertilizer synthesis, changes in SOC sequestration, and release of soil N2O from soils. Responses are averaged across all marginal lands. (b) Change in the net GHG across fertilizer levels for a gradient of SOC content in the topsoil. Line indicates changes in the optimum predicted for each level of SOC content. Histogram shows the distribution of binned SOC content levels across the marginal lands examined.
Download figure:
Standard image High-resolution imageFocusing solely on the average response, however, would masks important variation. Indeed, further examination of a gradient of SOC content levels reveals that yield increases in sites with greater than 2% SOC in the top 25 cm are, on average, predicted to be insufficient to overcome the additional life-cycle emissions incurred by applying fertilizer (figure 3(b)). Thus, from a GHG mitigation perspective, these C-rich soils should not generally receive NF. Yet, these sites represent a small fraction of marginal lands in our dataset (<5%). Optimal N rates are projected to increase monotonically with decreasing topsoil SOC content, up to ∼120 kg N ha−1 in soils with very low topsoil SOC content (figure 3(b)).
Across all marginal lands, the modeled optimum NF rate averages at 74.8 kg N ha−1, although its distribution is quite wide and spatially variable as shown in figure 4(a). Areas with low optimal rates (<50 kg N ha−1) are mainly projected in western states, and large areas in Minnesota, southern Iowa and northern Missouri, and isolated areas in the eastern states. These low optimal rates occur mostly in sites with low precipitation, SOC-rich soils, or a combination of both as is the case of areas of North and South Dakota. Indeed, these conditions in many marginal lands in the Great Plains, and to a lesser extend areas of Missouri and northern Wisconsin, lead to environments where the optimum NF rate is much less likely to be greater than zero (figure 4(b)). On the other hand, high optimal NF rate (>100 kg N ha−1) is projected mainly for the eastern states, particularly in the southern tip of Indiana, Illinois and Missouri (figure 4(a)).

Figure 4. Production outcomes at the projected optimal N fertilizer rate. Maps show (a) the geographical spatial distribution of the predicted optimal NF rate, (b) the expected probability of that the optimum NF rate is greater than zero, and changes in (c) agronomic yields and (d) soil C sequestration rate at the optimum NF, compared to the unfertilized baseline. Pixels (0.01° spatial resolution) show the area-weighted average of the predictions.
Download figure:
Standard image High-resolution imageWith optimal NF rate, agronomic yields across all marginal lands are expected to increase by an average of 1.99 Mg ha−1 (figure 4(c)), which aggregated at the regional scale would amount to 14.1 million tons of additional lignocellulosic feedstock. Accounting for transportation and storage biomass losses and assuming a conversion yield of 355 l per Mg of biomass at the biorefinery (Argonne National Laboratory 2020) (supplementary table 3), the boost in productivity would amount to nearly 4.6 million m3 of additional bioethanol. This represents about 12% of the total statutory cellulosic biofuel production goal of 39 million m3 for 2020 in the US (National Research Council 2012). The optimal NF is also projected to have a more mixed effect on SOC sequestration, with only a few marginal lands seeing increase SOC sequestration, particularly in the Great Lakes states (Michigan, Minnesota, Wisconsin), areas of Iowa, and the southern tip of Indiana, Illinois and Missouri. Overall, however, the effect for the entire region is projected to be neutral, with a mean change in soil C sequestration rate of 0.006 Mg C ha−1 yr−1.
Given these responses, optimum NF additions would mitigate emissions by 0.66 Mg CO2e ha−1 yr−1 on average across all marginal lands (figure 5(a)). Areas surrounding the Great Lakes are projected to have the greatest NF-related GHG mitigation potential (up to 2.8 Mg CO2e ha−1 yr−1), likely a result of concomitant gains in SOC sequestration and a large yield response to NF (figure 4). On the aggregate, optimal NF additions could provide up to 4.63 Tg CO2e yr−1 of GHG mitigation compared to unfertilized switchgrass production across all marginal lands examined.
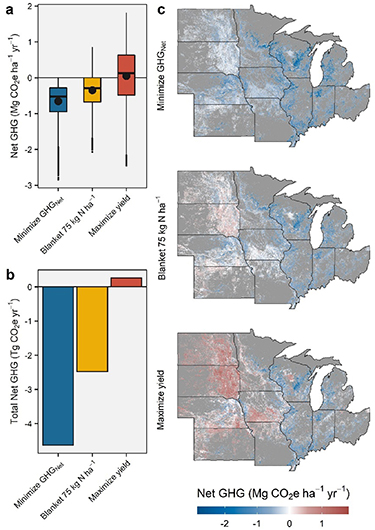
Figure 5. Predicted regional life-cycle net GHG emissions of fertilizing switchgrass under three alternative strategies. (a)–(c) Net GHG emissions incurred by fertilizing (1) at the site-specific optimal N rate (i.e. the rate that minimizes net GHG emissions), (2) using a blanket rate with 74 kg ha−1 yr−1, and (3) at the rate that maximizes yield, shown per hectare (a) and total area (b). Maps in (c) show the geographical distribution of the spatially weighted average net GHG resulting from fertilizing using each scenario.
Download figure:
Standard image High-resolution image
Overall, these results reveal the significant contributions that optimal NF could provide to the GHG mitigation of future lignocellulosic biofuel production in the Midwest. However, these projections should be considered as a hypothetical ceiling given that on-the-ground implementation of site-specific optimal NF management could face important challenges due to the uncertainty in production costs (Fike et al 2017). Therefore, we further examine how optimum NF would compare to a more simplistic blanket recommendation of 75 kg N ha−1. This value not only represents the average optimum NF rate across all marginal lands, but also approximates the long-term average N removal of the harvested biomass (Monti et al 2019).
The blanket-rate strategy is projected to result in a net GHG mitigation of 0.35 CO2e ha−1 yr−1 on average, or 2.48 Tg CO2e yr−1 on the aggregate, when compared with the unfertilized scenario (figures 5(a) and (b)). This GHG mitigation is about 54% of that projected to be achievable with the optimal rate. Both of these scenarios compare favorably to a situation where NF is applied at the rate that maximizes long-term yields (∼160–180 kg N ha−1; supplementary figure 8 and Monti et al 2019), resulting in a slight increase in the GHG emissions over the unfertilized scenario (0.036 CO2e ha−1 yr−1 on average or 0.26 Tg CO2e yr−1 aggregated; figures 5(a) and (b)). It should be noted that this latter scenario exhibits the strongest spatial divergence, with areas of large positive net GHG in the Great Plains states and southern Iowa, and large negative net GHG in the Great Lakes states and areas of Illinois and Indiana (figure 5(b)).
4. Discussion and conclusion
Our findings seem to challenge the prevalent belief that NF application is generally detrimental to bioenergy GHG balances and that its use should be avoided in the production of lignocellulosic feedstock (Erisman et al 2009, Smith et al 2010). On the contrary, here projections suggest that the long-term yield advantages of relatively low amounts of NF in marginal lands would surpass the GHG emissions stemming from its use. Even a blanket recommendation of 75 kg N ha−1 that would forego nearly half of the potential GHG mitigation benefit, is predicted to be a net positive on the aggregate for Midwestern marginal lands (figure 5(c)). The empirical evidence, though limited, seems to concur. Indeed, a field study in Michigan (Ruan et al 2016) that examined field-level GHG measurements found that NF additions could support GHG mitigation of switchgrass production up to 140 kg N ha−1, although GHGNet was minimized with a NF application of 56 kg N ha−1. Importantly, our projections seem to imply that the benefit could be much greater in marginal lands that are limited by poor N fertility as is the case of much of Michigan, Wisconsin, and isolated areas of the eastern Corn Belt (figure 4). Meanwhile, areas with SOC-rich soils (Iowa, Minnesota) and/or limited by low precipitation (Nebraska, Kansas) or short growing seasons (North and South Dakota) are predicted to be less likely to respond to NF. Thus, the potential GHG mitigation benefit in these marginal lands is minimal. Lastly, it should be noted that the objectives of maximizing yield and minimizing GHGNet do not seem to overlap in all but a few environments (figure 5(c)). As such, widespread implementation of fertilizing strategies aiming to maximize yield will likely result in the overall reduction of the climate benefit of cellulosic biofuels (figures 5(b) and (c)). (We include a map classifying Midwestern marginal lands in four levels of optimal N rates in the supplementary figure 9 to facilitate discussions with stakeholders).
Of course, it is likely that the optimal NF rates estimated here, which are based on minimizing GHG emissions, are different from those NF rates that are most economically efficient (i.e. where NF marginal revenue equals marginal cost). Indeed, a recent study (Fike et al 2017) that examined production sites in five states concluded that typical NF recommendations (56–112 kg N ha−1) added between $37 and $74 ha−1 to production costs and required switchgrass biomass prices in excess of $70 Mg−1 to be economically justifiable under the observed yield responses. Whether the bioenergy industry or ancillary carbon markets can support such pricing is yet to be determined and lies beyond the scope of our analysis.
We advocate caution when interpreting these results given the various sources of uncertainty contained in our projections. Foremost are the uncertainties associated with our characterization of the responses to NF additions across the pedo-climatic conditions of Midwestern marginal lands. Although the process-based CSMs here used are reasonably capable of capturing the variation in biomass production and SOC changes and their dynamic interaction with agricultural management (supplementary figure 4 (Surendran Nair et al 2012, Field et al 2016, Jiang et al 2017, Liu and Basso 2017, Ojeda et al 2017, Jones et al 2018, Jarecki et al 2020, Martinez‐Feria and Basso 2020)), their complex structure, large sets of parameters, and statistical misspecification (Wallach 2011) generally means that prediction uncertainty is large when CSMs are applied outside the calibrated domain. These uncertainties are partially addressed by using the ensemble mean of independent CSMs, which has been shown to provide more accurate predictions outside of sample populations (Rosenzweig et al 2013, Bassu et al 2014, Martre et al 2015, Basso et al 2018). The emulation step unlikely added significant uncertainty at this scale because of the independence between CSM and ML errors, which would tend to cancel out when aggregating across soil types and geographical locations.
Nevertheless, there are a few known weaknesses shared by all CSMs that could bias our projections. Chief among them is the representation of associative N fixation (ANF) by free-living diazotrophs, which is increasingly recognized as a potentially important source of N to switchgrass (40–60 kg ha−1 yr−1), especially in N-limiting environments (Roley et al 2018, Bahulikar et al 2021). Yet, in contrast to biological N fixation (BNF) in legumes, ANF is largely episodic and irregularly detectable (Roley et al 2019), and our current understanding of the environmental factors controlling ANF rates is rather incomplete (Bahulikar et al 2021). Thus, current switchgrass CSMs, either do not account for this pathway (EPIC) or use instead BNF routines as a surrogate (APSIM, SALUS). Only the DAYCENT model has an explicit routine that, in the absence of soil phosphorus data, calculates free-living N fixation rates as a linear function of annual precipitation (Necpálová et al 2015). We are not aware of any work verifying the robustness of these routines for capturing ANF environmental variation in switchgrass, or whether it is even possible at this stage given the paucity of data available. The likely effect of underestimating non-NF sources under certain environments would be the overestimation of the yield response, which would lead to an overestimation of the optimal N rate. Although we found no widespread evidence of overestimation of the site-specific yield response in the experiments (supplementary figure 10), a conservative interpretation of our data may still be warranted until further examination of this mechanism within the models can be performed.
An additional source of potential bias in our optimal NF rate estimates is the use of the offline calculation of direct and indirect soil N2O emissions following the IPCC tier 1 methodology. We opted not to use simulated N2O because not all the CSMs we selected contain an explicit nitrification-denitrification routine, or have not been comprehensively validated in production of perennial bioenergy grasses. On the other hand, the uncertainties of the IPCC methodologies are more thoroughly understood. Namely, that the response of annual N2O fluxes to NF applied tends to be exponential rather than linear (Philibert et al 2012). Thus, the use of a constant emission factor as required by IPCC tier 1, tends to overestimate N2O fluxes at lower NF rates, and underestimate them at higher rates. This pattern seems to hold in switchgrass production (Ruan et al 2016). Using a non-constant emissions factor that increases with NF rates to calculate N2O fluxes (as shown by Ruan et al 2016) results in overall lower optimum NF rates with a much narrower distribution (supplementary figure 11). Nevertheless, it is not known how well this exponential relationship, which is derived from a few experiments, would represent emissions at the regional scale. Thus, more work is needed to improve the characterization of soil N2O emissions when estimating GHG balances of bioenergy.
A final, possibly large source of uncertainty are the assumptions made for calculating the biofuel GHG offset, which essentially scales the projected yield and ΔSOC responses into GHG emissions (supplementary table 3). Here, we used a purely static LCA approach, which assumes constant values derived from the GREET model (methods) notwithstanding the spatial distribution of future infrastructure (e.g. depots, biorefineries, etc) or biomass end use (e.g. pelletization, direct combustion, energy cogeneration). These would result in changes in the efficiency of utilization of the feedstock supply (O'Neill and Maravelias 2021), particularly because lower switchgrass yields would require larger collection radius, and therefore greater GHG emissions of switchgrass transport (Gelfand et al 2013). Yet, the uncertainty associated with these parameters may be substantial. A sensitivity analysis where each of these values are randomly varied within ±20% of the original value reveals a potentially large departure from the mean GHG response (supplementary figure 12), though the computed optima tend to cluster around the mean found in our main analysis (75 kg N ha−1) suggesting low bias. Yet, two parameters the yield from biomass-to-ethanol conversion (YieldBioFuel) and the life-cycle GHG emissions intensity of gasoline (GWIGasoline), resulted to have the greatest impact in the calculation of the biofuel offset (supplementary figure 10). Thus, much of the uncertainty can be reduced by finding best values for those parameters.
Despite the uncertainties, our study represents an important step forward, as it is the first to examine prospective responses of switchgrass at such scale and resolution, and the emulator model developed could provide the groundwork for building dynamic tools to guide future decisions in agronomic management, technoeconomic analysis, and policy formulation (Ruan et al 2016). Only through this kind of high-resolution predictive tools, biofuel supply-chain network design can move toward integrating temporally and spatially explicit data to reflect the reality of heterogeneity in biomass productivity and SOC sequestration capacity across the landscape, and to allow consideration of land allocation and crop management decisions in addition to infrastructure and operational decisions (O'Neill and Maravelias 2021). This is becoming more critical given the interest in targeted integration of perennial bioenergy crops within the margins of row-crop fields or other marginal subfield areas (Brandes et al 2018, Basso and Antle 2020), which could not only avoid GHG through the production of biofuels, but also by replacing low yielding, highly polluting croplands (Basso et al 2019). Therefore, further research is needed that comprehensively evaluates the modeling uncertainties here outlined to advance prospects for efficient site-specific NF management in perennial bioenergy crops, and to maximize the GHG mitigation potential of this technology.
Acknowledgments
This research was supported in part by the Great Lakes Bioenergy Research Center, US Department of Energy, Office of Science, Office of Biological and Environmental Research (Awards DESC0018409 and DE-FC02-07ER64494), the USDA National Institute of Food and Agriculture (Awards: 2015-68007-23133, 2018-67003-27406, 2019-67012-29595) and Michigan State University AgBioResearch. Authors would like to thank Max de Antoni Migliorati (DAYCENT model support), Sasmita Sahoo (EPIC model support), the APSIM initiative, and Lydia Price (spatial data support).
Data availability statements
The data that support the findings are within this study in the cited references. R code and the database needed to run the developed GBM emulators has been made public at the following repository: https://doi.org/10.5281/zenodo.5116736.
The data that support the findings of this study are available upon reasonable request from the authors.
Conflict of interest
The authors declare no competing interests.
Author contributions
R M F and B B conceived and designed the research; R M F assembled the datasets and developed predictive models. S K defined LCA values. R M F analyzed the predicted datasets and visualization of the results. All authors contributed to interpretating the results and writing the manuscript.