

Abstract
The COVID-19 pandemic has reduced travel but led to an increase in household food and energy consumption. Previous studies have explored the changes in household consumption of food and energy during the pandemic; however, the economy-wide environmental implications of these changes have not been investigated. This study addresses the knowledge gap by estimating the life cycle environmental impacts of U.S. households during the pandemic using a hybrid life cycle assessment. The results revealed that the reduction in travel outweighed the increase in household energy consumption, leading to a nationwide decrease in life cycle greenhouse gas emissions (−255 Mton CO2 eq), energy use (−4.46 EJ), smog formation (−9.17 Mton O3 eq), minerals and metal use (−16.1 Mton), commercial wastes (−8.31 Mton), and acidification (−226 kton SO2 eq). However, U.S. households had more life cycle freshwater withdrawals (+8.6 Gton) and slightly higher eutrophication (+0.2%), ozone depletion (+0.7%), and freshwater ecotoxicity (+2.1%) caused by increased household energy and food consumption. This study also demonstrated the environmental trade-offs between decreased food services and increased food consumption at home, resulting in diverse trends for food-related life cycle environmental impacts.
Export citation and abstract BibTeX RIS
1. Introduction
The coronavirus (COVID-19) pandemic has had an enormous impact on society. As of July 2021, more than 4 million COVID-19 deaths have been reported globally [1], of which over 600 000 deaths have occurred in the United States [2]. Social distancing and mobility restrictions have been enforced across the world [3], which have disrupted people's daily routines and social contact, leading to a dramatic shift towards increased household and indoor activities. Many studies have investigated the impacts of pandemic lockdown and restrictions on the environment [4, 5], energy [6, 7], social well-being [8, 9], and economy [10–12]. However, to the best of the author's knowledge, no study has explored the life cycle environmental implications of energy and food consumption in U.S. households that have substantially changed in the pandemic.
Several studies have examined the impacts of COVID-19 on direct household energy consumption in different countries, such as China [6], Australia [13], Serbia [14], Canada [15], Poland [16], and the United States [17]. Several studies reported an overall increase in household electricity usage due to higher occupancy but different heating and cooling energy trends given regional differences in weather and human behavior [13–15, 17]. Although the changes in household energy consumption in the pandemic are temporary, some impacts may last longer, depending on the potential transition to remote working and extended indoor stays after the pandemic [6]. These impacts can also lead to energy security issues, especially in low-income populations [18, 19]. Although previous studies have primarily focused on variations in direct household energy consumption during the pandemic, few have investigated the corresponding changes in environmental burdens, such as greenhouse gas (GHG) emissions and resource use across the life cycle of fuel and electricity.
Studies on household food consumption during the pandemic primarily explored the impact of COVID-19 on food security, consumption, and waste generation. Numerous studies investigated household food availability, utilization, and stability in different countries, and identified an increase in household food insecurity in developing countries [20–24] and minority groups [25]. Some studies discussed supply chain disruptions during the pandemic, such as the shortage of workers, shutdown of food production facilities, and restricted policies on food trade, which resulted in food price increases and panic buying [26, 27]. Others used surveys to collect self-reported data and observed an increase in food purchases but a decrease in food wastes [28, 29] and improved awareness of food waste generation [30, 31] during the pandemic. Cosgrove et al reported that although the perceived food waste in households decreased significantly, food stockpiling, which is an indicator of food waste, increased during the pandemic [32]. Everitt et al conducted a direct measurement of food waste generated by 100 single-family households across the city of London in Ontario, Canada and revealed that 52% of the wastes were avoidable [33]. They also concluded that previous studies relying on self-reported data could have underestimated the household food waste generation in the pandemic [33]. Roe et al demonstrated that disruptions during the pandemic were likely to result in an intermediate surge in food waste but could improve household food management [34]. In addition to food waste, other materials used along the food supply chain (e.g. packaging materials) will likely change due to the changing demand for food [26]. Environmental and human health impacts of agricultural systems are often driven by food consumption patterns [35]. However, no study has examined the impacts of changes in household food consumption on the life cycle environmental impacts across the food production supply chain (from agriculture activities to food production).
Before the pandemic, household energy and food consumption had significant environmental impacts. In the United States, 16% of the national energy consumption was attributed to residential use in 2019 [36]. In the same year, residential CO2 emissions were as high as 336.8 million metric tons (Mton), accounting for 6% of the national GHG emissions [37]. Dietary choices and consumption patterns primarily affect food production, which contributes to global GHG emissions, environmental degradation, and mortality [38]. Restrictions in human activities due to the pandemic affect household consumption, which may affect the environmental burdens across the life cycle of energy and food products. Thus far, such environmental burdens have not been thoroughly investigated in the literature. Understanding how changes in household consumption can alter the life cycle environmental impacts of household activities will inform workforce management from a sustainability perspective after the pandemic.
This study fills the critical knowledge gap using a hybrid life cycle assessment (LCA) that uses environmental input-output LCA (EIO-LCA) and process-based life cycle inventory (LCI) data to quantify the changes in the potential life cycle environmental impacts of U.S. household energy (i.e. direct energy use and transportation) and food consumption in 2019 (before the pandemic) and 2020 (during the pandemic). This study does not intend to address the life cycle environmental effects of everything that happened in 2020 in the United States. USEEIO v2.0 [39] was used to estimate the environmental burdens of upstream activities (cradle-to-gate) of energy and food products. The GHG emissions from fuel combustion (e.g. gasoline in transportation and natural gas for heating) were included using a process-based approach. The path exchange method [40, 41] was used to include the latest energy and GHG emission data of the electricity generation sector. In total, 18 environmental impact categories were investigated, including GHG emissions, energy use, human health impacts, use of natural resources (i.e. land, water, minerals, and metals), commercial waste, smog formation, acidification, eutrophication, ozone depletion, and freshwater ecotoxicity.
2. Methodology
This study used USEEIO v2.0, which is the latest U.S. Environmentally Extended Input-Output (EEIO) with high-resolution industrial sectors (421 sectors) [39], to estimate the life cycle (cradle-to-gate) environmental impacts using equation (1) [42]:

where, A is the direct requirement matrix that includes the economic transactions among 421 sectors (dimension 421 × 421). This study used the domestic A matrix in USEEIO as the scope is the domestic environmental impacts within the United States;  is the identity matrix;
  is the final demand, which is a vector that has all entries as zero, except for the sectors that are studied for household consumption (see table S1 available online at stacks.iop.org/ERL/17/034025/mmedia for sector matches); C is the indicator matrix that includes the characterization factors for 18 environmental impact categories investigated in this study (dimension 18 × 2668); B is the environmental flow coefficient matrix that includes 2668 emission factors per dollar of output for 421 sectors (dimension 2668 × 421).
The final demand was estimated based on the household consumption data of 2019 (before the pandemic) and 2020 (during the pandemic). Household food expenditure data for food at home (FAH) and food away from home (FAFH) were collected for 2019 and 2020 [43] from the U.S. Department of Agriculture (USDA) (table S2). Expenditure data for alcohol consumed at home and away from home were collected from the same source [43]. As the collected data are aggregated expenditure for the entire U.S. household sector in 2019 and 2020, FAH expenditure was further broken down into specific food items based on the U.S. Consumer Expenditure Surveys [44] (table S4, which shows the average percentages of U.S. household expenditure breakdown by food items for 2018–2019). As the data on expenditure breakdown for different food items consumed at home are not available for the year 2020, in this study, the same percentages of different food items (table S4) were used for FAH in 2020, except for fresh fruits and tree nuts that were adjusted based on the latest USDA data [45]. Although this study has certain limitations, the overall changes in household expenditure are well reflected by the aggregated FAH and FAFH data collected from the USDA [43]. In the future, these limitations can be addressed when U.S. household expenditure details are available for the year 2020.
Household expenditure data for direct energy use, including electricity, natural gas, fuel oil, propane, and kerosene were estimated based on residential energy consumption and price data collected from the U.S. Energy Information Administration (EIA) [46]. Detailed data on residential consumption and prices of electricity, natural gas, and other fuels before and during the pandemic are documented in tables S6 and S7. Natural gas delivered to U.S. households is mostly used for space heating and water heating (e.g. about 50% of U.S. homes use natural gas for heating), drying clothes, and cooking [47]. Electricity usage in U.S. households varies by region and house type; on average, the largest electricity end uses in the United States include air conditioners, heaters (including both space and water heaters), lights, and refrigerators [48]. In 2015, air conditioning contributed to 17% of the total U.S. residential electricity usage, and the shares for space and water heating were 15% and 14%, respectively [48]. Other fuels used for heating include fuel oil, propane, and kerosene. Propane is used for cooking in the United States [49]. Additionally, U.S. personal spending data on transportation items were collected from the U.S. Department of Transportation (table S8) [50]. Each food and energy item was matched with the economic sector based on the North American Industry Classification System (NAICS) [51]. All expenditure data were converted to 2012 using the Consumer Price Index (CPI), which measures the difference in the prices paid over time by purchasers for various goods [52]. The conversion equation is documented in section 1 of the Supplementary Materials (SM). Furthermore, the data were converted to the producer price using the ratios of producer price to purchaser price for different U.S. sectors, provided by USEEIO [39]. The producer price-based expenditure used in the final demand vector is shown in table S5.
As the latest USEEIO is in the year 2012, this paper first tested the applicability of USEEIO in estimating the total requirement (in millions of dollars) of several important industrial sectors directly related to household food and energy consumption (e.g. fertilizer manufacturing and electricity generation). The total requirement was estimated using the Leontief matrix  timed with final demand y, as shown in equation (1). The Leontief matrix converts the direct requirement matrix A into the total requirement matrix that estimates all upstream purchases related to the final demand [42]. In addition to the total requirement, the results of total energy use, including both renewable and renewable energy, were compared with benchmarks. Estimating the benchmarks for the life cycle of U.S. household energy and food consumption is challenging, as most data (e.g. sales of electricity and fertilizers) are reported by literature at the national level that covers all uses. Therefore, in this study, the benchmarks were estimated by allocating national-level energy, meat, fresh fruits, and tree nuts, and fertilizer consumption to activities that were the most relevant to the life cycle of U.S. household energy and food consumption. The estimated benchmarks were then used for the validation test. The test included energy, food, and fertilizer items only, owing to limited data availability. Detailed estimations of the benchmarks are documented in SM section 4 titled Benchmark Estimations.
After validation, USEEIO was used to estimate the cradle-to-gate impacts, including raw material extraction, transportation, and production. The GHG emissions of fuel combustions were added to the cradle-to-gate GHG emissions generated by the USEEIO, because previous studies showed significant contributions of fuel combustion to the life cycle GHG emissions of energy products, such as gasoline and natural gas [53, 54]. SM section 2 documents the GHG estimations of fuel combustion. To include changes in electricity production during the pandemic, the path exchange method [40, 41] was used to replace the energy use (including renewable and non-renewable energy) and GHG emissions associated with the electricity sector by the process-based energy and GHG emission data derived from the latest data reported by the U.S. EIA [46, 55] for 2019 and 2020 (SM section 1).
3. Results
The total requirement of several sectors was compared with product sales in the same year allocated to U.S. households. The total energy consumption, including both renewable and non-renewable energy, was compared with the benchmarks based on real-world energy consumption data in the U.S [46, 56]. The results and estimated benchmarks in table 1 are for the activities involved in the life cycle of U.S. household food and energy consumption, which are different from the direct energy and food consumption of the entire U.S. For example, the total economic requirement of the electricity sector in table 1 reflects the total electricity output (produced by the electricity generation sector) required by all other sectors involved in the upstream supply chain of energy and food consumed by U.S. households. Such requirements increased in 2020, which was consistent with the benchmarks estimated in table 1. This trend was different from the total U.S. electricity consumption trend, which included electricity used for all activities in the economy and tended to decrease in 2020 (according to the EIA, 3811 billion kWh in 2019 and 3664 billion kWh in 2020 [46]). However, residential electricity accounted for ∼40% of the total U.S. electricity consumption among different electricity uses and increased substantially in 2020 [46]. The benchmark value in table 1 increased as it included only electricity consumption of the residential sector, the transportation sector, and a small part of the industrial sector that are directly related to food and energy production (SM section 4).
Table 1. Validation of some results of this study.
| 2019 | 2020 | |||||
|---|---|---|---|---|---|---|
| This study | Estimated benchmark a | Diff b | This study | Estimated benchmark a | Diff b | |
| Validation of total domestic requirement (million $ in 2012 producer price) | ||||||
| Electricity | 191 078 | 189 437 | 0.9% | 222 630 | 195 081 | 14.1% |
| Fertilizer | 7312 | 6566 | 11.4% | 7296 | 8266 | −11.7% |
| Packaged meat c | 102 789 | 108 056 | −4.9% | 102 816 | 109 753 | −6.3% |
| Fresh fruits and tree nuts | 26 993 | 25 343 | 6.5% | 26 163 | 24 056 | 8.8% |
| Validation of total energy consumption (EJ) | ||||||
| Renewable Energy | 4.7 | 5.4 | −13.0% | 5.6 | 5.6 | −0.6% |
| Non-renewable Energy | 46.5 | 45.2 | 2.9% | 41.2 | 41.3 | −0.3% |
| Total Energy | 52.1 | 50.6 | 2.9% | 47.6 | 46.9 | 1.4% |
aDetailed estimations of benchmarks are documented in SM section 4 Benchmark Estimations. bDifference percentage = (Results of this study—Benchmark)/Benchmark. cThis sector excludes poultry.
In general, the results of this study are consistent with the estimated benchmarks. The total energy consumption estimated by this study, including both renewable and non-renewable energy, showed minor differences from the benchmarks (<5%, except for renewable energy in 2019). For total requirement validation, the differences between the result and estimated benchmarks are <15%. The results of this study showed higher values than the benchmarks for most sectors, except packaged meat. This could be explained by the broader coverage of the input-output approach, which included electricity, fertilizers, and fresh fruits and tree nuts required by all sectors involved in the upstream supply chain of U.S. household food and energy consumption. In comparison, the benchmarks were estimated by allocating product sales only to activities that were identified as being directly related to U.S. households (see section 2). This estimation has some uncertainties, which are discussed in SM section 4 Benchmark Estimations.
The life cycle environmental impacts of U.S. household energy and food consumption before and during the pandemic as well as the net differences are presented in figure 1. Different environmental impacts are grouped by grid lines for further discussion. Direct energy consumption includes the usage of electricity, natural gas, fuel oil, propane, and kerosene in U.S. households. Transportation includes the use of gasoline and other fuel products for driving and transportation services, such as public transportation and ride-sharing services. Food consumption includes common food items consumed by households according to the U.S. Consumer Expenditure Surveys [44].

Figure 1. Life cycle environmental impacts of household food and direct energy consumption and transportation (b) during the pandemic (c) before the pandemic, and (a) the difference between the two.
Download figure:
Standard image High-resolution imageDuring the pandemic, reduced travel lowered the life cycle environmental impacts of U.S. households (purple bars in figure 1(a)). Direct energy usage of households showed an opposite trend, that is, it increased during the pandemic (blue bars in figure 1(a)). For most environmental impact categories, the life cycle environmental reduction due to reduced travel in the pandemic outweighed the impacts of increased household direct energy consumption, except for freshwater withdrawal, eutrophication, ozone depletion, and freshwater ecotoxicity. Household food consumption had a mixed impact on life cycle environmental burdens (orange bars in figure 1(a)). The changes in U.S. household food consumption in the pandemic caused decreases in several impacts such as energy use, GHG emissions, human health impacts, freshwater withdrawals, minerals and metals use, and commercial waste generations. However, they increased land use, eutrophication, ozone depletion, and freshwater ecotoxicity. Before and during the pandemic, food consumption dominated most environmental impacts, except for human health, energy, and GHGs dominated by transportation and energy.
3.1. GHG and energy use reduction in the pandemic
During the pandemic, 255 Mton CO2 eq of life cycle GHG emissions were reduced by U.S. households (figure 1(a)), accounting for a 7.4% decrease, as compared to the GHG emissions before the pandemic. This reduction was due to decreased transportation (8.7% reduction) and food consumption (1% decrease), and increased direct energy consumption (2.3% growth) (figure 2). This decrease in GHG emissions because of reduced transportation was driven by the reduced use of gasoline and fuel products for vehicles (figure 3(a)), which accounted for 82%–83% of the total life cycle GHG emissions associated with transportation before and during the pandemic (tables S10 and S11). The remaining GHG emissions were associated with transportation services that were also halted during the pandemic. An increase in life cycle energy-related GHG emissions was mainly attributed to the growth of household electricity consumption (figure 3(b)). Electricity accounted for 62.8% of the total life cycle GHG emissions of household direct energy consumption before the pandemic (table S13), which increased to 68.3% during the pandemic (table S14).
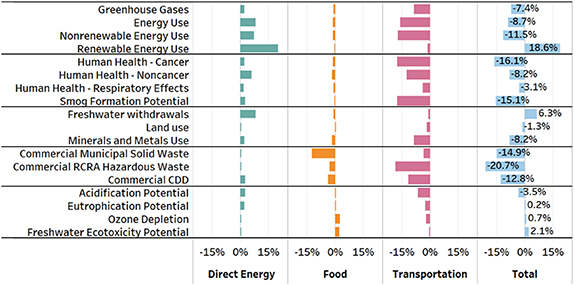
Figure 2. Percentage breakdown of life cycle environmental impact changes of U.S. households.
Download figure:
Standard image High-resolution image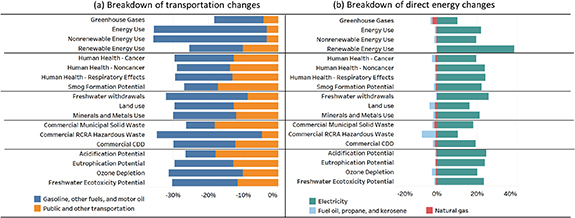
Figure 3. Breakdown of the life cycle environmental impact changes for U.S. household transportation (a) and direct energy consumption (b). The percentage change was estimated as the ratio of the environmental impact differences (in the pandemic—before the pandemic) to the environmental impacts before the pandemic.
Download figure:
Standard image High-resolution imageSimilar to the GHG emissions results shown in figure 1(a), the energy results in the same figure show a reduction of life cycle energy use (4.46 EJ, 8.7% reduction) as a result of 5.34 EJ reduction of non-renewable energy (driven by the declined gasoline usage, figure 3(a) and 0.87 EJ growth of renewable energy (driven by increased electricity consumption, figure 3(b). The contribution of household food consumption to reductions in energy use and GHG emissions was minimal (∼1%) (figure 2). The increase in the use of renewable energy should not be interpreted as an increase in renewable energy use in households but as an increase in renewable energy across the life cycle of electricity used by households. This interpretation is more consistent with the data collected by the U.S. EIA, which showed an 8.6% increase in renewable energy consumed for electricity generation [46]. On the other hand, the renewable energy directly consumed by the U.S. residential sector decreased by 5.7% (table S22) [46]. Although renewable energy consumption reached a record high of 12% of total U.S. energy consumption in 2020 [57], previous studies have pointed out the potential adverse long-term effects of COVID-19 on renewable energy transition by decreasing economy-wide demand [58] and decelerating clean energy innovation [4].
The net differences in life cycle GHG emissions and energy use between decreased transportation and increased direct energy consumption of U.S. households were quantified in this study. Such differences are likely to decrease during the post-pandemic period with resumed travel. Previous studies [4, 6] pointed out that workers and employers may be comfortable with remote working, and this may reduce travel but increase building energy use; however, they have not explored the net differences. The results of this study can be used as a foundation for future analysis of trade-offs regarding remote working and lifestyle changes in the post-pandemic period.
3.2. Human health impacts reduction during the pandemic
Four human health impact categories were investigated in this study: cancer and non-cancer-related human health impacts, respiratory effects, and smog formation. All four human health-related impacts were reduced during the pandemic due to reduced travel. The health impacts are in the unit of Comparative Toxic Unit for Humans (CTUh), which estimated an increase in morbidity, in other words, disease cases [59, 60]. Cancer-related human health impact decreased 99 CTUh and non-cancer-related impact showed a decrease of 790 CTUh (disease cases), which were far less than the deaths caused by COVID-19.
The respiratory effects were estimated in terms of particulate matter equivalent (PM2.5 eq). This study showed a net decrease of 35 kton PM2.5 eq (figure 1(a)) across the life cycle of food and energy consumed by U.S. households. According to the U.S Environmental Protection Agency (EPA), national PM2.5 primary emissions excluding miscellaneous emissions (e.g. emissions from forest fires) were 1.33 Mton in 2019 and 1.32 Mton in 2020 [61]. These values were similar to the estimates of this study (1.1 Mton for 2019 and 1.09 Mton for 2020). The EPA's estimations were larger as they covered all emissions sources in the U.S. that had a broad scope. On the other hand, this study had a narrower scope as it specifically quantified the changes in life cycle respiratory effects associated with U.S. household consumption of food, energy, and transportation. The life cycle respiratory effects before and during the pandemic were dominated by food (figures 1(b) and (c)). These results are consistent with those in the reported literature that showed significant PM2.5-related emissions contributed by the agriculture sector in the U.S [62]. A large portion of PM emissions were attributed to the production of FAH, such as meat and miscellaneous foods (figure 4(b)). Meat consumed at home, including beef, pork, poultry, and other meats, accounted for 36% of the life cycle respiratory effects of household food consumption during the pandemic (figure 4(b)). This is consistent with the literature demonstrating that 80% of air-quality-related health damages from food production were contributed by activities involved in the life cycle of animal-based foods, including animal production and growing biomass for animal feed [63]. Miscellaneous foods, including crackers, seasoning and dressing, cookies, snacks, and frozen food contributed 13%. This significant contribution of FAH to the life cycle respiratory effect is unlikely to be reduced even when the pandemic is over, given the similar patterns shown in figure S1 for 2019, unless U.S. households purchase less meat and miscellaneous food. Consumption-based strategies (e.g. reducing food purchases by minimizing food waste and stockpiling) and production-based efforts to reduce PM emissions and corresponding respiratory effects in agricultural practices are needed for effective air quality management in the post-pandemic period.

Figure 4. (a) Life cycle environmental impact changes in U.S. household food consumption; (b) life cycle environmental impact breakdown by food items during the pandemic. Percentage changes in (a) were estimated as the ratio of the environmental impact differences (during the pandemic—before the pandemic) to the environmental impacts before the pandemic. FAH—food at home. FAFH—food away from home. The impact breakdown of food items before the pandemic is provided in figure S1.
Download figure:
Standard image High-resolution image
Another human-health-related environmental impact is the smog formation potential related to ground-level ozone caused by air pollutants NOx and volatile organic compounds (VOCs) [64]. Previous studies reported a reduction in free tropospheric ozone by up to 5 parts per billion globally during the pandemic due to reduced anthropogenic NOx emissions, with substantial emission reductions in Asia and the Americas [65]. This observation is consistent with the results of this study. Figure 1(a) shows a net life cycle decrease of 9.17 Mton O3 eq due to reduced travel that offsets increased household energy and food consumption. This is not surprising because the tailpipe emissions of on-road transportation contributed 40%–60% of the precursors of ground-level ozone in the U.S [66]. Globally, ∼8.8 million excess deaths were estimated to be caused by long-term exposure to PM2.5 and ozone pollution [67]. Previous literature has also revealed a significant relationship between ground-level ozone and positive COVID cases [68]. Therefore, mitigating ground-level ozone is particularly meaningful during the pandemic and remains essential for post-pandemic recovery.
3.3. Resources use changes during the pandemic
Freshwater, land use, and mineral and metal use showed different trends during the pandemic. The net increase of life cycle freshwater withdrawals is 8.6 Gton, accounting for 2% of national water use (based on the USGS estimation of national water use as 322 billion gallons per day in the U.S., equivalent to 445 Gton yr−1 [69]). Energy consumption (particularly electricity, figure 3(b)) contributed to the greatest increase in life cycle freshwater withdrawals. This conclusion should not be interpreted as an increase in water consumption of the electricity sector driven by an increase in household energy consumption, as EIO-LCA only quantifies the life cycle environmental impacts associated with a specific product or consumption [70]; this study did not intend to use EIO-LCA to investigate the drivers of water consumption in the U.S. electricity sector.
The life cycle use of land, and minerals and metals showed a net decrease of 41 billion m2*year and 16.1 Mton, respectively, although the reduction of land use appeared to be minor (−1.3%; figure 2). Similar to other impact results, this decrease was mainly attributed to the lower usage of gasoline and other fuel products for vehicles (figure 3(a)). Land, minerals, and metals are mainly used in the production of fuels and relevant infrastructure; therefore, this reduction is temporary. Improving land management and material efficiency is essential to curb the increase in resource use when the pandemic ends.
Household food consumption dominated all three resource uses before and during the pandemic (figures 1(b) and (c)); however, it had minor contributions to the changes in resource use (figure 1(a)) and showed varied trends for different resources. Specifically, changes in U.S. household food consumption led to increased life cycle land use but decreased freshwater withdrawals and mineral and metal use (orange bars in figure 1(a)). Meat consumption (i.e. beef, pork, poultry, and other meats) drove the results of life cycle land use associated with food (∼61%; figure 4(b)). Most meats such as beef are consumed at home [71], which may explain why the shutdown did not bring considerable reductions in life cycle land use.
The trend was opposite for mineral and metal use, where the reduced FAFH led to more reductions than increased FAH. Before and during the pandemic, FAFH (including full- and limited-service restaurants, other drinking and eating places, and alcoholic beverages consumed outside homes) was the most significant contributor to the life cycle mineral and metal use. FAFH contributed 28.7% of the total mineral and metal use (figure S1), and this contribution reduced to 23.4% during the pandemic. However, this was still higher than that of the other individual food items consumed at home (figure 4(b)).
Regarding freshwater withdrawals, reduced FAFH due to lockdown compensated for the effects of increased household food consumption, as shown in figure 4(a). About 30% of the life cycle freshwater withdrawal associated with food was attributed to fresh fruits and vegetables consumed at home before and during the pandemic (figure 4(b)). Interestingly, the contribution of fresh fruits to the life cycle freshwater withdrawal decreased slightly from 16.2% in 2019 to 15.8% in 2020, while the contribution of fresh vegetables increased from 13.7% to 14.7% during the pandemic (figures 4(b) and S1). This can be explained by the different patterns of fresh vegetables and fruit consumption. According to the USDA, U.S. households consumed fewer fresh fruits but more fresh vegetables during the pandemic [45, 72].
These results indicate the trade-offs between FAH and FAFH, as well as the complications in life cycle resource use associated with various food items. Regardless of where the food is consumed, increasing resource use efficiency and directing consumers to less resource-intensive food choices is essential to avoid a dramatic increase in resource consumption when the economy returns to normal. Several studies have shown changes in customers' perspectives on energy management technologies [73, 74] and improved awareness of food waste during the pandemic [30, 31]. These changes may offer opportunities to limit the system-wide increase in resource consumption caused by higher occupancy during the pandemic and support better household resource management in the future.
3.4. Commercial waste generation
Three types of commercial wastes were assessed in this study: commercial municipal solid waste (MSW), RCRA hazardous waste (Resource Conservation and Recovery Act), and construction and demolition debris (CDD). RCRA is a public law regulating solid wastes in the U.S. [75], and USEEIO provides RCRA hazardous waste generation factors for all industrial sectors across the U.S. economy [39]. Overall, 8.31 Mton of commercial wastes were reduced across the life cycle of U.S. household activities during the pandemic, including reductions in commercial MSW (5.36 Mton), RCRA hazardous waste (1.81 Mton), and commercial CDD (1.14 Mton). This decrease in commercial MSW was mostly attributed to food consumption, specifically, the reduced consumption of FAFH (figure 4(a)). Closure of full-service restaurants, which were the major contributors of commercial MSW both before and during the pandemic, helped the most in commercial MSW reduction (figures 4(b) and S1). For commercial RCRA hazardous waste and CDD, reduced travel dominated the decrease (figure 1(a)), although food consumption had a larger or similar contribution to the two waste categories across the life cycle compared to transportation (figures 1(b) and (c)). Some news articles attributed the reduction in commercial waste to the closure of businesses and isolation measures [76, 77], which was consistent with the findings of this study. However, comprehensive and quantitative real-world data on waste generation in cities are lacking. The latest waste generation data by the U.S. EPA are for the year 2018 [78]. Most landfills, institutions, and recycling facilities do not report recent data on their websites [79]. Collecting location-specific waste generation data will help tailor effective waste management strategies after restaurants re-open.
All wastes assessed in this study are commercial wastes across the life cycle of household activities. Residential wastes, such as food waste, were not included due to the lack of data [80]. The U.S. EPA estimated food waste generation to be as high as 63.1 million short tons in 2018 (equivalent to 57.2 Mton), 39% of which were generated by the residential sector [81]. Assuming a linear relationship between the food waste increase and the expenditure growth of food consumption at home (11.7% increase in 2020 compared to 2018 according to the data from the USDA [43]), the increase in food wastes during the pandemic was estimated to be 2.6 Mton; that is smaller than the reduction in commercial MSW estimated in this study (8.31 Mton reduction of commercial wastes as discussed previously). When restaurants and food services re-open, temporary MSW reduction is likely to vanish unless more effective waste management is implemented for post-pandemic recovery. More data collection efforts are needed to investigate consumer behavior and food waste generation at homes and restaurants.
3.5. Other environmental impacts
Other environmental impacts evaluated in this study include acidification, eutrophication, ozone depletion, and freshwater ecotoxicity. Household food consumption affected all four environmental impacts before and during the pandemic (figures 1(b) and (c)). Furthermore, changes in food consumption dominated changes in ozone depletion and freshwater ecotoxicity (figure 1(a)). Acidification potential quantifies the mid-point impacts of precursors to acid rain, such as sulfur dioxide (SO2) and nitrogen oxides (NOx ) [82]. During the pandemic, there was a net decrease of 226 kton of SO2 eq across the life cycle of household activities. Reduced travel significantly decreased these precursors, which compensated for the effects of increased consumption of energy and food, particularly electricity (accounting for over 90% of life cycle acidification potential related to household direct energy consumption in tables S13 and S14) as well as meat and dairy (∼60% of life cycle acidification potential related to household food consumption in figure 4(b)).
The remaining three environmental impacts showed net increases during the pandemic, as shown in figure 1(a). Eutrophication potential quantifies the impacts of excessive nutrients in water and soil [83]. As compared to 2019, net life cycle increase was estimated to be 6 kton N eq during the pandemic. As fertilizers are primarily used for agriculture, food production plays a dominant role in the life cycle eutrophication potential for household activities (figures 1(b) and (c)). Illinova et al showed that the fertilizer industry remained strong during the pandemic; moreover, the global demand for fertilizers has increased due to the growing food consumption [84]. Higher domestic energy consumption, particularly electricity, also contributed to an increase in life cycle eutrophication potential (figure 3(b)). The life cycle eutrophication potential of different power generation technologies was assessed in previous LCA studies, and it highlighted the need to improve the current electricity generation systems [85]. For ozone depletion, the net life cycle increase was estimated to be 3.4 ton CFC-11 eq. Methyl bromide, a primary pesticide in the agriculture sector [86], was the primary contributor to life cycle ozone depletion (table S16). Across different food types, fresh vegetables accounted for approximately 70% of the total life cycle ozone depletion before and during the pandemic (figures 4(b) and S1). Freshwater ecotoxicity potential (in CTUe, comparative toxic units for ecotoxicity) estimates the potentially affected fraction of species due to pollutants emitted to the aquatic environment [83]. This study showed a net increase in freshwater ecotoxicity impact during the pandemic, largely due to an increase in food consumption. The major emissions contributing to this impact include lambda-cyhalothrin, cyfluthrin, fenpropathrin, and many others used as pesticides (table S17).
3.6. Limitations and future research directions
Several impacts of COVID-19 that were not addressed in this study included: (a) supply chain disruption caused by increased household consumption and activities. For example, lumber prices in the U.S. and Canada reached a record high during the pandemic due to the high demand for home repair and renovation activities, closure of non-essential industries, and shortage of workers [87, 88]; (b) rapid growth of food delivery in the pandemic [89, 90], which could offset the benefits of reduced household transportation. Future research could focus on the environmental impacts of increased construction demand and food delivery when expenditure or consumption data are available. This study investigated the life cycle impacts of U.S. household energy use in 2019 and 2020, but it did not explore the energy efficiency differences between household cooking and restaurant cooking due to the lack of disaggregated data for cooking activities. Data from the Energy Star program showed large variations in the energy efficiency of conventional oven (72%–86%) [91] and residential cooking (85% for induction cooking tops, and 32% and 75%–80% for conventional cooking tops using gas and resistance heating elements, respectively) [92]. However, there were no data on the number and sizes of different cooking appliances used in the United States, which will need future data collection efforts to inform cooking and food choices in the pandemic recovery. In addition, some exogenous changes between 2019 and 2020 (e.g. change in heating degree days) could have affected the results, which can be removed when higher-resolution data are available in the future. Additionally, the impacts of household variability, such as households in different regions or income groups can be explored when region-specific household expenditure data by demographic groups are made available.
In addition to the hybrid LCA, other modeling options include global environmental multiscale models (GEMMs) and general equilibrium models (GEMs). The GEMM focuses on environmental predictions at regional or global scales. It has been used for weather and air quality forecasting; however, it may not be a suitable tool for tracking the impact of one specific activity in one region or supply chain activities across different regions [93–95]. The GEM can cover economic activities in the whole economy. However, previous studies have been limited to carbon emissions and have not considered the full life cycle perspective [96–98]. Several studies have linked GEM with LCA. However, they have mainly focused on specific industrial sectors because of the intensive LCI data requirement [97, 99]. Overall, these models can be coupled with hybrid LCA to address the time lag issue of EEIO in future research.
4. Conclusions
The pandemic significantly reduced the life cycle GHG emissions (7.4%), energy use (8.7%), human health impacts (3%–16%), smog formation (15%), minerals and metal usage (8.2%), acidification (3.5%), and commercial wastes (13%–21%) of U.S. households, but led to increases in life cycle freshwater withdrawals (6.3%) and freshwater ecotoxicity (2.1%). Furthermore, there were minor changes in life cycle land use (−1.3%), ozone depletion (+0.7%), and eutrophication (+0.2%). This decrease in life cycle environmental impacts was mainly driven by reduced travel that outweighed the increase in household energy and food consumption. However, reduced transportation was insufficient to offset the impacts of increased energy consumption on life cycle freshwater withdrawals or the impacts of increased food consumption at home on life cycle ozone depletion and freshwater ecotoxicity. This resulted in a net increase in these environmental burdens during the pandemic. Closure of restaurants and food services during the pandemic reduced the impact of energy, GHG, and commercial MSW. However, such benefits were canceled out by increased food consumption at home in a few other impact categories, including life cycle land use and eutrophication. Thus, there was an environmental trade-off between the reduction of travel and eating outside and the increase of energy and food consumption at home. The life cycle results of household activities also indicated the importance of including consumption-based strategies for households, and production-based strategies for the energy and food sectors during post-pandemic recovery.
Acknowledgments
The author thanks Yale University and the U.S. National Science Foundation for funding support. This material is based upon work supported by the National Science Foundation (Grant No. 2038439). Any opinions, findings, and conclusions or recommendations expressed in this material are those of the author(s) and do not necessarily reflect the views of the National Science Foundation.
Data availability statement
All data that support the findings of this study are included within the article (and any supplementary information files).