

Abstract
The elevated summer heat sources over the Tibetan Plateau (TP) profoundly influence Asian monsoon and atmospheric general circulation. Model simulations and future changes of condensational latent heat released from precipitation and surface sensible heat (SH) over the eastern TP are investigated with 22 CMIP6 models' outputs. The models reproduce the mean precipitation pattern well, but the mean intensity is 65% excessive. The SH has scarcely been evaluated. We find that nearly half of the models cannot realistically capture the SH's spatial structure. The best six models in simulating the SH are the same models that best simulate surface air temperature. The models with high performance are selected to make a multi-model ensemble mean projection. Under the medium emission scenario (SSP2-4.5), the TP's future summer precipitation will likely increase, despite its weakening thermal forcing effect. The increasing precipitation is primarily due to the future enhancement in vertical moisture transport and surface evaporation. However, the greenhouse gases-induced top-heavy heating stabilizes the atmosphere and diminishes the TP's thermal forcing effect, weakening the circulation and upward motion. As such, the precipitation sensitivity is only a 2.7% increase per degree Celsius global warming. The projected SH will be likely unchanged in accord with the likely unaltered surface wind speed. These results have important implications for the future change of the water supplies in the heavily populated South and East Asian countries. They could help the modeling groups further improve the climate model performance in the highland regions.
Export citation and abstract BibTeX RIS

Original content from this work may be used under the terms of the Creative Commons Attribution 4.0 license. Any further distribution of this work must maintain attribution to the author(s) and the title of the work, journal citation and DOI.
1. Introduction
The Tibetan Plateau (TP), known as the 'Roof of the World,' imposes a huge elevated heating in the middle troposphere during boreal summer (Flohn 1957, Yeh et al 1957). The TP heat source variations significantly influence Asian summer monsoon (Blanford 1884, Gao et al 1981, Yanai et al 1992, Ye and Wu 1998, Hsu and Liu 2003, Rajagopalan and Molnar 2013, Wu et al 2015, Wang et al 2016, He et al 2019, Yao et al 2019), East Asia rainfall and western Pacific subtropical high (Wang et al 2008, Duan et al 2013b), and Eurasian climate (Wu et al 2016, Lu et al 2018). The TP is also a critical region for the Asian hydrological cycle. It is the headwater area for the major rivers over Asia, including the Yangtze River, Yellow River, Mekong River, Brahmaputra River, Ganges River, and Indus River.
The TP has been identified as a region susceptible to climate change (Liu and Chen 2000). In recent decades, the TP has undergone a noticeable warming trend (Wang et al 2008, Xu et al 2008) even during the global warming hiatus period of 1998–2013 (Duan and Xiao 2015, You et al 2016, Ma et al 2017), which has already changed TP thermal forcing and regional environment significantly. Thus, it is imperative to investigate how TP heat sources will change under future warming and understand why these changes will occur.
Multiple recent works found that most CMIP5 models have cold TP biases, and all of them overestimate precipitation in most parts of the TP (Su et al 2013, Duan et al 2013a, You et al 2016, Salunke et al 2018). With these caveats, the CMIP5 models generally projected rising TP surface air temperature and increasing precipitation under various representative concentration pathway-based scenarios (Su et al 2013, Chen and Frauenfeld 2014a, 2014b, Jia et al 2019a, 2019b). However, much less attention has been paid to the future change of the surface sensible heat (SH) over the TP (e.g. Wang et al 2019). The TP summer sensible heating may 'pump' surrounding air upward, transporting abundant water vapor from the ocean to feed the highland Asian summer monsoon (Wu et al 2007, 2012). Besides, most researches focus on how the TP precipitation will change, but few studies have explored the factors contributing to the precipitation or the SH changes.
The present work aims to assess the future changes of condensational latent heat (LH) and the SH over the eastern TP as they are two different types of major summer heat sources over the TP (Xie and Wang 2019). The LH is solely determined by precipitation, so we use precipitation as a proxy for the LH. Precipitation also represents a critical component of the hydrological cycle and significantly influences the water resources over China and South Asian countries. We analyze 22 newest generation CMIP6 model products (Eyring et al 2016) to (a) evaluate the models' capability and biases in reproducing the present-day climatological TP heat sources against the previous CMIP5 results, (b) select credible models to synthesize their ensemble projection of the TP heat sources' future changes, and (c) determine the causes of those future changes.
2. Data and methods
2.1. CMIP6 model outputs
The monthly CMIP6 data used in this study are downloaded from the Earth System Grid Federation data replication centers (https://esgf-node.llnl.gov/projects/cmip6/). Table S1 (available online at stacks.iop.org/ERL/16/064060/mmedia) lists the information of 22 models adopted in this study. The CMIP6 historical simulations (1850–2014) and the future projections under the SSP2-4.5 (SSP245) scenario (2015–2100) are utilized. The SSP245 scenario represents the medium-level emission pathway, and several other MIPs adopt it as a reference scenario (O'Neill et al 2016). The last 20 year average of the SSP245 experiment (i.e. 2081–2100) will be compared with its historical counterpart (1995–2014) to quantify the future change, which minimizes the uncertainties arising from the models' internal variability (Wang et al 2020).
We use the two-tailed Student's t-test to see whether the projected 2081–2100 means are significantly different from the historical 1995–2014 means. This test yields the probability measuring how the projected future multi-model ensemble mean (MME;  from equation (1a
)) differs from the simulated present-day MME (
from equation (1a
)) differs from the simulated present-day MME ( from equation (1b
)). The variances used in the Student's t-test representing the intermodel spreads are calculated from equation (1c
) and (1d
)
from equation (1b
)). The variances used in the Student's t-test representing the intermodel spreads are calculated from equation (1c
) and (1d
)
where  and
and  denote the 20 year averages of the SSP245 (S) and historical (H) simulations of each model, and N is the number of models.
2.2. Observational datasets
The monthly precipitation and surface (∼2 m) air temperature data are obtained from the CN05.1 gridded daily observation dataset developed by Wu and Gao (2013). This dataset (1961–present) is based on more than 2400 meteorological stations in China and has been interpolated into a high resolution of 0.25° × 0.25°. The monthly SH flux data over the TP in 1984–2016 is provided by Xie and Wang (2019). This new estimate of the SH is generated by merging several bias-corrected top-quality reanalysis datasets covering the entire TP region. These observational data are employed to evaluate the CMIP6 models' historical products, using several statistical methods such as model bias and pattern correlation coefficient (PCC). The boreal summer season (June–August, i.e. JJA) from 1979 to 2014 is chosen for the present-day analysis. The study domain is the TP region (TP; 26°–42° N, 70°–105° E) within a boundary defined by elevation higher than 2500 m (figure 1(a)). Since most of the Chinese Meteorological Administration stations are located in the eastern part of the plateau (dots in figure 1(a)), the following investigations of both CMIP6 simulations and observations are limited to the eastern TP (east of 90° E). To facilitate the model validation against observation, we interpolate all data's horizontal resolutions to 1° × 1°.
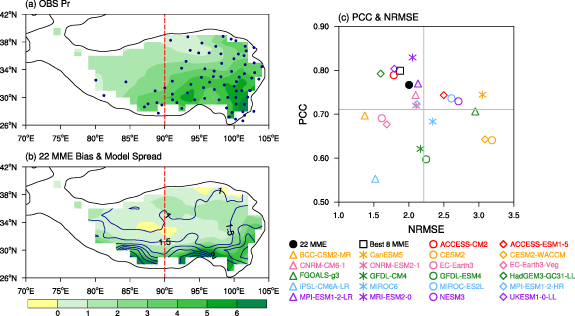
Figure 1. (a) Observed 1979–2014 JJA climatology of precipitation (Pr; units: mm d−1) over the TP from the CN05.1 dataset. (b) Patterns of MME's bias (shading) and intermodel spread (contours) for precipitation. The black curve in (a) and (b) outlines the TP region with elevation above 2500 m. The dots in (a) denote the Chinese Meteorological Administration stations. (c) Performance of the 22 CMIP6 models and their MME (solid black dot) on simulating the observed precipitation pattern over the eastern TP (east of 90°E). The vertical and horizontal coordinates in (c) are PCC and NRMSE, respectively. The horizontal (vertical) gray line in (c) indicates the mean value of the PCC (NRMSE) of 22 models. The hollow black square in (c) depicts the MME of the selected best eight models enclosed in the upper left quadrant. The five poor models are enclosed in the lower right quadrant.
Download figure:
Standard image High-resolution image2.3. Precipitation attribution analysis
The LH released from precipitation is calculated by  , where
  is the total precipitation (mm d−1),
  = 2.5 × 10⁻⁶ J kg−1 is the condensation heat coefficient, and
  = 103 kg m−3 is the density of liquid water (Duan and Wu 2008). Since the LH is solely proportional to precipitation, we apply precipitation to represent the LH for subsequent analyses.
The precipitation attribution analysis (Jin et al 2020) is adopted to examine the contributing factors to the future change of the eastern-TP precipitation. The expression of the moisture budget in a vertical column is:
where 〈〉 denotes the vertical integration. Here P and E are the precipitation rate and surface evaporation rate (kg m−2 s−1), respectively.
  is the horizontal wind velocity, ∇ is the horizontal gradient operator, q is the specific humidity, ω is the vertical p velocity, and p is the pressure. The tropopause pressure
  is set to 100 hPa, and the surface pressure
  is set to 600 hPa over the eastern TP. For monthly or seasonal mean motion, the local rate of change (
 ) can be neglected. A two-layer approximation is applied to the troposphere over the TP to estimate the moisture transport terms. Considering that the TP surface is around 600 hPa, we set the mid-level interface to 400 hPa and assume that the lower-layer mean specific humidity is equal to the specific humidity at 500 hPa, while the upper-layer specific humidity is negligible. Thus, the horizontal and vertical moisture transports can be approximated by
where  = 200 hPa is the thickness of the lower layer. Therefore, the precipitation change could be attributed to the changes in surface evaporation, low-level horizontal moisture advection, and vertical moisture transport, as expressed by the following equation:
where  and
and  (mm d−1). The operator
  represents the difference between the SSP245 projection (2081–2100 mean) and the historical simulation (1995–2014 mean).
  denotes the diagnosed precipitation change that is the sum of the three terms on the right-hand side of equation (4).
3. Results
3.1. Evaluations of the modeled present-day summer precipitation and sensible heat flux
Figure 1(a) shows that the observed JJA mean precipitation generally decreases from the southeast to the northwest over the TP because the South Asian monsoon transports abundant water vapor primarily to the southeastern TP. The regional-mean rainfall for the eastern TP is 3.3 mm d−1 or 302 mm during JJA. The historical precipitation simulated by the MME is higher than the observation in most parts of the TP region (figure 1(b)). The largest bias and intermodel spread (measured by one standard deviation of multiple models' simulations) appear at the southern and eastern edges, indicating the models' poor skills in simulating the monsoon rainfall amount over the southeastern TP. All models overestimate the observed precipitation with the relative biases ranging from 7.6% to 112.6% over the eastern TP. Thus, the 22 models' MME has a notable wet bias of 2.1 mm d−1 or 64.8% of the mean plus a great intermodel spread of 1.6 mm d−1. To quantify the discrepancy among models, we further calculate the PCC and normalized root-mean-square error (NRMSE) of each model compared with observation (figure 1(c)). Since the wet biases are substantial, both PCC and NRMSE need to be considered for choosing high-performance models. The best eight models with high PCC (greater than the mean) and low NRMSE (smaller than the mean) are selected (upper left quadrant in figure 1(c)). The MME of the best eight models ('Best 8 MME') is better than the MME of all 22 models ('22 MME') in capturing the observed pattern. The corresponding five poor models—PCC (NRMSE) lower (higher) than the mean value—are also picked out as a contrast group. The mean bias of the best group is 59.1%, which is significantly smaller than that of the poor group (89.6%). In addition, both observation and MME historical simulations exhibit no significant trend in the TP summer precipitation (figure not shown).
To see if there is an improvement compared to CMIP5, we refer to Su et al (2013)'s results that examined the annual mean precipitation over the eastern TP in 24 CMIP5 models. They found an overestimation range of 61.9% to 183.4%, with a mean bias of 116.6% in CMIP5 models. Through our calculations, the CMIP6 simulated annual mean precipitation has a mean bias of 99.0%, with a range from 44.3% to 142.8%. We find that the CMIP6 models' mean wet bias in annual mean precipitation is reduced by 18%, and the intermodel spread range is reduced by 23% compared to CMIP5. The improvement is statistically significant at the 90% confidence level. Considering that a fair comparison requires the same group of models or at least the same number of models, the comparison of ours and Su et al (2013) results is not ideal but arguably reasonable.
The period 1984–2014 is selected for the evaluation of the SH owing to the limited availability of reliable observational data. The observed summer SH is stronger in the western-central and northern TP (figure 2(a)) due to sparse vegetation, semiarid surface condition, and higher altitude. The mean SH in the eastern TP is 48.4 W m−2. The distributions of the 22 MME's bias and the intermodel spread (figure 2(b)) generally resemble that of the SH climatology (figure 2(a)) with larger negative bias over the western and northern TP. The MME has a bias of −6.1 W m−2 or −12.7% over the eastern TP, and the area-averaged intermodel spread is 14.7 W m−2. The relative biases of all models range from −61.8% to 35.7%, in which most of them (15 out of 22) underestimate the SH. Twelve out of 22 models with PCC above 0.75 suggest their good spatial correspondence with the observation, while other models have PCC lower than 0.62 (figure 2(c)). Since the model biases are relatively small, we use PCC as the primary criterion to select 12 models as a good-model group, and the other ten models form a poor-model group. It can be seen that the good models for the SH do not precisely match those for the precipitation, indicating the model's inconsistent skills in simulating different variables. For the SH, the 'Good 12 MME' has the optimal performance with the highest PCC (0.90) and almost the lowest NRMSE (0.57). Considering the uncertainties in the SH datasets (Duan et al 2014), we also compared the model simulations with two other advanced TP SH observational datasets provided, respectively, by Yang et al (2011) for the period 1984–2006 and Duan et al (2018) for the period 1979–2016 to verify the reliability of the above result. It turns out that the same 12 good models are selected (figure S1). Moreover, the MME historical simulations can capture the weakening trend in the observed SH (figure not shown), which is mainly due to the reduced surface wind speed over the eastern TP (Duan and Wu 2008), despite that the declining rate of the modeled SH is lower than the observed value.
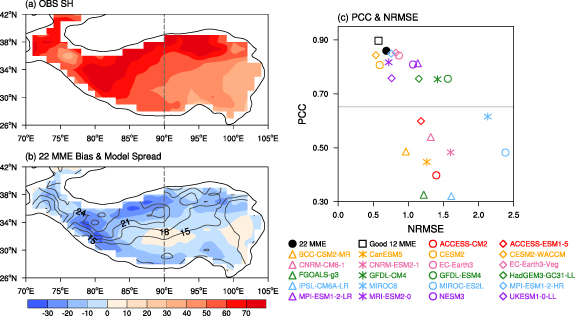
Figure 2. Same as figure 1 but for surface SH (units: W m−2) in 1984–2014. The horizontal gray line in (c) indicates the mean value of the PCC of 22 models. The hollow black square in (c) depicts the MME of the selected 12 good models (above the gray line).
Download figure:
Standard image High-resolution image3.2. Future projections of the TP summer heat sources
3.2.1. Projected changes of the TP precipitation and sensible heat and their influencing factors
We use the difference between the 2081–2100 average in the SSP245 experiment and the 1995–2014 average in historical simulation to quantify the projected change in the 21st century and utilize the percentage of this difference to the 1995–2014 climatology to represent the expected relative change. The precipitation attribution analysis shows that the enhancement of vertical moisture transport and surface evaporation are the major contributors to the simulated precipitation increase. In contrast, the horizontal moisture advection term is relatively small and has a negative contribution (figure 3). This conclusion is valid for all models in general. However, the relative contributions between the vertical transport and evaporation differ among the three MME groups. In 'Best 8 MME,' the increase in evaporation is much larger than the increase in vertical moisture transport, while in 'Poor 5 MME,' the substantial vertical moisture transport enhancement is the primary contributor to the precipitation increase. Thus, the contributions by these two terms are comparable in '22 MME.' Compared to '22 MME' and 'Poor 5 MME,' the 'Best 8 MME' diagnosed precipitation change ( ) seems to a bit overestimate the projected change (
 ). The reason for this overestimation needs further investigation.
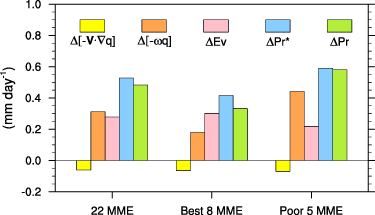
Figure 3. Moisture budget decomposition of the summer precipitation change (the difference between 2081–2100 mean and 1995–2014 mean) over the eastern TP for three groups: '22 MME,' 'Best 8 MME,' and 'Poor 5 MME.' The yellow, orange, pink, blue, and green bars denote the horizontal moisture advection change (![$\Delta \left[ { - {\mathbf{V}} \cdot \nabla q} \right]$](https://content.cld.iop.org/journals/1748-9326/16/6/064060/3/erlac0279ieqn19.gif) ), vertical moisture transport change (
), vertical moisture transport change (![$\Delta \left[ { - \omega q} \right]$](https://content.cld.iop.org/journals/1748-9326/16/6/064060/3/erlac0279ieqn20.gif) ), surface evaporation change (
), surface evaporation change ( ), diagnosed precipitation change (
 ), and multi-model simulated precipitation change (
 ), respectively.
Download figure:
Standard image High-resolution imageTable 1 presents the projected changes of precipitation and their attributing terms over the eastern TP. The significance of these future changes has been examined using the two-tailed Student's t-test in which the intermodel spread (i.e. model uncertainty) is considered. The confidence level follows the likelihood scale assigned by the IPCC fifth assessment report on consistent treatment of uncertainties (Mastrandrea et al 2010). Precipitation projected by 'Best 8 MME' will 'likely' increase by 6.2% (0.33 mm d−1), which is attributed to a 'very likely' enhancement of 12.1% in surface evaporation, a 'likely' intensification of 9.0% in vertical moisture transport, and a slight offset by the 'likely' decrease in horizontal moisture convergence. The 'virtually certain' increase of 21.4% in low-level specific humidity and the 'likely' weakening of 8.9% in ascending motion jointly induce the predicted strengthening in the vertical moisture transport. The relative change of the horizontal moisture advection term is quite large (40.5%) since this term's historical average (negative) is very small. The results of '22 MME' are similar to those of 'Best 8 MME,' except that the '22 MME' projected precipitation will 'very likely' increase owing to the less offset effect by the 'about as likely as not' decrease in the upward motion.
Table 1. 'Best 8 MME' and '22 MME' projected precipitation changes and their contributing factors over the eastern TP in summer. Results of '22 MME' are presented as a comparison. The *, **, and *** symbols indicate that the likelihood of the projected change is 'likely' (66%–100% probability), 'very likely' (90%–100% probability), and 'virtually certain' (99%–100% probability), respectively (under two-tailed Student's t-test). The value without the asterisks means its likelihood is 'about as likely as not' (33%–66% probability). Note that  is presented in the table because the summer-mean value of
  is negative over the eastern TP, which indicates the climatological ascending motion.

|

|
![$\left[ { - {\boldsymbol{V}} \cdot \nabla q} \right]$](https://content.cld.iop.org/journals/1748-9326/16/6/064060/3/erlac0279ieqn30.gif)
| ||||
|---|---|---|---|---|---|---|
| Change (mm d−1) | Relative change | Change (mm d−1) | Relative change | Change (mm d−1) | Relative change | |
| 'Best 8 MME' | 0.33* | 6.2%* | 0.30** | 12.1%** | −0.065* | 40.5%* |
| '22 MME' | 0.48** | 8.7%** | 0.28** | 10.9%** | −0.061* | 46.0%* |
![$\left[ { - \omega q} \right]$](https://content.cld.iop.org/journals/1748-9326/16/6/064060/3/erlac0279ieqn31.gif)
|

|

| ||||
| Change (mm d−1) | Relative change | Change (g kg−1) | Relative change | Change (Pa s−1) | Relative change | |
| 'Best 8 MME' | 0.18* | 9.0%* | 0.91*** | 21.4%*** | −4.14 × 10⁻³* | −8.9%* |
| '22 MME' | 0.31* | 14.7%* | 0.91*** | 20.8%*** | −2.19 × 10⁻³ | −4.4% |
According to the bulk aerodynamic formula of surface SH flux, the SH is proportional to the surface (∼10 m) wind speed ( ) and the ground-air temperature difference (
 ). The SH projected by 'Good 12 MME' will be 'likely' unchanged (i.e. 'unlikely' changed) in the future (table 2). Meanwhile, the surface wind speed will also 'likely' remain unchanged, and the ground-air temperature difference will 'about as likely as not' (i.e. insignificantly) decrease. The '22 MME' predicted SH will be 'very likely' unchanged (i.e. 'very unlikely' changed).
Table 2. 'Good 12 MME' and '22 MME' projected SH changes and their influencing factors over the eastern TP in summer. The ++ and + symbols indicate 'very unlikely' (0%–10% probability) and 'unlikely' (0%–33% probability), respectively (under two-tailed Student's t-test). The value without the symbols means its likelihood is 'about as likely as not' (33%–66% probability).
| SH |

|

| ||||
|---|---|---|---|---|---|---|
| Change (W m−2) | Relative change | Change (m s−1) | Relative change | Change (°C) | Relative change | |
| 'Good 12 MME' | 1.40+ | 3.3%+ | −0.10+ | −3.8%+ | −0.25 | −15.0% |
| '22 MME' | 0.21++ | 0.5%++ | −0.09+ | −3.0%+ | −0.16 | −8.8% |
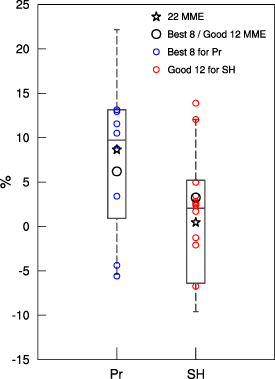
Figure 4 shows the range of the projected relative changes, illustrating the large inter-model variability in 22 models. The box includes 66% of data that shows the range of 'likely' occurrence, and the dashed line between the 5th and 95th percentiles represents the 'very likely' range. Most models project enhancement in precipitation. Six of the best eight models are concentrated in the 'likely' box, and the '22 MME' projection is higher than the 'Best 8 MME.' Since the MPI-ESM1-2 h and MPI-ESM1-2-LR models predict negative changes, the projection range of the 'Best 8' group is quite large. The projected changes of the SH show great discrepancies among the models, and the 'likely' box is inclusive of zero, which induces the insignificant MME change. The spread of the good models for the SH is also broad, mainly due to the two notable positive outliers (CESM2 and CESM2-WACCM models).
Figure 4. Range of the projected relative changes of precipitation (Pr; mm d−1) and SH (W m−2): 2081–2100 average minus 1995–2014 average. The boxplots indicate the 5th and 95th percentiles (whiskers), 17th and 83rd percentiles (box ends), and median (black solid middle bar). The black hollow star is the MME of all 22 models, and the black circle denotes the MME of the best eight (12 good) models for Pr (SH). The small blue (red) circles represent the individual projections by the best eight (12 good) models for Pr (SH).
Download figure:
Standard image High-resolution image
3.2.2. Precipitation sensitivity to local and global warming
To obtain the precipitation sensitivity (the relative change scaled to one degree of local or global warming), we evaluate the simulated surface air temperature ( ). The '22 MME' has a cold bias of 0.31 °C that is −3.5% relative to the observation over the eastern TP. This bias is slightly less than the cold bias found in the CMIP5 models (<1 °C in summer) (Su et al
2013). All models have PCC higher than 0.6 in simulating observed
). The '22 MME' has a cold bias of 0.31 °C that is −3.5% relative to the observation over the eastern TP. This bias is slightly less than the cold bias found in the CMIP5 models (<1 °C in summer) (Su et al
2013). All models have PCC higher than 0.6 in simulating observed  . The best six models for
  are the same as those for the SH, suggesting that the models better simulating the surface air temperature are more likely to simulate the SH better over the TP. The best models for precipitation are different from those for
  , but the 'Pr Best 8 MME' still has good performance in reproducing the climatological
  (PCC = 0.81). Therefore, considering the consistency with the precipitation, we use the 'Pr Best 8 MME' to analyze the future change of
  . All 22 models predict a steadily warming trend under SSP245, and the projected 20 year change from 'Pr Best 8 MME' is 3.0 °C that is virtually certain warming over the eastern TP. Given the relative change of precipitation is 6.2%, the precipitation sensitivity to local warming is 2.1% °C−1. The global surface air temperature is projected to rise by 2.3 °C from 'Pr Best 8 MME.' Thus, the precipitation sensitivity to global warming is 2.7% °C−1.
As the TP will warm up in the future, the surface evaporation and low-level specific humidity are projected to increase significantly according to the Clausius–Clapeyron relationship (Held and Soden 2006). Moreover, to investigate what causes the likely weakening of ascending motion in 'Best 8 MME,' we examine the future changes of the 500 hPa divergence ( ) at the top of the eastern TP boundary layer and the atmospheric static stability measured by the difference between 200 and 500 hPa pseudoequivalent potential temperature (
 ; Bolton 1980) (table S2). The 'Best 8 MME' predicts an 'about as likely as not' increase in 500 hPa divergence. Besides, the projected 500 hPa air temperature difference (
 ) between the eastern TP and East Asia (EA: 25°–40° N, 105°–130° E) is 'about as likely as not' to decrease. The changes of both
  and
and  imply an insignificant reduction of the TP low-level cyclonic circulation. The static stability is projected to 'very likely' increase by about 10% due to the greenhouse gases (GHGs)-induced top-heavy heating (i.e. the upper-level air will warm faster than the low-level air). Thus, the atmospheric stabilization is the main cause for the likely weakening of the TP upward motion.
4. Conclusions and discussion
Most CMIP6 models can reasonably simulate the observed climatological patterns of precipitation and temperature over the eastern TP. However, the SH pattern still could not be well captured by nearly half of the models. It is worth noting that the best six models for the SH are the same as those for surface air temperature. The mean cold bias in CMIP6 (0.31 °C) is slightly reduced compared to Su et al (2013) assessed CMIP5's cold bias (<1 °C). The models have large wet biases with a mean of 2.1 mm d−1 or 65%. Compared to the CMIP5 simulations (Su et al 2013), we find that the mean wet bias in the CMIP6 simulated annual mean precipitation is reduced by 18%, with a reduction of 23% in the intermodel spread range. However, the systematic wet biases remain relatively large in CMIP6 models, suggesting that the simulation of precipitation remains a major challenge. We attempted to ascribe the bias to the models' limited capability in dealing with topographic effects. Current climate models cannot fully capture many regional processes such as local circulation induced by complex topography due to their coarse resolution (Giorgi and Marinucci 1996, Su et al 2013). Meanwhile, model performance is sensitive to parameterization schemes for sub-grid convective processes (Kang and Hong 2008, Chen et al 2010, Neelin et al 2010). Deficient cumulus parametrization could induce biases in simulations.
Most models project a prominent warming and wetting trend in the 21st century under the SSP245 scenario. The 'Pr Best 8 MME' projects a 3.0 °C increase in local temperature and a 6.2% increase in precipitation compared to 1979–2014 mean. The precipitation sensitivity to local temperature rise is 2.1% °C−1, and to global warming is 2.7% °C−1. The likely increase in precipitation is primarily attributed to the likely increasing vertical moisture transport and the very likely intensifying surface evaporation. The vertical moisture transport depends on the changes of low-level moisture and mid-level upward motion. Anthropogenic warming certainly enhances low-level humidity. The increasing water vapor likely comes from the future enhancement of evaporation or evapotranspiration from the land surface, including the lake, vegetation, soil, river, and glacier. A surface water budget analysis is needed to fully address the sources of the water vapor. On the other hand, the GHGs-induced top-heavy heating stabilizes the atmosphere and thus likely weakens the upward motion. The weakening of the ascending motion partially offsets the increases in surface humidity and evaporation, thereby reducing the precipitation sensitivity to global warming.
For the SH, 'Good 12 MME' predicts an 'unlikely' change due to the large intermodel spread. Along with it, the near-surface wind speed will also be likely unchanged, although the ground-air temperature is projected to 'about as likely as not' decrease. By comparing the historical simulations of  and
and  with the corresponding observations, we find that the CMIP6 models can capture the decreasing trend of observed
  but not the increasing trend of
  (figure S2). Oppositely, the 'Good 12 MME' even simulates a decreasing trend of
  during 1979–2014. Thus, the projected decrease in
  may not be reliable. Further investigation is needed to understand the models' poor performance in simulating
  . Since the CMIP6 models show high performance for
  , the problem might come from the simulation of
  , which is related to complex land processes in the plateau region.
The CMIP6 models' biases over the TP are probably associated with the coarse model resolution and defective physical parameterization. The current models cannot fully capture many local processes induced by complex topography. In this study, the EC-Earth3 and EC-Earth3-Veg models have the highest spatial resolution (256 × 512). These two models are the best in simulating the observed temperature pattern and are superior in reproducing the SH. For the precipitation, these two European models also have almost the least wet biases. Besides, by comparing the models from the same institution, the wet bias of the high-resolution model (MPI-ESM1-2 h or MIROC6) is smaller than that of the low-resolution model (MPI-ESM1-2-LR or MIROC-ES2L). The above results suggest that refining spatial resolution could help to reduce model biases in the TP region. The apparent wet bias is also related to the deficiencies in model cumulus parameterizations, one of the major sources of uncertainty in precipitation projection and needs to be further explored. This study may help the modeling groups further improve the climate model performance in highland regions.
Acknowledgments
This work is jointly supported by the NSF/Climate Dynamics Award #2025057 and the Atmosphere-Ocean Research Center (AORC) at University of Hawaii which is partially funded by Nanjing University of Information Science and Technology (NUIST). This is the NUIST-Earth System Modeling Center (ESMC) Publication Number 348, the SOEST Publication Number 11349, and the IPRC Publication Number 1522. All datasets used herein are listed in the references.
Data availability statement
Any data that support the findings of this study are included within the article.
The data that support the findings of this study are openly available at the following URL/DOI: https://esgf-node.llnl.gov/projects/cmip6/.