

Abstract
The Great Barrier Reef (GBR) is a globally significant coral reef system supporting productive and diverse ecosystems. The GBR is under increasing threat from climate change and local anthropogenic stressors, with its general condition degrading over recent decades. In response to this, a number of techniques have been proposed to offset or ameliorate environmental changes. In this study, we use a coupled hydrodynamic-biogeochemical model of the GBR and surrounding ocean to simulate artificial ocean alkalinisation (AOA) as a means to reverse the impact of global ocean acidification on GBR reefs. Our results demonstrate that a continuous release of 90 000 t of alkalinity every 3 d over one year along the entire length of the GBR, following the Gladstone-Weipa bulk carrier route, increases the mean aragonite saturation state ( ) across the GBR's 3860 reefs by 0.05. This change offsets just over 4 years (∼4.2) of ocean acidification under the present rate of anthropogenic carbon emissions. The injection raises
  in the 250 reefs closest to the route by
  , reversing further projected Ocean Acidification. Following cessation of alkalinity injection
  returns to the value of the waters in the absence of AOA over a 6 month period, primarily due to transport of additional alkalinity into the Coral Sea. Significantly, our study provides for the first time a model of AOA applied along existing shipping infrastructure that has been used to investigate shelf scale impacts. Thus, amelioration of decades of OA on the GBR is feasible using existing infrastructure, but is likely to be extremely expensive, include as yet unquantified risks, and would need to be undertaken continuously until such time, probably centuries in the future, when atmospheric CO2 concentrations have returned to today's values.
Export citation and abstract BibTeX RIS

Original content from this work may be used under the terms of the Creative Commons Attribution 4.0 license. Any further distribution of this work must maintain attribution to the author(s) and the title of the work, journal citation and DOI.
1. Introduction
The Great Barrier Reef (GBR) is a globally significant coral reef system supporting rich and diverse ecosystems and providing valuable ecosystem services. At present the GBR is facing unprecedented stress from ocean warming, tropical cyclones, sediment and nutrient runoff, marine pests and ocean acidification (OA) (De'ath et al 2009, Anthony et al 2017, Dietzel et al 2020). In response to the declining health of coral reef ecosystems, a wide range of management strategies are currently under consideration with the goal of minimising environmental pressures and enhancing the resilience of coral reef ecosystem (Mcleod et al 2019). These include prioritising reefs that could be more resilient to future threats (Hock et al 2017) as well as more active and direct environmental engineering approaches such as marine cloud brightening (Anthony et al 2017, National Academies of Sciences, Engineering and Medicine 2019).
Amongst these stressors OA represents one of the most significant threats to the long-term viability of the reef though impacting the ability of coral to build and repair their hard structures and recover from bleaching events (Fabricius et al 2020). OA describes the changes occurring in seawater chemistry in response to the uptake of anthropogenic carbon (Feely and Doney 2009), and will be very long-lasting (100s–1000s years), even if emissions were to be stopped (Frolicher and Joos 2010). Artificial ocean alkalinization (AOA) has been suggested and explored as a technique to offset or ameliorate the changes associated with OA and enhance oceanic carbon uptake (see Renforth and Henderson (2017) and references within for a recent review). Essentially AOA involves adding exogenous alkalinity to the seawater, 'reversing' the shift in carbon chemistry equilibrium process that occurs when the ocean takes up anthropogenic carbon. AOA can also be considered as the acceleration of chemical weathering of minerals through natural processes that play a key role in modulating the climate on geological timescales (Sigman and Boyle 2000, Zeebe 2012, Colbourn et al 2015). Sources of exogenous alkalinity include calcium carbonate and calcium hydroxide as well as (crushed) ultramafic rocks such as olivine, fosterite and dunnite (Renforth and Henderson 2017).
The potential impacts of AOA on calcifying marine organisms such as corals have also been investigated. Laboratory and field evidence have linked alkalinity additions to the increase in aragonite saturation state (Mucci 1983), and to an increase in coral growth rate (Langdon et al 2000, Fabricius et al 2017). AOA as a mechanism to increase coral calcification rates was recently demonstrated by Albright et al (2016) on One Tree Island in the GBR. Albright et al (2016) showed that by returning the seawater carbon chemistry to its pre-industrial state, the calcification rate could be increased, thereby ameliorating the impact of ocean acidification.
The majority of AOA modelling studies to date (Ilyina et al
2013, Köhler et al
2013, Keller et al
2014, González and Ilyina 2016, Hauck et al
2016, Lenton et al
2018) have focused on the potential for AOA as a carbon dioxide removal (CDR) technique. These have tended to explore the global or basin scale carbon cycle and ocean acidification response; highlighting the challenges of balancing these responses (Lenton et al
2018). Few studies have explored the role of AOA with a focus on offsetting the changes associated with OA at a regional scale. Feng et al (2016) used an Earth system model to explore the potential of AOA on tropical coral reefs. They concluded that while AOA may be a viable method to counteract increasing CO2 levels, it would require a sustained and ongoing effort. While Feng et al (2016) provides interesting and important insights, one of the limitations in this study is the coarse resolution of the modelling system ( horizontal resolution), so the impacts of AOA at the regional and reef scale are difficult to infer.
Recent studies have demonstrated that the response of ecosystems like the GBR to OA is significantly more complex than the coarse resolution atmospheric and global ocean models have been are able to resolve (Mongin et al
2016). Oceanic  and pH variability are driven by complex interactions between forcing from the open-ocean carbon dynamics, the delivery of freshwater and carbon from coastal watersheds, and metabolic effects within the ecosystem (Duarte et al
2013). These processes, and the associated feedbacks, need to be accounted before we can with confidence predict the impact and efficiency of regional-scale AOA.
and pH variability are driven by complex interactions between forcing from the open-ocean carbon dynamics, the delivery of freshwater and carbon from coastal watersheds, and metabolic effects within the ecosystem (Duarte et al
2013). These processes, and the associated feedbacks, need to be accounted before we can with confidence predict the impact and efficiency of regional-scale AOA.
The goal of this work is to investigate the reduction of impacts of OA on 3860 individual reefs of the GBR due to continental shelf scale AOA. To do this we take advantage of a recently developed 4 km resolution coupled hydrodynamic-biogeochemical model, validated for the GBR region (Skerratt et al 2019). This model represents a major step forward allowing for the first time the simulation of individual reefs at the scale of the Great Barrier Reef (344 000 km2). To simulate AOA, we employ a continuous release of alkalinity in the ocean surface from a northward transit along an existing shipping route and with the release rate calculated using the maximum load of a typical bulk carrier (90 000 t). By using existing shipping infrastructure as the alkalinity delivery mechanism, and analysing the impact on the water overlying 3860 reefs of the GBR, this study provides a first-order assessment of the feasibility of ameliorating the chronic impacts of global OA on the GBR.
2. Materials and methods
2.1. The eReefs coupled hydrodynamic-biogeochemical model
A large, multi-agency collaboration (https://research.csiro.au/ereefs/) has developed the eReefs coupled hydrodynamic, sediment and biogeochemical model that simulates at multiple scales the environmental conditions of the Great Barrier Reef (Schiller et al 2014, Steven et al 2019). This coupled model provides skilful predictions of water column concentrations of dissolved inorganic nutrients and particulate organic matter across the entire length of the Great Barrier Reef from 2011–present (Skerratt et al 2019, Baird et al 2020b). The hydrodynamic model is nested within a global circulation model, in order to provide accurate forcing along the boundary with the Coral Sea, and forced by atmospheric winds, solar radiation and 22 river flows. Carbon and alkalinity concentrations in freshwater inputs are prescribed as 900 mmol m−3 (Mongin et al 2016). The biogeochemical model simulates optical, nutrient, plankton, benthic organisms (seagrass, macroalgae and coral), detritus, chemical and sediment dynamics. The Ocean-Carbon Cycle Model Intercomparison Project (OCMIP2, (Orr et al 2017)) numerical methods are used to quantify air-sea carbon fluxes and the carbon dioxide system equilibria in seawater.
The OCMIP2 procedures quantify the state of the CO2 system using two prognostic variables, the concentration of dissolved inorganic carbon and total alkalinity. The value of these prognostic variables, along with salinity and temperature, are used to calculate the partial pressure of carbon dioxide, pCO2, The air-sea flux of carbon dioxide is calculated based on wind speed data and the air-sea gradient in pCO2. Thus an injection of alkalinity will create and air-sea gradient, driving atmospheric carbon into the ocean. A diagram showing the pathways of alkalinity in the model is presented in the supplementary material (available online at stacks.iop.org/ERL/16/064068/mmedia).
Simulations using the eReefs coupled marine model have studied the exposure of the GBR to ocean acidification (Mongin et al 2016), the fate of anthropogenic terrestrially-derived sediment loads (Margvelashvili et al 2018), coral bleaching (Baird et al 2018), and the fate of nutrient loads from rivers (Wolff et al 2018). A data assimilating simulation (Jones et al 2016) has also provided environmental conditions of the GBR for reporting to national and international management bodies (Robillot et al 2018).
The GBR has more than 3860 individual reefs in the Great Barrier Reef Marine Park Authority Features Map. Many reefs are smaller than a single model cell and some cells contain multiple reefs. Thus only 2144 model grid cells contains one or more reef.
2.2. Alkalinity injection
The dissolution of the silicate-containing mineral olivine is one of the proposed AOA approaches (Köhler et al
2013). Olivine is an abundantly-available magnesium silicate mineral. The dissolution of one mole of olivine leads to an increase in total alkalinity,  , of 4 moles, and in silicic acid,
  , of 1 mole:
In this study, we do not represent the process of substrate weathering and dissolution of olivine. Instead, we simply assume a surface flux of alkalinity calculated from the olivine molar mass (153.31 g mol−1), using a conversion of 1 g of olivine = 1/153.31 × 4 = 0.026 mol of  . Further, we do not consider the kinetics of olivine dissolution. Thus, the
  source can be considered directly as processed calcium hydroxide or slaked lime. Not considering dissolution makes our study a best-case scenario in what may be a wide range of possible outcomes.
2.3. Injection infrastructure
We simulate alkalinity injection along the Gladstone-Weipa bulk carrier route (Gladstone Harbour, 23.84∘ S, 151.26∘ E to Cape York, with the route extending beyond the model boundary to Weipa, 12.65∘ S, 141.84∘ E). The route is a 2200 km path along the entire length of the GBR in the Designated Shipping Areas (figure 1(A)). Interestingly, suitable mineral deposits are mined in the Gladstone region, and are presently exported using port facilities in Gladstone Harbour.

Figure 1. Map of the Great Barrier Reef. Bathymetry is overlain. A: Gladstone-Weipa (Queensland, Australia) bulk carrier route (green) and location of in-situ observations (red and black dots).
Download figure:
Standard image High-resolution imageThe typical transit time of bulk carriers along the Gladstone-Weipa route at 10 knots is 96 h. Ships presently using this route have a carrying capacity of 90 000 t. A complete unloading of the ship at sea during the 96 h transit translates into a deposition of  of 6795 mol s−1.
With a model resolution of 4 km, and a 1 h integration time step, the ship travels across three model grid cells per time step. The alkalinity release is therefore spread over three model grid cells every hour. The ship release of alkalinity is repeated every 96 h, starting from Gladstone and moving northward. We simulated the release for 2 years, from 1 January 2014 until 31 December 2015.
2.4. Dataset for model assessment
The skill of the model's carbon chemistry simulations are assessed against observations from the bulk carrier whose route is used for the simulation. The observations include a custom-built sensor suite, installed on the RTM Wakmatha, to continuously collect ocean chemistry data along the length of the GBR during its regular voyages (Steven et al 2019).
The observations include semi-continuous sampling of pCO2, temperature and salinity, as well as discrete bottle samples for  and dissolved inorganic carbon (
 ) from 31 sites along the ship track. The samples are taken from 7 m depth northbound and 11 m southbound (fully loaded). In total more than 2000 discrete samples were collected from 80 transits from 2013 to 2019.
2.5. Numerical simulations
Three numerical simulations are run sequentially. The first simulates the carbon chemistry of the GBR without AOA. Here we designated this as the control simulation; it is referred to in the eReefs Project as GBR4_H2p0_B3p0_Cq2b_Dhnd. This simulation, begun on 1 December 2010, is described in Baird et al (2020a) and is compared to observations to determine the skill of the model (section 3.1). A second simulation uses the state of the control simulation on 1 January 2014 as initial conditions and is forced with the ship-based alkalinity injection until 1 January 2016. A third simulation, analysed in the Discussion, uses the state of the alkalinity injection simulation on 1 January 2015 and then runs until 1 January 2016 without further alkalinity injection. Thus by comparing the first and second simulations over a 12 month period (long enough so the alkalinity injection impact has reach a quasi steady state) we can determine the impact of the injection; and comparing the second and third we can determine the duration of impact of the injection following cessation.
The model is forced with realistic weather forcing and nested into a global ocean model. Thus a true steady state can never be achieved. The years chosen for the experiment correspond to a neutral El Niño–Southern Oscillation and low cyclonic activity in the GBR region.
3. Results
3.1. Assessment of simulated carbonate chemistry without AOA
The assessment of the skill of carbon chemistry predictions presented here was undertaken on the simulation without alkalinity injection described in Baird et al (2020b). For comparison with the observational data, we output model data at hourly intervals along the entire ship transit line. Each individual observation was then matched in time and space to the corresponding model output.
A summary of the skill statistics is provided in table 1, with detailed comparisons for each constituent in figure 2. A mathematical description of the skill metrics can be found in Baird et al (2020b) along with the skill analysis for a further set of biogeochemical parameters.
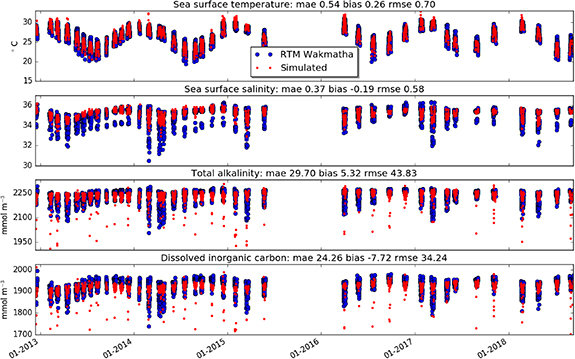
Figure 2. Simulated (red, GBR4_H2p0_B3p0_Cq2b_Dhnd) and observed (blue) sea surface temperature, salinity, total alkalinity and dissolved inorganic carbon concentration along the Gladstone-Weipa (Queensland, Australia) bulk carrier route.
Download figure:
Standard image High-resolution imageTable 1. Summary statistics comparing the eReefs model with bottle samples taken along the Gladstone-Weipa bulk carrier route (alkalinity,  , and dissolved inorganic carbon,
  ) and underway sensors (temperature, salinity and pCO2).
  is calculated from
  and
and  statistics assuming T = 25 ∘C, S = 35.
| Mean absolute error | Bias | Root mean square error | |
|---|---|---|---|
| Temperature (∘C) | 0.78 | 0.06 | 1.18 |
| Salinity | 0.43 | −0.29 | 0.65 |
 (mmol m−3) (mmol m−3) | 32.11 | −15.08 | 43.99 |
 (mmol m−3) (mmol m−3) | 30.41 | −22.70 | 39.21 |
| pCO2 (ppmv) | 5.5 | −2.59 | 6.90 |

| 0.08 | 0.14 | 0.13 |
For  , uncertainty (bias ± mean absolute error) is −15.08 ± 32.11 mmol m−3 and
  uncertainty is −22.70 ± 30.41 mmol m−3 (table 1). These uncertainties are much less than the spatial-temporal variation seen along the track (of order 200 mmol m−3 for both
  and
and  , figure 2). Further, these uncertainties are 2-fold lower than that of current climate models (Zheng and Long 2015).
The model skilfulness (in relative errors) varies between pCO2,  and
and  due to the underlying simulated processes and their interactions: pCO2 is driven by large scale oceanic processes, equilibration with the atmosphere, carbon chemistry equilibrium as well as variability in temperature and salinity;
  is driven by the calcification/dissolution balance of the reefs and the input of fresh water for the catchment (figure A1) which have greater uncertainties; and
  is primarily driven by reef processes as well as the additional variability introduced by water column productivity.
3.2. Spatial distribution of changes in carbon chemistry following AOA
We track the changes in  and
and  following the commencement of AOA. The spatial footprint of the change in surface
  after twelve months of AOA is shown in figure 3. The integrated surface footprint of AOA is 124 000 km2 (red shading, figure 3); defined where values of
  5 mmol m−3 (
 ). The area of elevated
  occurred generally along, and inshore, of the GBR shipping channel (figure 1 green line). This arises from the generally alongshore coastal currents on the shelf (Baird et al
2017), with the greatest impact on shallow waters. The change in
occurred generally along, and inshore, of the GBR shipping channel (figure 1 green line). This arises from the generally alongshore coastal currents on the shelf (Baird et al
2017), with the greatest impact on shallow waters. The change in  is smaller in deeper water due to greater vertical ocean mixing (dilution). Similarly, filaments can be seen moving offshore, but are of a lower concentration due to mixing with surrounding waters. The largest increase in surface
  due to AOA is located in the central GBR region. The widest footprint (in the offshore direction) is in the southern GBR (∼100 km wide), and the narrowest in the northern GBR (∼50 km wide).
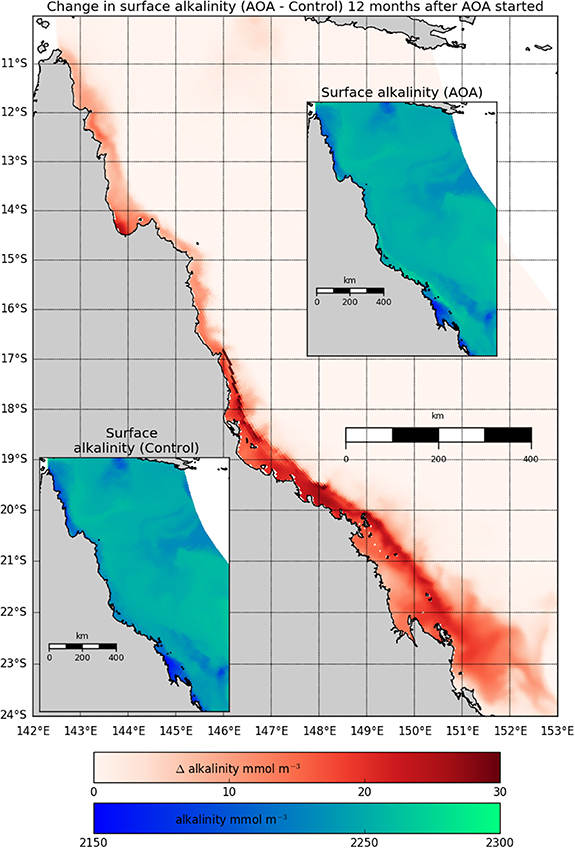
Figure 3. Impact of 12 months release of alkalinity along the Gladstone-Weipa bulk carrier route on surface alkalinity (mmol m−3). The large background map (red shading) shows a snapshot (12 months after the start of the AOA, 31 December 2014) of the difference in surface alkalinity between the control simulation (without AOA) and the AOA simulation. The embedded panels (green blue shading) show maps of sea surface alkalinity for the control simulation (lower panel) and for the AOA simulation (upper panel) on 31 December 2014. The ship position on its northward transit at the time of the snapshot can be seen at 16.8∘ S, 146∘ E.
Download figure:
Standard image High-resolution image3.3. Effectiveness of AOA to ameliorating OA on reefs
The aim of this study was to assess the impact on ocean chemistry of alkalinity injection using potentially existing infrastructure. In particular, to assess whether the AOA along the bulk carrier route effectively targets the GBR and is effective in ameliorating observed and projected changes. The change in  was spread relatively evenly across the continental shelf (figure 3) resulting in increases in
  on most inshore and midshelf reefs (figure 4). Without AOA, the inshore reefs have the lowest
  due to both freshwater addition along the coast and the downstream impacts of coral calcification (Mongin et al
2016). Here, we find that the injection of alkalinity along the shipping route does indeed target inshore reefs. While, in contrast, the reefs along the offshore boundary of the GBR are barely impacted by the alkalinity injection. However, this maybe less important as offshore reefs, while still impacted by global OA, are less exposed to low
due to both freshwater addition along the coast and the downstream impacts of coral calcification (Mongin et al
2016). Here, we find that the injection of alkalinity along the shipping route does indeed target inshore reefs. While, in contrast, the reefs along the offshore boundary of the GBR are barely impacted by the alkalinity injection. However, this maybe less important as offshore reefs, while still impacted by global OA, are less exposed to low  than inshore reefs.

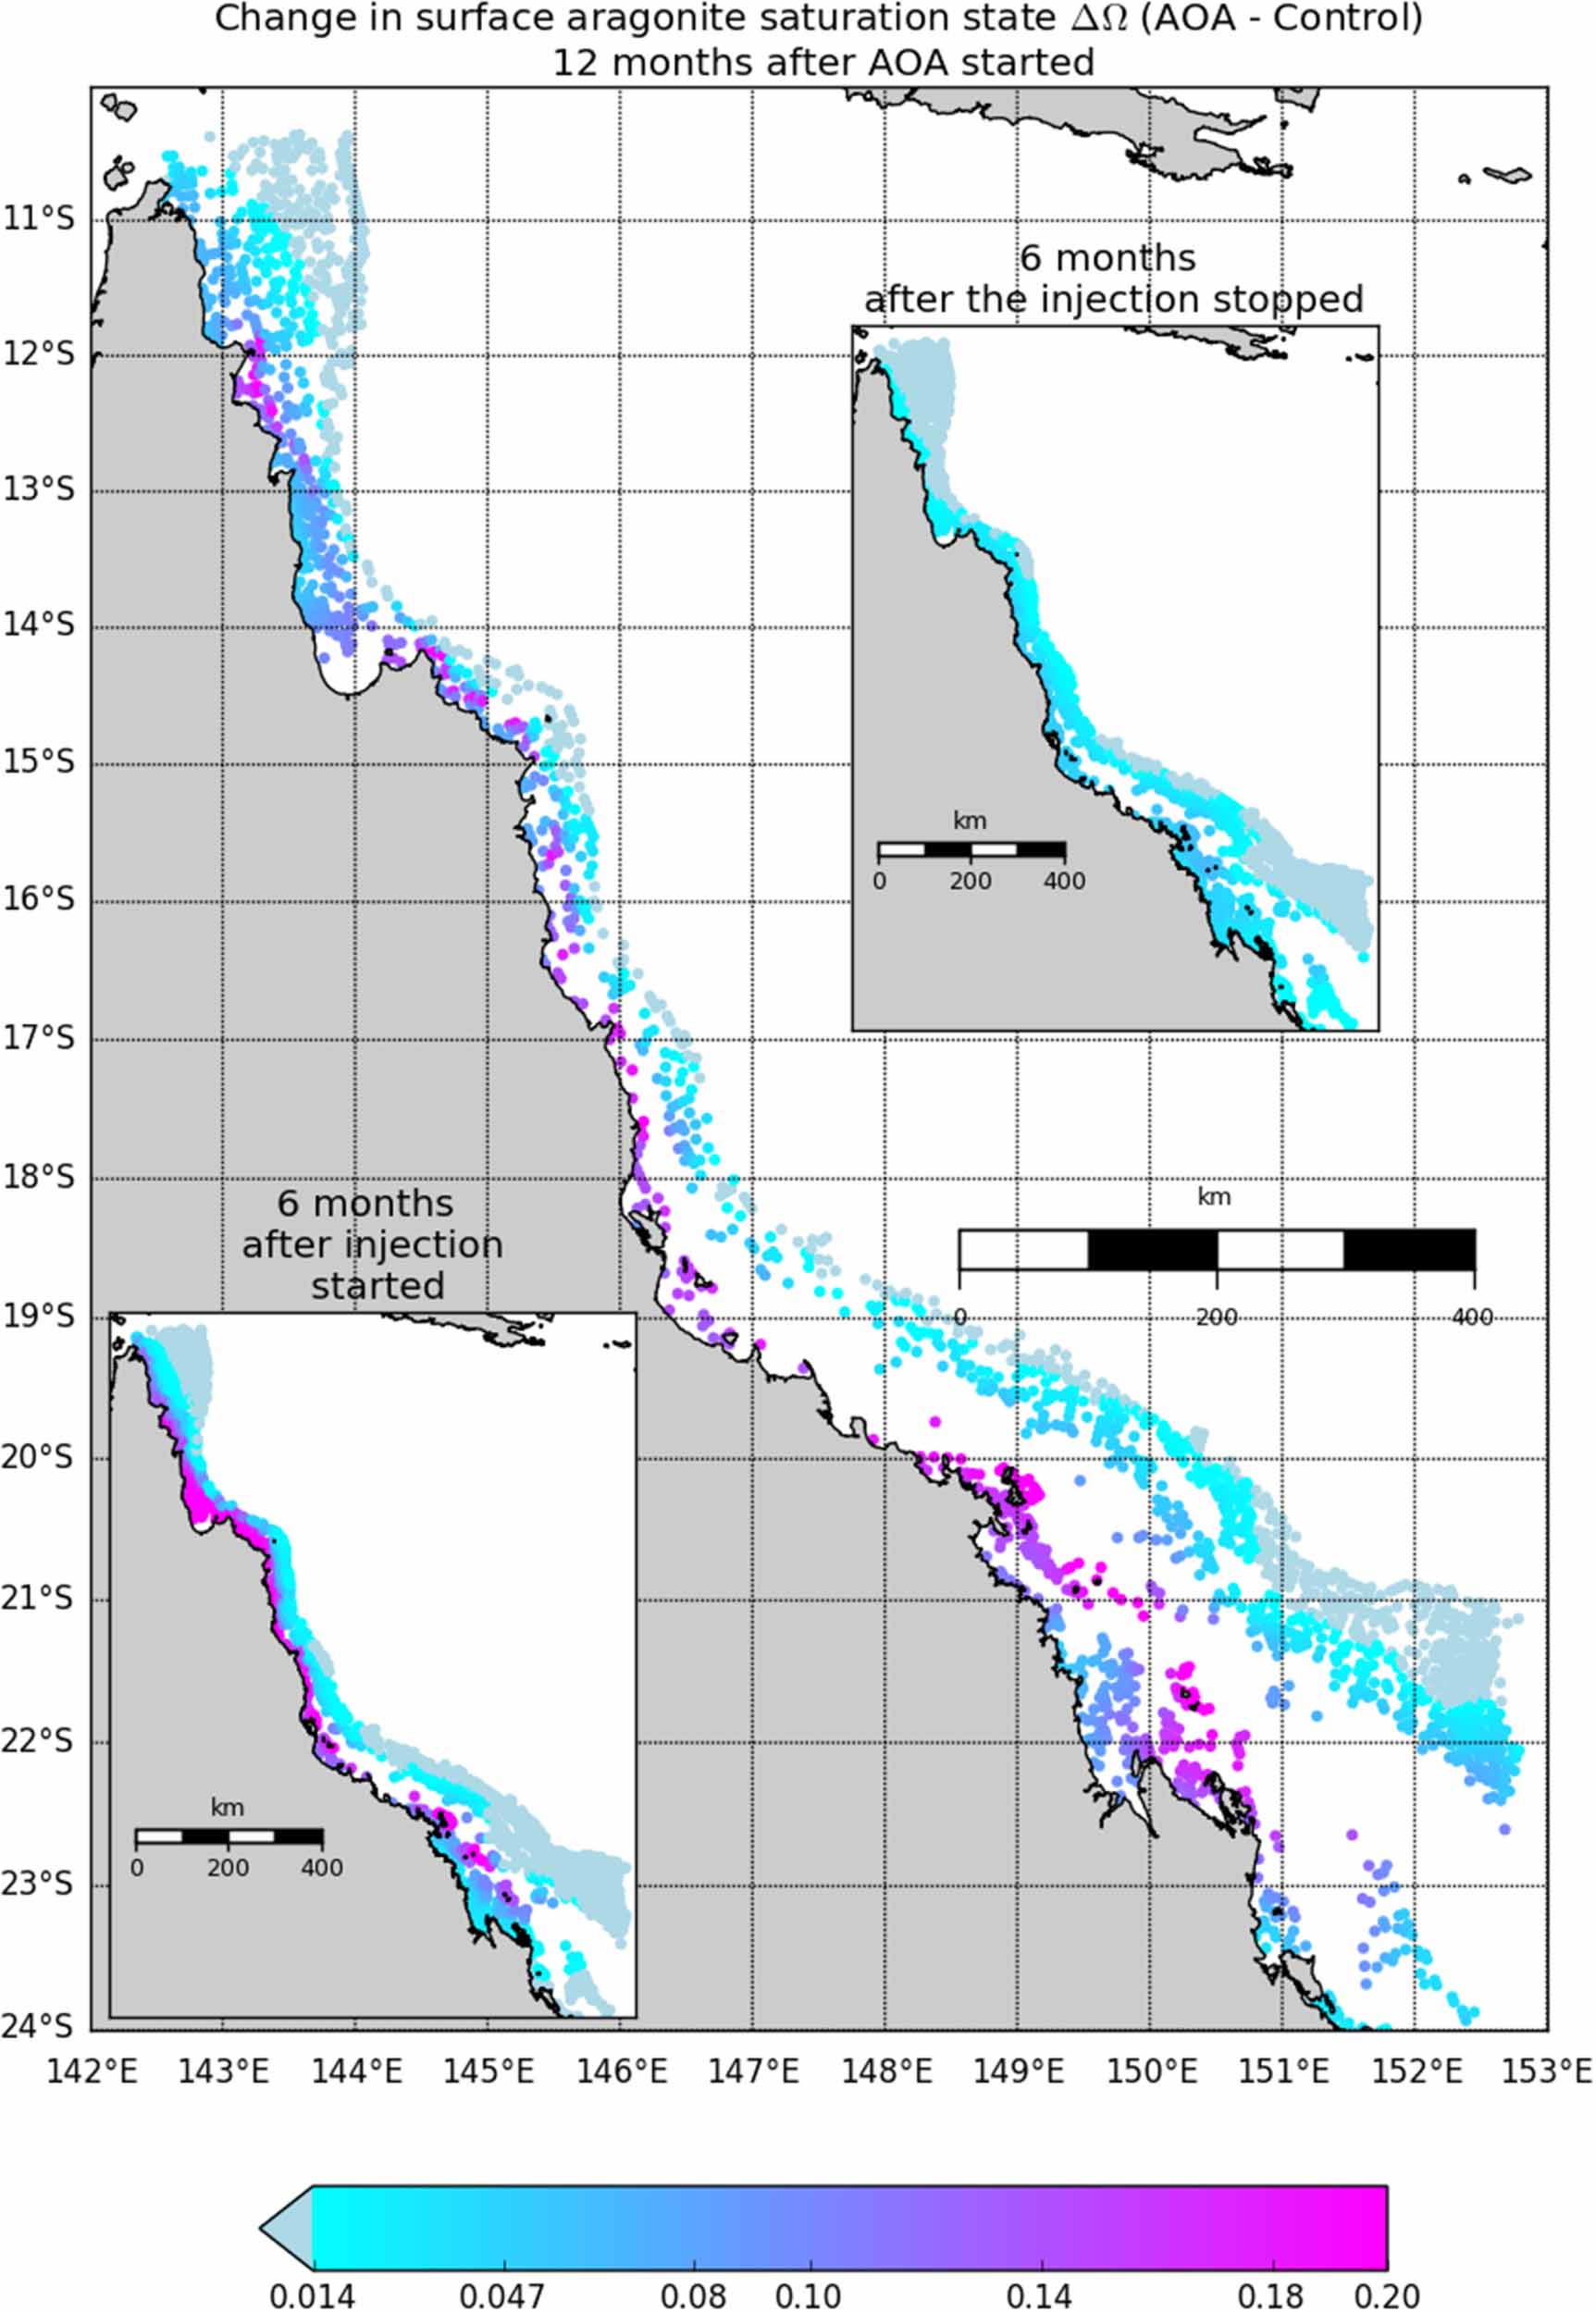
Figure 4. Simulated difference in surface above reef of the GBR  due to AOA. The large background map shows the difference in
  1 year into the AOA (using a 3 d average to remove the effect of the ship location, as shown in figure 3). The embedded left bottom panel shows the result 6 months into the AOA and top right embedded panel 6 months after the 1 year AOA has stopped.
Download figure:
Standard image High-resolution imageOver the the first 6 months of the AOA,  increases along the GBR shipping lane (figure 4). The largest increases are located to the east of the shipping lane again impacting mostly the inshore reefs. After 12 months of AOA, the
  increase spreads further offshore impacting almost the entire GBR with the exception of the fringing reefs (which appear gray coloured dots due to small impacts). The reefs coloured purple on the central panel of figure 4 have had an increase of
  greater than 0.1 following the first year of AOA, corresponding to about 25% of the GBR (in reef numbers). If the AOA is stopped after 12 months, within 6 months the increase of
  reduces to less than 0.05 for almost all the reefs (figure 4 top right insert).
3.4. Carbon chemistry adjustment
Carbon chemistry equilibrium kinetics dictate that the increase in  leads to a decrease in partial pressure of CO2 in the ocean leading to an increase in carbon sequestration. In our experiment we are looking at the impact of alkalinity injection during a 6–12 months time period. At the regional scale the carbon chemistry equilibrium is a result of the interplay between the rate of vertical mixing in the water column, the depth of water, and the rate of air-sea exchange. An analysis of the
  to
to  ratio after 1 year indicates that less than half of the potentially additional sequestrable carbon has been taken up by this ocean; the alkalinity is being mixed vertically in the water column before it could drive CO2 exchange across the air-sea interface. The equilibration and sequestration of CO2 will not be completed during the time the water resides within our model domain, therefore benefiting the reefs as CO2 has not entered the ocean yet, so pH remains higher. We note that the carbon sequestered in the ocean following the AOA is 35 000 t, about 0.0001% of the current CO2 global emissions (assuming 35 Gt of carbon being emitted annually).
3.5. Cessation of AOA
When the AOA is stopped after twelve months,  returns to pre-AOA values over 6 months (brown line continuing into the blue line in figure 5, figure 4, top insert). The time-scale at which the ocean carbon chemistry returns to the non-AOA state is approximately equal across all the reefs (as denoted by the small surface area of the contoured blue lines compared to the contoured brown lines). The reefs that have seen large increases in
  lose the AOA benefit on a timescale similar to the other reefs.
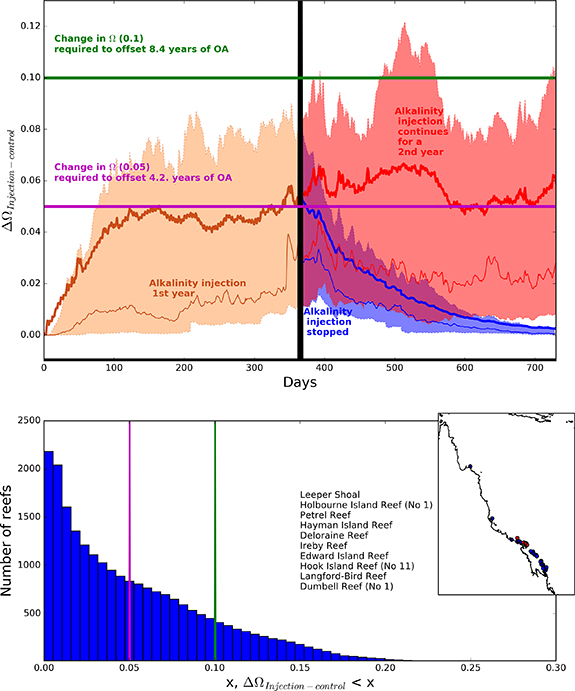
Figure 5. Temporal evolution of mean surface changes in  due to AOA above the GBR reefs. Top panel shows a time series of the median (thin lines) and the mean (thick lines) difference in
  between the AOA and the control simulation for the 2182 model reefs. Brown lines represents the first year of AOA, red lines the second year of AOA, blue lines the second year, but without AOA in the second year. The shaded areas associated with each colour show the interquartile range (25–75 percentiles). The vertical black line shows the 365 d mark. The purple line shows the change in
  required to offset 4.2 years of OA (assuming a present time rate increase of pCO2 in the ocean of 10 µatm per year at 25 ∘C temperature, 35 salinity, 2250 µmol kg−1 of alkalinity and 1950 µmol kg−1 of dissolved inorganic carbon. The green line considering 8.4 years. Lower panel shows the distribution across reefs of the effect of AOA on
  (using a 3 d average like in figure 4), map insert shows the reefs that experience the largest increase in
  , top 50 in blue and top 10 in red (also named).
Download figure:
Standard image High-resolution image
4. Discussion
4.1. Comparison of AOA amelioration to current OA trends
The GBR-wide impact of the alkalinity injection is presented in figure 5. During the first 100 d, the mean change in  (
( ) at the 3860 reefs reaches quasi-steady-state, with a mean value of +0.05 (median +0.03). This steady-state of +0.05
  corresponds to an increase of 10 µatm pCO2 at T = 25 ∘C, S = 35,
  = 2250 µmol kg−1 and
  = 1950 µmol kg−1. An increase of 10 µatm pCO2 in turn is equivalent to 4 years (∼4.2) years of OA when using the observed value of 2.35 µatm pCO2 increase per year in the GBR (Fabricius et al
2020).
= 1950 µmol kg−1. An increase of 10 µatm pCO2 in turn is equivalent to 4 years (∼4.2) years of OA when using the observed value of 2.35 µatm pCO2 increase per year in the GBR (Fabricius et al
2020).
The 25 to 75 percentile (known as interquartile range) covers a range of  between 0.0 and 0.08. We find that the lowest quartile (25%) of the reefs are not impacted significantly by the AOA while the upper quartile (25%) sees
  that is larger than the change required to offset 4.2 years of OA.
The mean change in  following the AOA (+0.05) is on average similar to the variability in
  across reefs (interquartile range: 0.08). This result highlights the challenges we face in detecting changes due to AOA at an individual reef. The variability of the
  is slightly larger during the second year of AOA. This result indicates that under a continuous AOA some reefs will experience significantly higher values (
 ). During the second year of the AOA (red lines and contours figure 5), the mean
  oscillates between 0.04 and 0.06, slightly above that of the first year. Throughout the 24 months of AOA, about 25% of the reefs have an increase in
  greater than the decrease predicted to occur at present anthropogenic carbon emissions over a 4.2 years period, meaning the proposed AOA could be effective at reversing some of the OA.
The variability in the response to AOA of  occurs as a balance between the alkalinity injection, its dilution in the Coral Sea, and the uptake of atmospheric CO2 driven by the reduced partial pressure of CO2 in higher alkalinity waters. The variability highlights that predicting the efficacy of the AOA in a natural environment is complicated (as opposed to a controlled experiment or in climate style model simulations).
The lower panel on figure 5 shows the spatial distribution of  after one year of AOA. About 1000 reefs, almost 40% of the GBR, have an
  larger than what is required to offset 4.2 years of OA. Although the number reduces to about 8% of the GBR if offsetting 8.4 years. To put our results within a reef resilience context (Hoegh-Guldberg et al
2018), we provide the location for the 50 (blue) and 10 (red) most impacted reefs by the AOA (map insert on figure 5). The most impacted reefs are all located within two clusters, one in the northern GBR just south of Princess Charlotte Bay where the shipping lanes are close to the reefs. A second cluster is located in the Mackay/Broad Sound region where dilution by offshore Coral Sea waters is reduced by the presence of the GBR lagoon. None of the 10 most buffered reefs (named in figure 5) have been identified as high value reefs or of special significance as yet, which highlights the need for a more targeted strategy for surveying reefs on the GBR.
larger than what is required to offset 4.2 years of OA. Although the number reduces to about 8% of the GBR if offsetting 8.4 years. To put our results within a reef resilience context (Hoegh-Guldberg et al
2018), we provide the location for the 50 (blue) and 10 (red) most impacted reefs by the AOA (map insert on figure 5). The most impacted reefs are all located within two clusters, one in the northern GBR just south of Princess Charlotte Bay where the shipping lanes are close to the reefs. A second cluster is located in the Mackay/Broad Sound region where dilution by offshore Coral Sea waters is reduced by the presence of the GBR lagoon. None of the 10 most buffered reefs (named in figure 5) have been identified as high value reefs or of special significance as yet, which highlights the need for a more targeted strategy for surveying reefs on the GBR.
Under a continuous AOA, the large amounts of alkalinity being released in the ocean may lead for some reefs to exposure to  greater than experienced in the pre-industrial period. This in turn may have adverse impacts on the marine ecosystem (see review of Renforth and Henderson (2017) and references therein). Furthermore we anticipate the change to be amplified if the magnitude AOA were to be increased suggesting that any adverse effects would be likely found in the regions of largest changes in this study.
It is also important to consider the source of alkalinity used in AOA. The form of alkalinity employed in this study (slaked lime) acts through an abiotic physio-chemical process. However this form of alkalinity represents only one of a number of proposed sources and methods of extraction (Renforth and Henderson 2017). Many of the proposed techniques/methods use fine-crushed ultramafic rocks, or waste material such as mine tailings, as their source of alkalinity; which are known to contain trace metal and/or micro-nutrients. In many cases there will be an impact on biological productivity, for example iron in olivine can significantly enhance ocean productivity (Hauck et al 2016). In practise in future work the biological impacts of AOA will need to be accounted for, but are beyond the scope of this study.
We also note that this modelling study has focused on the feasibility of impacting water column carbon chemistry through AOA, rather than the environmental and ecological risks to the GBR (Mcleod et al 2019). The nature of these risks will depend partly on the delivery mechanism of alkalinity. If it is of a particulate form, the absorption and scattering of the particles, and their deposition on the seabed, are likely to result in changes in the benthic light availability (Bach et al 2019) which has already seen significant changes with anthropogenic sediment inputs (Fabricius et al 2017). Further refinement of the modelling system would allow some of these negative impacts to be modelled.
4.2. Limitations of the modelling system
The most significant limitation of the 4 km coupled hydrodynamic-biogeochemical predictions of the impact of the alkalinity injection occur on small shallow reefs. The 4 km horizontal resolution of the model grid inevitably smooths the actual bottom topography. Individual grid cells containing small ( 16 km2) reefs have a bottom depth that is a mean of the reef top, reef slope and surrounding ocean. With an unrealistically-deep model reef, air-sea and benthic fluxes will have a smaller impact on water column properties than they would above the actual reef. This error is greatest offshore, where shallow reefs reside on a 100+ m deep shelf (Baird et al
2018). In these cases, the model will likely under-predict the feedback between the alkalinity injection and the benthic calcification and dissolution fluxes. The model also does not simulate the wave-enhanced air-sea fluxes over shallow areas. These limitations suggest that shallow reefs in the model are likely to simulate less variance than an actual shelf-scale injection would cause.
16 km2) reefs have a bottom depth that is a mean of the reef top, reef slope and surrounding ocean. With an unrealistically-deep model reef, air-sea and benthic fluxes will have a smaller impact on water column properties than they would above the actual reef. This error is greatest offshore, where shallow reefs reside on a 100+ m deep shelf (Baird et al
2018). In these cases, the model will likely under-predict the feedback between the alkalinity injection and the benthic calcification and dissolution fluxes. The model also does not simulate the wave-enhanced air-sea fluxes over shallow areas. These limitations suggest that shallow reefs in the model are likely to simulate less variance than an actual shelf-scale injection would cause.
Consequently, we have focused our analysis on the changes in the water column  and
and  that characterise the impact of the injection and are primarily driven by regional scale processes and therefore not sensitive to the limitations mentioned above. Ultimately this study should be repeated using a much finer scale model, to better capture the physical and biogeochemical processes, however at present these high-resolution models are still under development.
4.3. Concluding comments
Actively enhancing the role of the ocean in buffering the impact of ocean acidification in response to excess atmospheric CO2 is starting to be widely considered but will require a new set of research studies and management tools (http://oceannets.eu) to be developed (Gattuso et al 2018). The potential efficacy of artificially increasing the ocean buffering capacity has been explored at the global scale in an Earth system context (Keller et al 2018, Lenton et al 2018). Researchers are exploring the impact at the regional and local scales, where any impacts of AOA will be felt (Albright et al 2016). This study is bridging the gap between these two scales, exploring how AOA could be undertaken at the scale of the GBR. This work also differs from large-scale geoengineering studies that consider AOA as a means to balance anthropogenic inputs of carbon (Köhler et al 2013), and instead focuses on reducing the impact of ocean acidification. In this way we can consider AOA at the scale of GBR not as geoengineering, but as Environmental Engineering with carbon co-benefit.
Data availability statement
The data generated and/or analysed during the current study are not publicly available for legal/ethical reasons but are available from the corresponding author on reasonable request.
Acknowledgments
This study was undertaken with the support of CSIRO Oceans and Atmosphere, and through resources made available through the eReefs project (http://ereefs.org.au/ereefs), a public-private collaboration between Australia's leading operational and scientific research agencies. The Future Reef Map project was funded through GBRF by Rio Tinto and CSIRO. We thank our many colleagues involved in developing the eReefs models, including Jenny Skerratt, Mike Herzfeld, John Andrewartha, Emlyn Jones, Farhan Rizwi, Nugzar Margvelashvili, Karen Wild-Allen, Cedric Robillot and Andy Steven. We thank the officers and crew of RTM Wakmatha for their assistance and hospitality on 41 voyages. We also acknowledge the expertise and leadership of Bronte Tillbrook in developing the Future Reef Map project. Lastly we would like to thank the two anonymous reviewers for their thorough and detailed suggestions and comments that have improved the focus and content of this manuscript.