

Abstract
Wintertime extreme precipitation from cyclone clusters, i.e. consecutive cyclones moving across the same region, can lead to flooding and devastating socio-economic impacts in Europe. Previous studies have suggested that the future direction of the changes in these events are uncertain across climate models. By employing an impact-based metric of accumulated precipitation extremes, we show that projections of cyclone clusters are instead broadly robust, i.e. consistent in sign, across models. A novel physical diagnostic shows that accumulated precipitation extremes are projected to grow by only +1.0 %/K on average across Europe, although the mean precipitation per cyclone increases by +4.7 %/K. This results from a decreased number of clustered cyclones, associated with decreased wintertime storminess, the extent of which varies from northern to southern Europe and depends on the future storyline of atmospheric circulation change. Neglecting the changes in the number of clustered cyclones, i.e. assuming that accumulated precipitation extremes would change as the mean precipitation per cyclone, would lead to overestimating the population affected by increased accumulated wintertime precipitation extremes by 130–490 million across Europe.
Export citation and abstract BibTeX RIS

Original content from this work may be used under the terms of the Creative Commons Attribution 4.0 license. Any further distribution of this work must maintain attribution to the author(s) and the title of the work, journal citation and DOI.
1. Introduction
Extratropical cyclones are the main drivers of wintertime precipitation in Europe. When a sequence of cyclones moves across a specific region within a short time period (known as cyclone clustering), the resulting precipitation is accumulated before it can drain away and this can result in extreme flooding leading to severe socio-economic impacts [1–4]. For example, persistent synoptic conditions led to a near-continuous sequence of cyclones in the southern UK at the beginning of February 2014, causing severe impacts to livelihoods and infrastructure [5–7]. Understanding how these types of weather events will respond to global warming is crucial for society to adapt to their potential changes in location, duration, and intensity [3, 8–10].
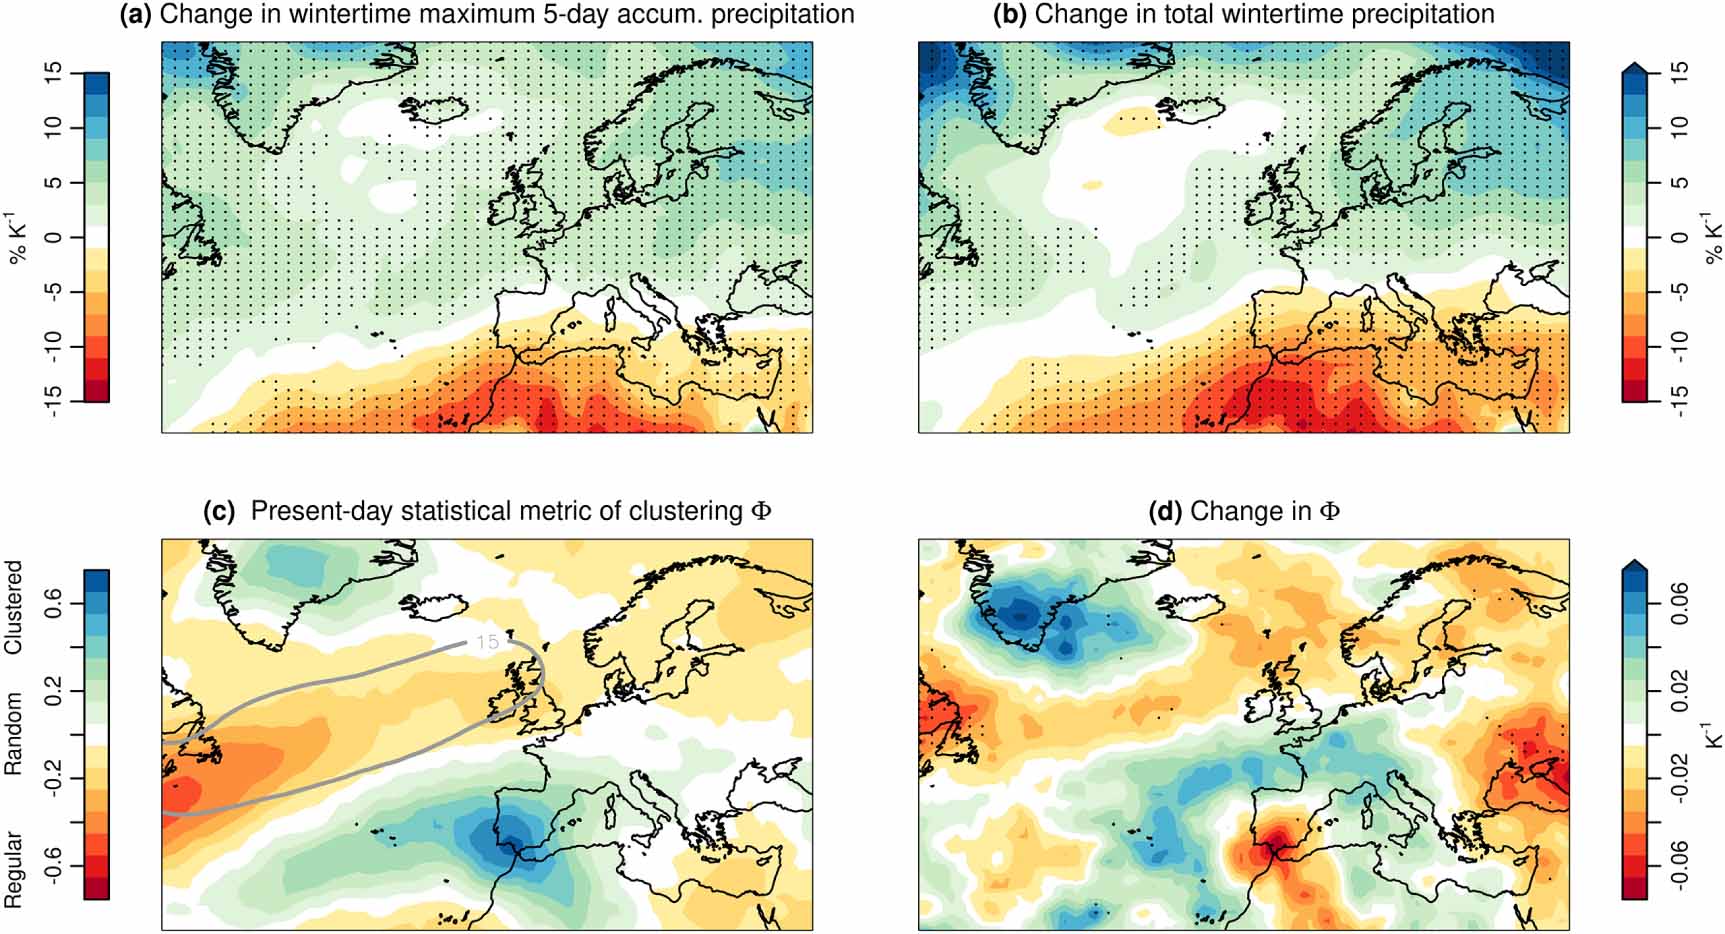
Traditionally, the IPCC reports [11] indirectly account for the dynamics of these sustained wet conditions via focusing on future changes of annual maximum accumulated precipitation over fixed time windows, e.g. 5 days (referred to as the Rx5day index). A potential drawback of using a fixed time window is that the duration of precipitation episodes from cyclone clusters is event- and location-dependent. Changes in total wintertime precipitation can also provide indirect information on precipitation changes from multiple cyclones, given that, in Europe, cyclones produce most of the wintertime precipitation [1, 2]. Changes of both indices show a tendency towards higher and lower accumulated wintertime precipitation over Northern and Southern Europe, respectively, though some differences exist, e.g. in the position of the boundary delimiting drying and wetting (figure 1(a) and (b); data are described in section 2.1). However, neither index can fully resolve the dynamics of precipitation extremes from individual cyclone clusters, thus leaving open the question of how these events may change in the future.

Figure 1. Future changes in accumulated precipitation and cyclone clustering depicted by traditional metrics. Multimodel mean percentage changes per degree of global warming (%/K) in (a) wintertime annual maximum 5-day accumulated precipitation (Rx5day) and (b) wintertime total accumulated precipitation. (The percentage change per degree of global warming is defined in the appendix.) (c) Multimodel mean of the statistical metric of clustering φ for the period 1975–2004 (which indicates that cyclone occurrences at a given location tend to be regular ( ), random (φ = 0) or clustered in time (
 ); see appendix). The grey contour in c indicates the core of the North Atlantic storm-track: the enclosed area shows where the average number of cyclones per winter month per unit area (equivalent to a 10° latitude spherical cap, i.e.
  ) is higher than 15. (d) Multimodel mean of the changes per degree of global warming in φ. In a, b, and d, stippling indicates locations where at least 80% of the models agree on the sign of the changes; changes are between future (2081–2098) and past (1975–2004) climates.
Download figure:
Standard image High-resolution imageAn assessment of precipitation extremes from consecutive cyclones requires a focus on the clustering dynamics. Previous studies have analysed cyclone clustering independently from the associated accumulated precipitation amounts, rendering it difficult to link the clustering with precipitation-driven impacts. In particular, they have tended to focus on a statistical metric (φ) that quantifies whether cyclone occurrences at a given location tend to be regular, random or clustered in time [12–16], regardless of the local cyclone frequency (see the mathematical definition of the metric φ in the appendix). Note that this statistical metric is not well representing impacts as it does not take the number of cyclones within a cluster into account. For example, although the statistical metric indicates clustering is highest around Spain, another area where cyclones are more frequent (e.g. around the UK; figure 1(c)) may be exposed to more populated clusters. While changes in total wintertime precipitation are robust in sign across models (stippling in figure 1(b)), when analysing the metric φ, these studies found projected cyclone clustering changes in Europe to be small and inconsistent in sign [13, 14, 17] (figure 1(d); see near-absence of stippling). However, it is crucial to consider the actual cyclone frequency, especially in a climate-change context where the population of cyclones within each storm-track can be affected by multiple processes [3]. Although the changes in the North Atlantic and European storm-tracks may be uncertain in severity [18], the direction of these changes has been found to be quite robust across climate models, with an increased cyclone frequency over the UK and northern Europe and a reduction in Southern Europe [19, 20].
Given the large impacts caused by wintertime cyclone clustering events in Europe [5–7, 21], there is a need to distil robust societally relevant information about future changes in these extreme events [4]. To this end, we investigate whether an impact-based metric, in combination with a physical diagnostic, can contribute to better understand future changes and uncertainties of the different drivers of precipitation extremes from cyclone clustering.
2. Methods
We apply a physically-based scaling that allows for decomposing and understanding the changes of wintertime (December–February) accumulated precipitation extremes from cyclone clustering projected by climate models.
2.1. Data
We employ simulations [22] from models of the Coupled Model Intercomparison Project Phase 5 (CMIP5), i.e. BCC-CSM1-1, BCC-CSM1-1-m, CCSM4, CMCC-CM , GFDL-CM3, GFDL-ESM2G, GFDL-ESM2M, INMCM4, IPSL-CM5A-LR IPSL-CM5A-MR, MIROC5, MIROC-ESM, MIROC-ESM-CHEM, MRI-CGCM3, NorESM1-M (r1i1p1 for all models, but r6i1p1 for CCSM4). We also use data from ERA-Interim reanalysis [23] to evaluate the fidelity of the CMIP5 models for the purpose of the study. The precipitation rate associated with the 6-hourly time steps of the cyclone tracks was derived from the 3-hourly precipitation rate averaged over the three hours before and after the cyclone time step of interest. For CMIP5 models, precipitation is obtained for the past during 1975–2004, and for the future during 2081-2098; the latter period is shorter because of the limited data availability of CMIP5 output for 3-hourly precipitation [19]. For ERA-Interim, we analyse the period 1979–2008, given that this dataset is available from 1979 onward.
Cyclones were identified and tracked based on the objective feature tracking algorithm TRACK [24–26]. The algorithm identifies and tracks cyclones based on the 850 hPa relative vorticity field, which is obtained from the 6-hourly zonal and meridional wind fields. To filter the small-scale noise and the large-scale background field, the 850 hPa relative vorticity field is smoothed on a T42 grid by removing the spectral components of total wavenumbers larger than 42 and smaller than 6 [19, 27]. After identifying cyclones as relative maxima (exceeding 10−5 s−1) of the obtained vorticity field, tracks are determined through the minimisation of a cost function for the smoothness of the track [19, 24]. Only cyclone tracks that have a lifetime greater than 2 days and propagation greater than 1112.6 km (corresponding to 10° latitude) are retained to avoid including potential unrealistic stationary and short-lived features. Finally, a cyclone track is characterised by a sequence of 6-hourly time steps, each associated with time and geographical coordinates.
The analyses are performed on the original grids of each model and then the resulting fields are regridded to a common 1 grid to compute multimodel statistics. For graphical purposes, the multimodel statistics are then interpolated to a finer grid.
We employ population data [28] for the future, which is available every 10 years; hence we use data for 2090. Future data are based on projected populations and gross domestic products under the three shared socioeconomic pathways (SSP): SSP1; SSP2; and SSP3. Uncertainties associated with differences among climate model projections are substantially larger than those due to different population in SSP scenarios, therefore we report results based on the intermediate SSP2 future scenario only.
2.2. Definition of the cyclone clusters and associated characteristics
To define cyclone clusters and the associated precipitation, we first identify the cyclones transiting within a radius of influence R of any location of interest; here, we select and employ R = 1112.6 km (corresponding to 10° latitude) as discussed in the appendix (therein, we also show that the results of the study are insensitive to the chosen radius).
Secondly, we attribute to each identified cyclone j the precipitation accumulated at the location ( ) while the cyclone is within such radius of influence R [1, 29]. (If more than one cyclone at the same time is present within the radius R, the 6-hourly precipitation is divided among the cyclones proportionally to the inverse of the distance between the cyclone centre and the location.)
Thirdly, we define a cluster of cyclones as a sequence of  consecutive cyclones transiting within the 1112.6 km radius of the location of interest with an elapsed time between them smaller than 24 h.
Finally, the sum of the precipitation attributed to each cyclone within the cluster gives the accumulated precipitation associated with the cluster, i.e.  . The mean precipitation per cyclone within the cluster is defined as
  .
.
3. Results
3.1. Decomposition of accumulated precipitation extremes and associated changes
We decompose the wintertime precipitation extremes from clustered cyclones into the number of clustered cyclones and the mean precipitation of the cyclones within the clusters. In particular, for any given location, we decompose the mean of the annual maxima (indicated with the operator  ) of the wintertime precipitation from clustered cyclones
  as:
as:

where  and
and  are the number and the mean precipitation of the cyclones within the clusters associated with the annual maxima of
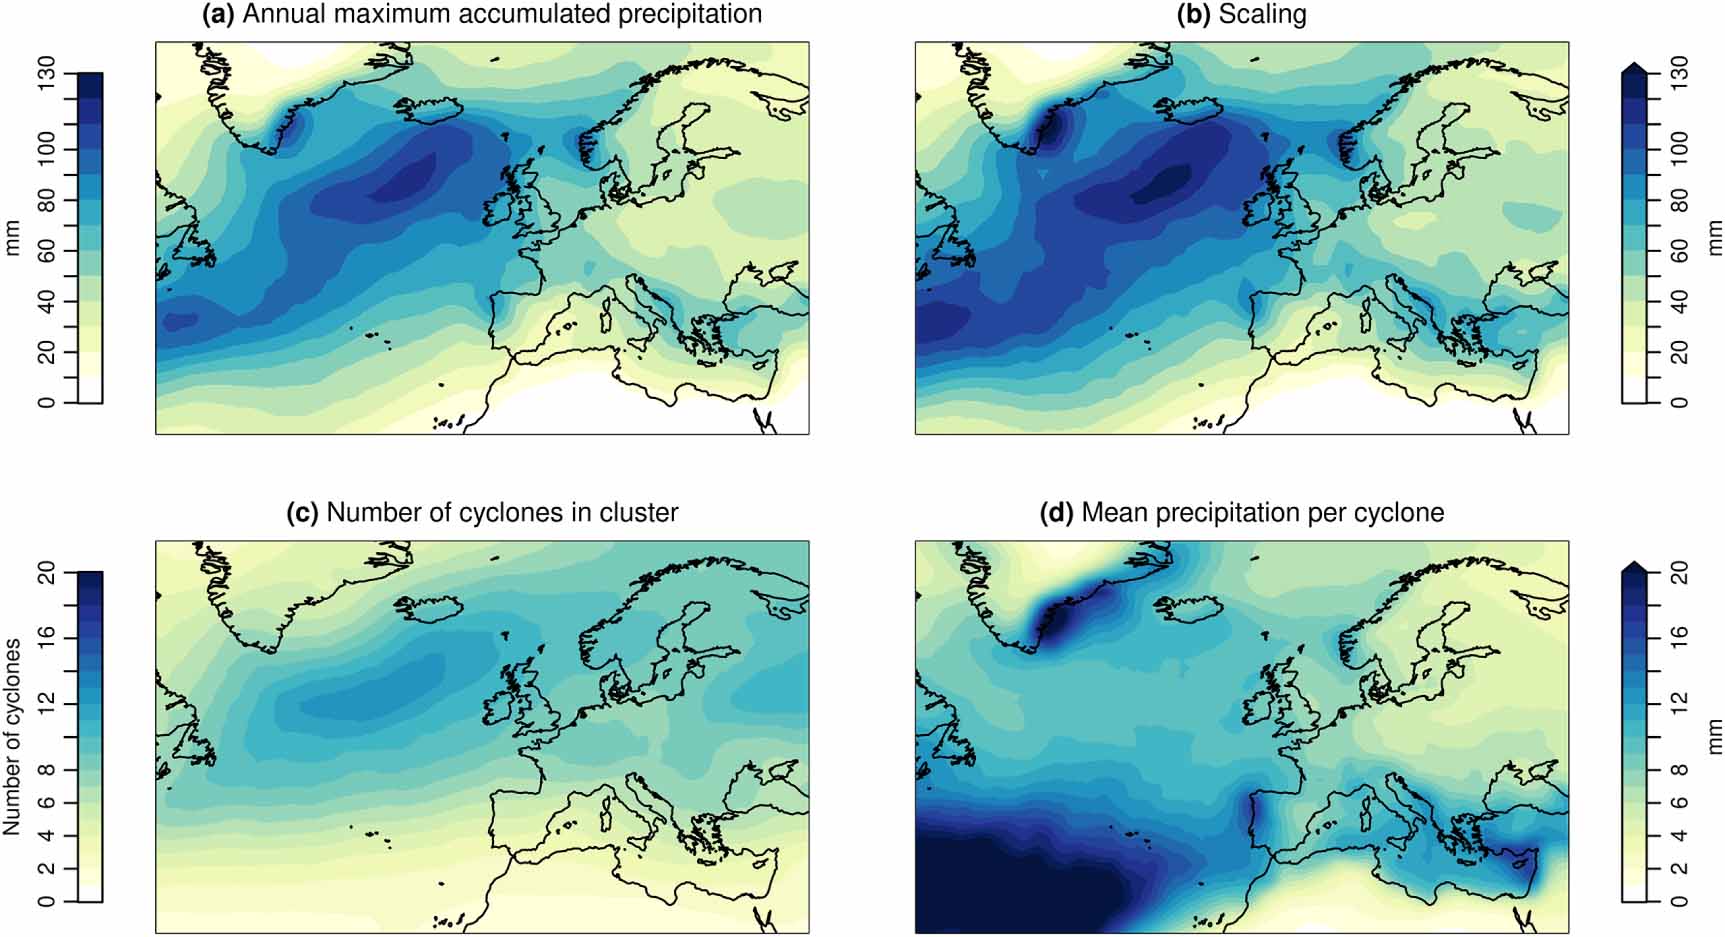
  (figure 2; figure B1 in appendix shows the same quantities based on reanalysis data, confirming the fidelity of the CMIP5 models for this purpose). Precipitation extremes from cyclone clusters are largest in Western Europe, due to the potential for very long and populated cyclone clusters (figure 2(a) and (c)); and in the Northern Mediterranean area, where clustered cyclones are fewer but their precipitation intensity is higher (figure 2), consistent with the higher temperatures and atmospheric moisture content. The scaling, i.e. the right-hand side of the equation (1), describes to good approximation the precipitation extremes
  (figure 2(a) and (b)) both for individual models and for the multimodel mean. Over the analysed area, the scaling only slightly overestimates the magnitude of the precipitation with an average present-day absolute value of the bias of 9 mm (18% in relative terms) in the multimodel mean (
 11 mm (22%) for individual models). The spatial pattern of
  is very well represented by the scaling (spatial correlation
  for individual models and 0.99 for the multimodel mean).
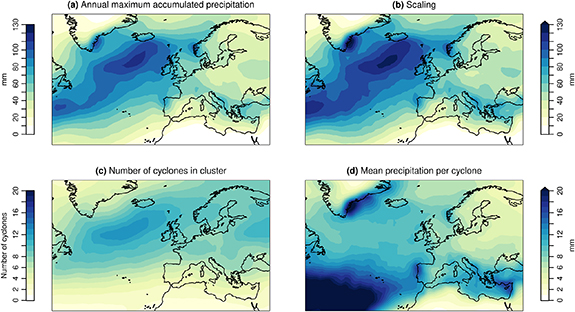
Figure 2. Mean annual maximum accumulated precipitation from cyclone clustering and associated scaling. Multimodel mean of the (a) mean annual maximum accumulated precipitation and the (b) associated scaling shown on the right-hand side of equation (1), for the period 1975–2004. Multimodel mean of (c) the number of cyclones within the cluster and (d) mean-precipitation per cyclone within the clusters leading to annual maxima of accumulated precipitation from cyclone clustering.
Download figure:
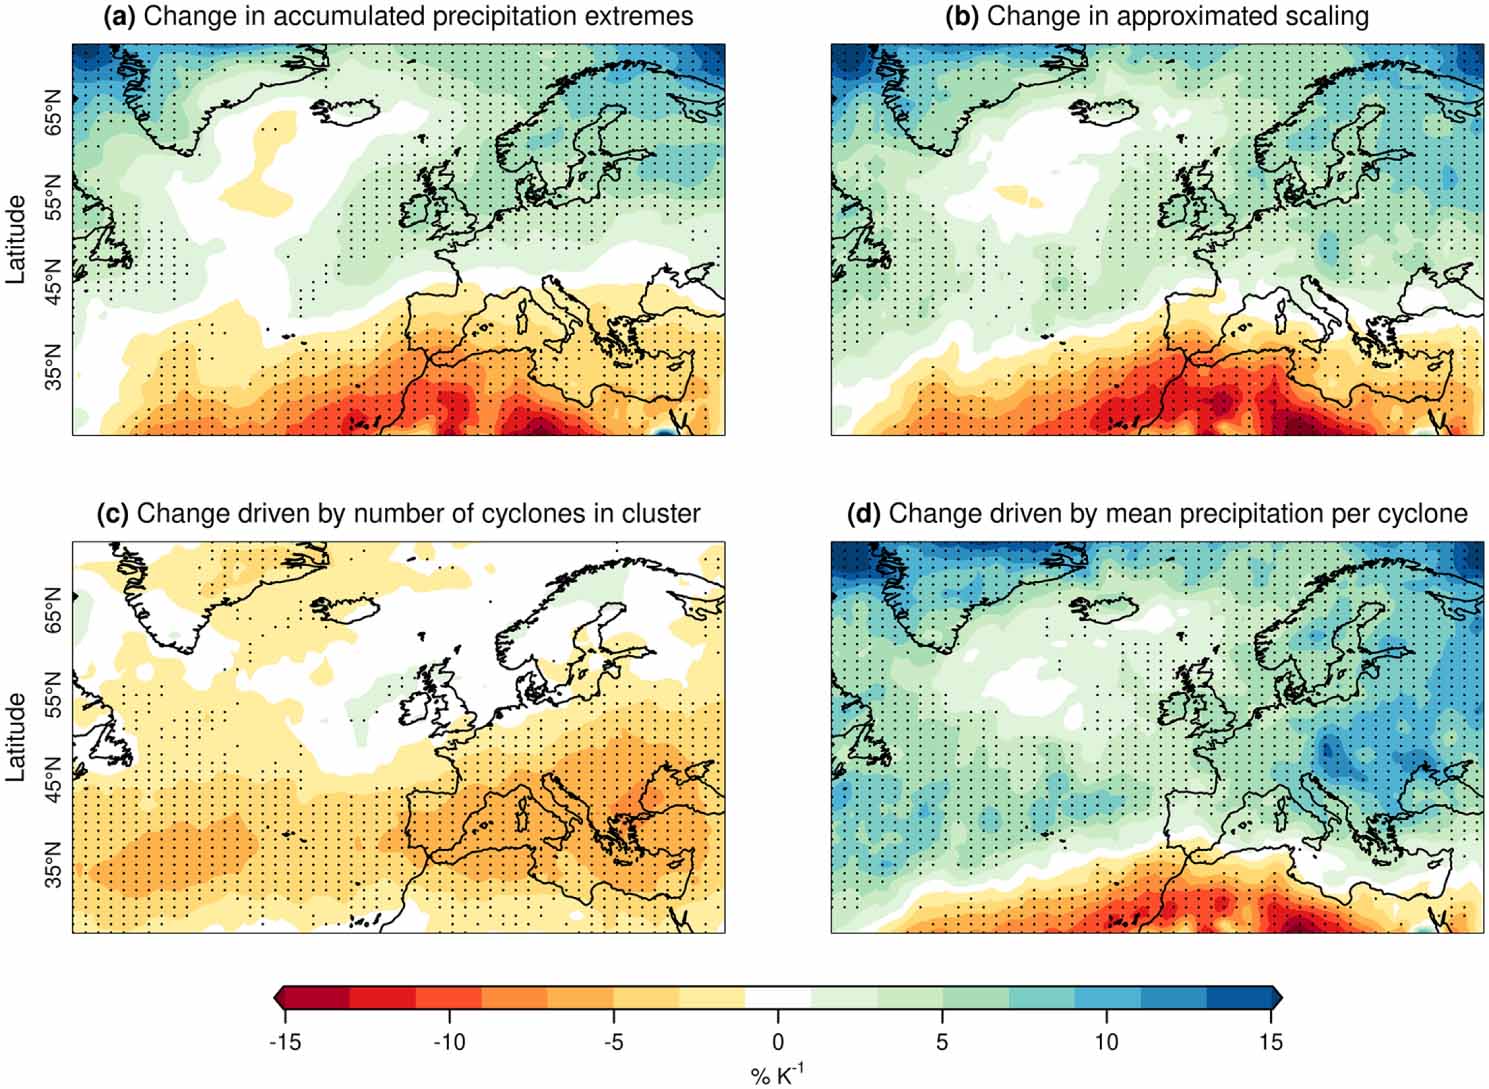
Standard image High-resolution imageAt the end of the century, under a high emissions scenario (RCP8.5)[22] accumulated precipitation extremes are projected to increase at latitudes above 45° north, and to decrease over the regions of the Mediterranean Basin (figure 3(a)). The scaling also describes remarkably well these future changes (figure B2(a) and (b)). The correlation of the spatial pattern between changes in the accumulated precipitation and in the scaling is high (0.99 in the multimodel mean and  for individual models). The percentage change per degree of future warming in the scaling can be decomposed exactly as
where ΔT represents the magnitude of the future warming (see appendix); but the last, second-order, term is much smaller than the first two, and only plays a role where the first two largely cancel (figure B2(c) in the appendix). Hence, the percentage changes in the accumulated precipitation  can be decomposed to good approximation into the sum of percentage changes in the number of cyclones within the cluster and in the mean precipitation of the individual cyclones (compare figures 3(a) and (b)), i.e.:
The first term on the right-hand side can be considered as a dynamical contribution to the change in accumulated precipitation extremes, and the second term as a combination of dynamic and thermodynamic effects. We now employ the scaling to decompose the change in accumulated precipitation extremes into the individual contributions from the changes of its drivers, i.e.  and
and  .
.

Figure 3. Future changes in mean annual maximum accumulated precipitation from cyclone clustering. Multimodel mean (a) percentage changes per degree of global warming (%/K) in annual maximum accumulated precipitation and (b) approximated change (%/K) in the associated scaling. Attribution of these changes to changes in (c) number of cyclones and (d) mean-precipitation per cyclone within the clusters leading to annual maxima of accumulated precipitation. Stippling indicates locations where at least 80% of the models agree on the sign of the changes. Changes are between future (2081–2098) and past (1975–2004) climates.
Download figure:
Standard image High-resolution image3.2. Future changes in the number of cyclones within the clusters
A robust reduction in the number of cyclones within the clusters contributes to a decrease in the accumulated precipitation amounts over 83% of the European region (figure 3(c); IPCC regions are shown in figure B3 in appendix). This corresponds to shorter-duration clusters in the future over most of the analysed area, given that less populated clusters last shorter (figure B4 in appendix). The mean change of the number of clustered cyclones over Europe is −2.9% per degree of warming which, given an average warming of about 4.3°K under the considered RCP8.5 scenario, corresponds to a reduction of about 12.5% in the number of clustered cyclones by the end of the century. This reduction is particularly large south of 55° latitude, with projected values of about −3.4 and −5.2 %/K in Central Europe and in the Mediterranean, respectively.
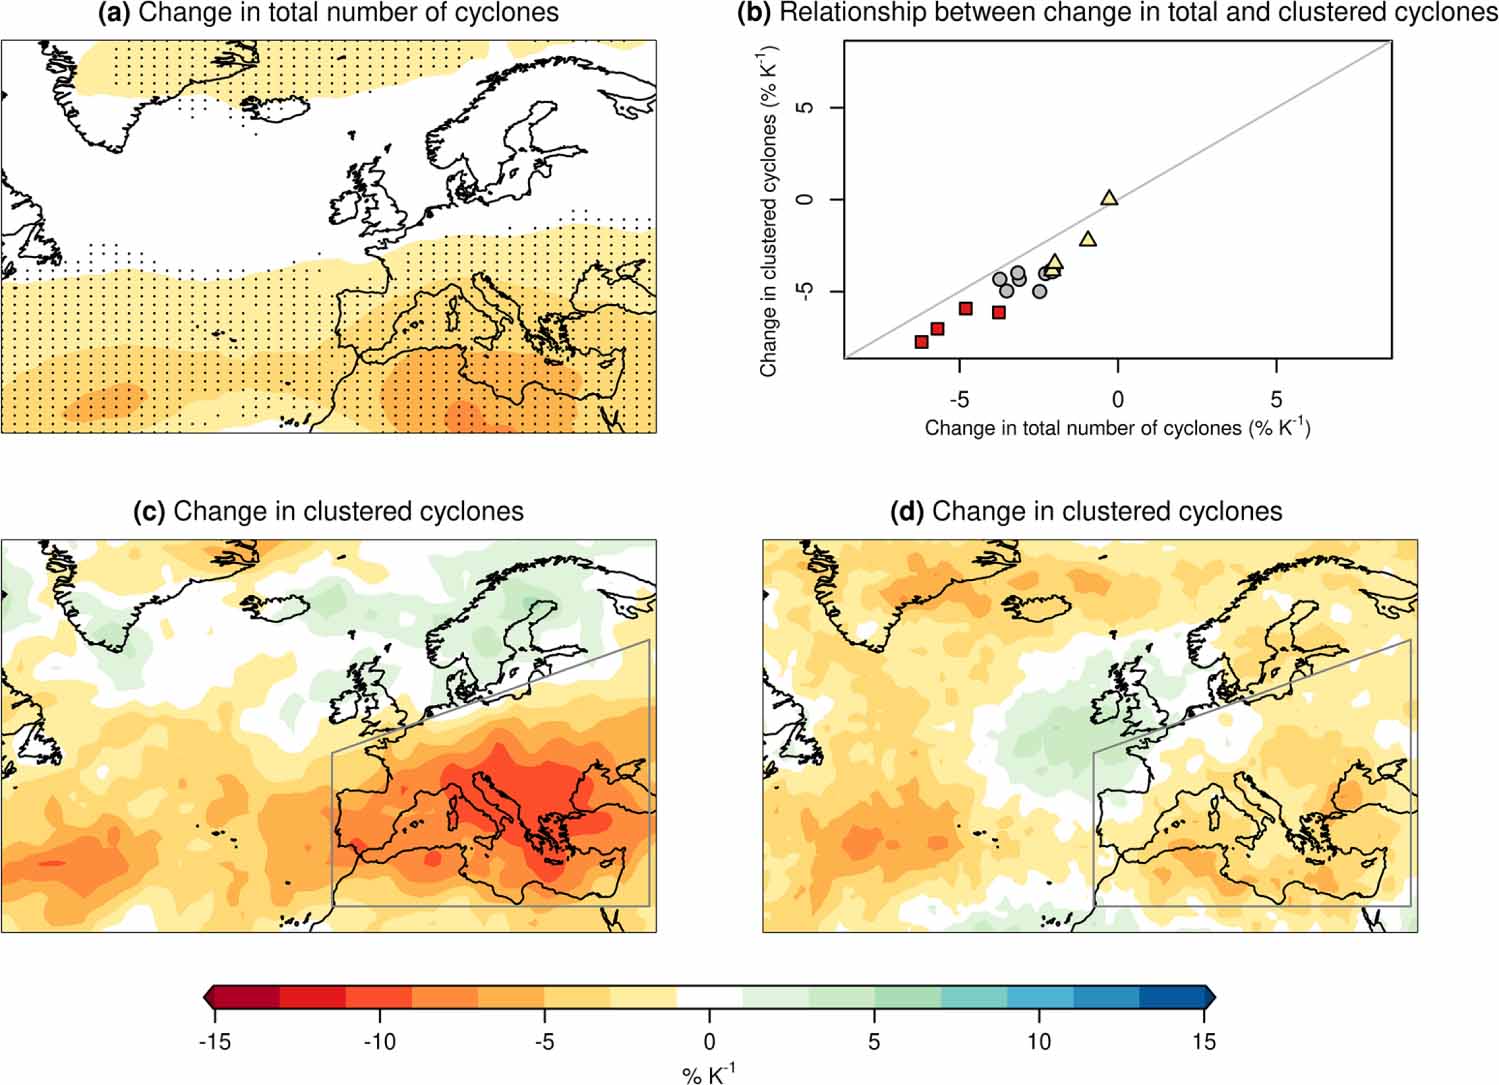
We find that such a reduction in the number of clustered cyclones (figure 3(c)) is consistent with a general decrease of the total number of wintertime cyclones (figure B5(a) in appendix), while no association with changes in the statistical metric φ is apparent (figure 1(d)). This decrease occurs north of Iceland, over the southern flank of the Atlantic storm-track, and in the Mediterranean (figure B5(a) in appendix). Only a negligible change in the number of clustered cyclones is found in Northern Europe (−0.1 %/K) (figure 3(c)); this is consistent with the fact that the regional change in cyclone frequencies is small compared to the climatology (figure B5(a) in appendix).
The relation found between the reduction of wintertime clustered and total cyclones is confirmed by the fact that in Central Europe and in the Mediterranean, i.e. where most of the reduction in the number of cyclones occurs, models with a stronger/weaker reduction in the number of wintertime cyclones tend to also project a stronger/weaker reduction in the number of clustered cyclones (figure B5(b)–(d) in appendix). In particular, the strong association found across the model ensemble between changes in the number of wintertime total and clustered cyclones ( = 0.93; figure B5(b) in appendix) indicates that even in the individual climate realisations, the influence of changes in the statistical metric φ on changes in the number of clustered cyclones tends to be small. Hence, less frequent cyclones are projected to lead to less populated cyclone clusters across large parts of Europe regardless of the tendency towards higher/lower statistical clustering in time depicted by the metric φ.
3.3. Future changes in the mean precipitation per cyclone within the clusters
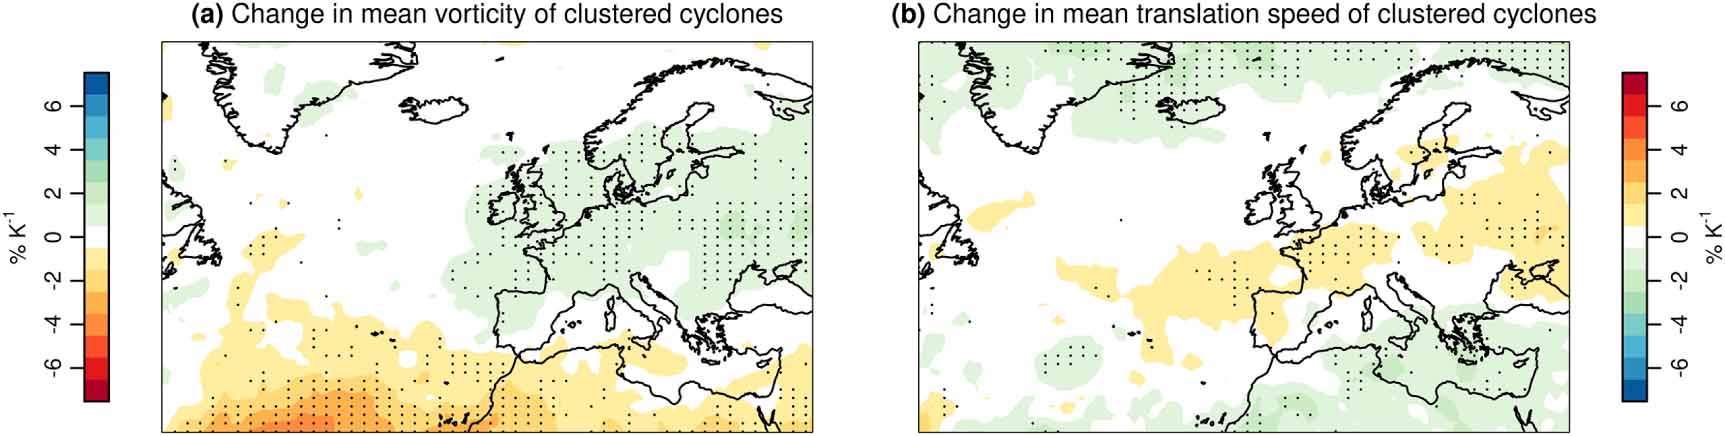
The changes in the mean precipitation per cyclone within the clusters drive an increase in accumulated precipitation extremes over 86% of the European region (mean of +4.7 %/K), especially in Central (+8.2 %/K) and Northern Europe (+5.9 %/K) and to a lesser extent in the Mediterranean (+1.5 %/K) (figure 3(d)). To first-order, these increases can be explained by an average thermodynamic effect, i.e. a warmer atmosphere will allow storms to carry more moisture and result in higher precipitation intensities [8, 30–32]. However, other thermodynamic and dynamic factors will further modulate precipitation intensities [33–35]. For example, weaker upward motion during precipitation events (reducing the condensation rate) would offset the thermodynamic increase around Iceland [33]. In central Europe, the thermodynamic increase is modulated by competing effects such as higher cyclone intensities and a speed-up of cyclone translation speeds [36, 37] (figure B6 in appendix). The former favours higher moisture flows within the cyclone leading to higher precipitation rates and accumulations [38], while cyclones translating faster lead to shorter local precipitation events and therefore lower accumulations [39–44]. Along the southern flank of the North Atlantic storm-track region, e.g. in Northern Africa, the weakening of the cyclone intensities [38] and an associated decrease in upward velocities during precipitation extremes [33] can even reverse the first-order thermodynamic increase (figure 3(d)), contributing to the relatively weak increase (+1.5 %/K) of mean precipitation from cyclones across the Mediterranean region.
3.4. Resulting changes in accumulated precipitation extremes
The magnitude of the changes in the drivers of accumulated precipitation from cyclone clustering, i.e.  and
and  , are comparable over many populated land areas (figure 4). Hence, both changes should be considered together to quantify and understand the overall trends in the accumulated precipitation extremes and avoid biased assessments that could be misleading for policy-making and engineering practices. Over the European region, the decreased number of clustered cyclones is responsible for a northward shift of the dry-wet boundary seen in the multimodel mean of
  of about, on average, 1200 km, compared to that seen in the mean precipitation per cyclone (figure 3(a), (d) and light orange area in figure 4). Note that the approximated change of the scaling given on the right-hand side of equation (2) underestimates the extent of this northward shift, as the second-order term is negative over the region where the approximated change of the scaling transitions from wetting to drying.
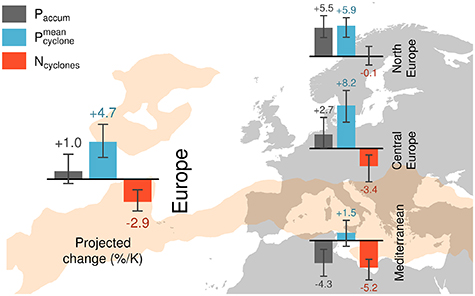
Figure 4. Regional changes and uncertainties in accumulated precipitation from cyclone clustering and associated drivers. Light orange shading indicates the area where, despite a multimodel mean increase in the mean precipitation per cyclone, the accumulated precipitation extremes decrease because of a reduction in the number of clustered cyclones. Bar plots show the regional mean of the multimodel mean changes in mean-precipitation per cyclone ( ), number of cyclones within the cluster (
 ), and accumulated precipitation from cyclone clustering (
 ). Error bars show the 80% range of the regional mean changes based on the model ensemble. Note that although the sum of the changes in
  and
and  is to good approximation equal to the change in
  at any location, the same does not apply exactly for the mean regional changes shown in the figure. Changes are between future (2081–2098) and past (1975–2004) climates. The regions are based on the IPCC SREX report [11] and are shown in figure B3 in appendix.
Download figure:
Standard image High-resolution imageBased on the multimodel mean, accumulated precipitation extremes increase over 60% of the European region. In Central Europe, despite a large regional increase in the mean precipitation per cyclone (+8.2 %/K), accumulated precipitation extremes are projected to grow by only +2.7 %/K due to the reduction in the number of clustered cyclones (figure 4). In the Mediterranean, the substantial decrease in the number of clustered cyclones is projected to more than offset the increase seen in the mean precipitation per cyclone (+1.5 %/K), resulting in a reduction of –4.3 %/K in accumulated precipitation extremes. Only in Northern Europe is the regional increase in accumulated precipitation extremes (+5.5 %/K) described to good approximation by considering the changes in mean precipitation per cyclone alone. Changes at sub-regional level are shown in table B1 in appendix.
3.5. Storylines of future changes
Taking a probabilistic interpretation of the CMIP ensemble, the uncertainties in the changes of mean precipitation per cyclone and of the number of clustered cyclones contribute similarly to the overall uncertainty in the changes of accumulated precipitation (see error bars of orange and blue histograms in figure 4). The uncertainty in the change of accumulated precipitation is generally smaller than what would be expected based on the uncertainty in the changes of the two individual drivers (see error bars in figure 4). This occurs because the changes of the drivers tend to be negatively correlated across models at the grid point scale. The above highlights the importance of considering the local uncertainties in the evolution of both drivers together, rather than focusing on the uncertainties of the individual drivers alone/independently, to avoid potentially under-confident, and therefore misleading, projections of the local future risk [45].
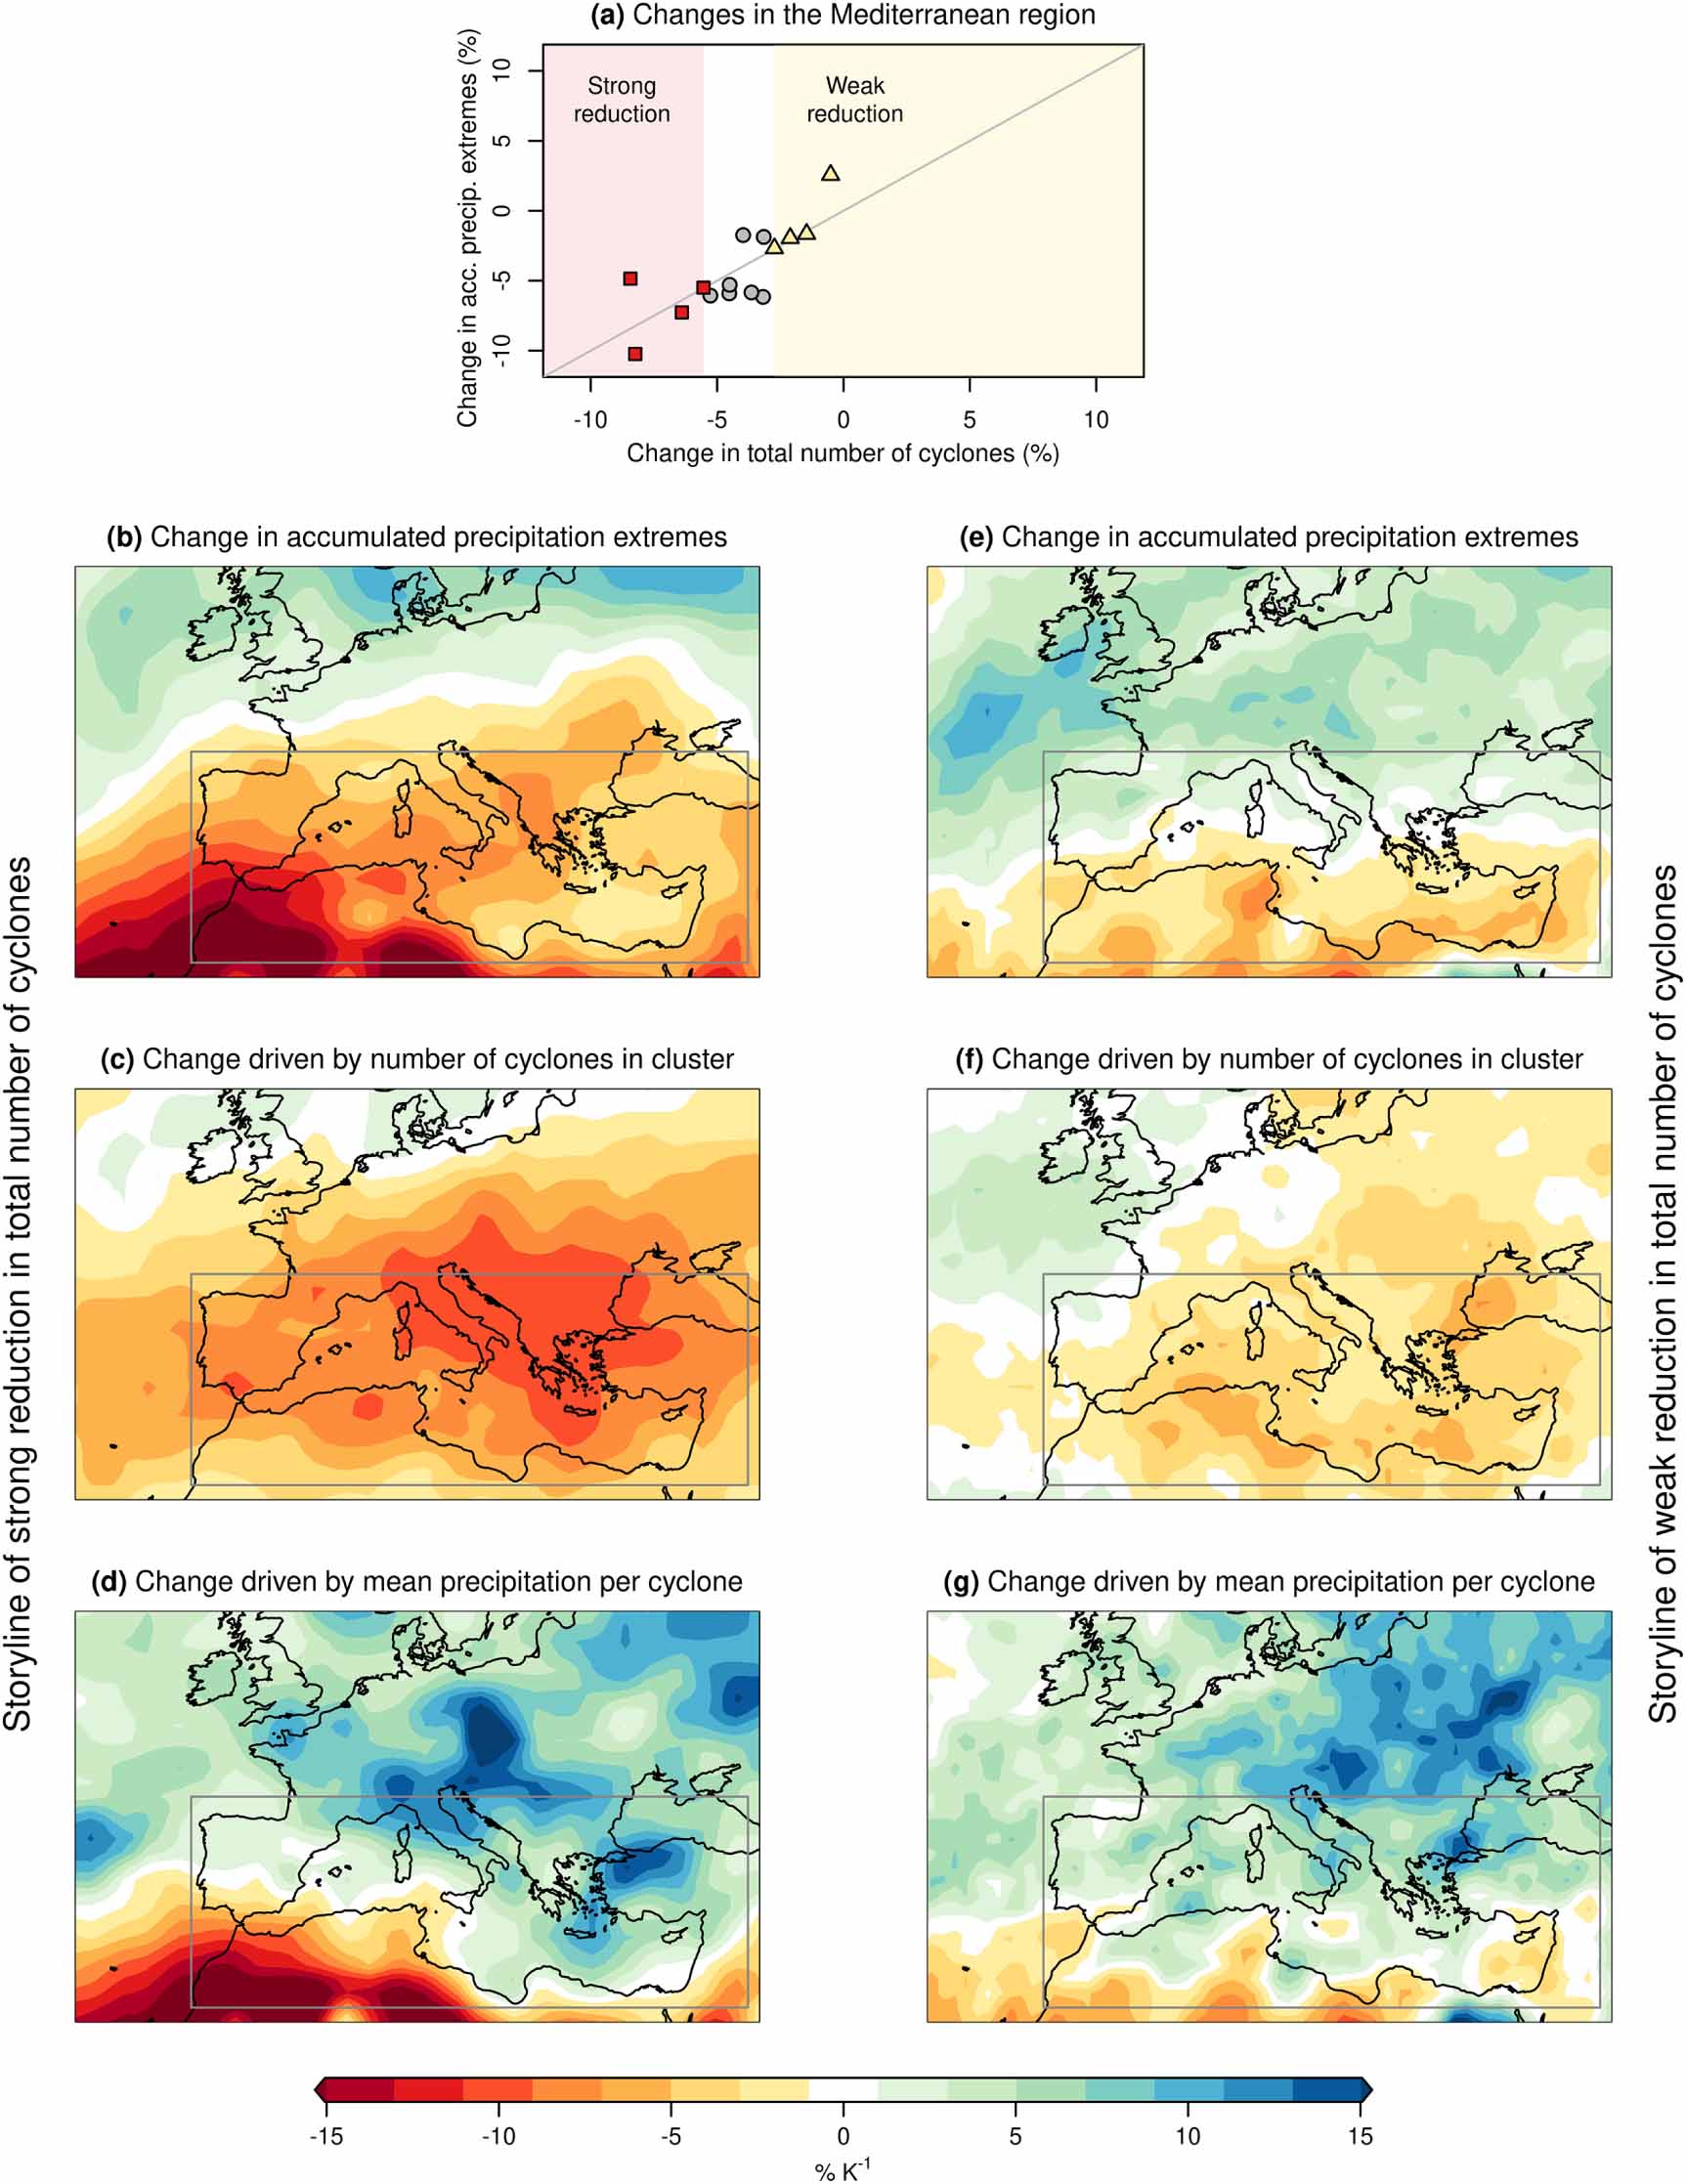
Such correlations can arise, e.g. from atmospheric circulation, which exerts a strong control on regional climate [46]; therefore, the regional uncertainties in the future dynamics of accumulated precipitation extremes can be physically understood through exploring different plausible storylines [18, 47] of atmospheric circulation change. This is shown for the Mediterranean, where the regional changes in the precipitation extremes from clustered cyclones depend on the magnitude of the changes in the storminess across the Mediterranean storm-track (figure 5(a)). In particular, a relatively strong weakening of the wintertime cyclone frequency would favour a pronounced reduction in the number of clustered cyclones, resulting in a widespread decrease of precipitation extremes in Southern Europe, by −7 %/K on average (figures 5(b) and (c)). Alternatively, an equally plausible weaker storminess reduction would result in a relatively small decrease in precipitation extremes (−0.9 %/K) (figure 5(e) and (f)). The two storylines highlight that an evolution of the regional precipitation extremes deviating from the multi model mean scenario is quite plausible [18, 47] as a result of well-known uncertainties in the future dynamics of the atmospheric circulation [48]. Notably, the two storylines differ in the position of the dry-wet boundary in precipitation extremes (figures 5(b) and (e)), which appears to be mainly controlled by underlying differences in the regional reduction of clustered cyclones (figures 5(c) and (f)), rather than in the mean precipitation changes (figure 5(d) and (g)). This is reflected in the model agreement on the sign of the accumulated precipitation changes, which, although widespread across Europe, is lacking around the dry-wet boundary (stippling in figure 3(a)) (a feature also observed in changes of typical IPCC precipitation metrics; figure 1(a)–(b)).

Figure 5. Storylines of plausible changes in precipitation extremes based on the response in the atmospheric circulation. (a) Intermodel dependence of the mean changes in annual maximum accumulated precipitation from cyclone clusters on the mean regional changes in the total number of wintertime cyclones in the Mediterranean region (shown in grey in panels b–g). Mean changes (%/K) in accumulated precipitation extremes, associated number of clustered cyclones and mean precipitation per cyclone according to two groups of models projecting the strongest (b)–(d) and weakest (e)–(g) reduction in the wintertime number of total cyclones in the Mediterranean (these two groups of models are shown with squares and triangles in panel a, respectively). Changes are between future (2081–2098) and past (1975–2004) climates.
Download figure:
Standard image High-resolution image4. Discussion and conclusion
Based on the statistical metric (φ) considering atmospheric variability only, previous studies [13, 17] had indicated uncertainty in the direction of the changes in cyclone clustering virtually everywhere in Europe (near-absence of stippling in figure 1(d)), preventing conclusive statements about future trends of precipitation extremes from cyclone clusters. Here, our impact-based metric considering the number of clustered cyclones and their associated precipitation ( ; equation (1)) reduces these uncertainties; our metric reveals a widespread reduction in the number of clustered cyclones, which, combined with robust projections of increases in the mean precipitation per cyclone, translates into a remarkable model agreement on the direction of the projected trends in precipitation extremes across most of Europe. This has broad implications as it informs hydrologists and risk modellers that considering only the change in mean precipitation per cyclone and neglecting the changes in the number of clustered cyclones would lead to overestimating the population affected by increased accumulated precipitation extremes from cyclone clustering by 130–490 million (intermodel range) across Europe (this is the population located where the accumulated precipitation extremes decrease despite an increase in the mean precipitation per cyclone; see appendix). The study reconciles the remaining uncertainties in changes of precipitation extremes with well-known uncertainties in the large scale circulation, such as the magnitude of the storm-track changes [3, 19, 29]. Such remaining uncertainties could be comprehensively considered in follow-up local impact assessments through exploring the range of impacts associated with different plausible storylines of the large-scale circulation [18, 47]. The introduced decomposition of accumulated precipitation extremes would allow for disentangling model biases in the different drivers of accumulated precipitation extremes, contributing to physically-based bias correction and model selection, which are an important step towards better local risk assessments [33, 49] and model development.
While the study indicates that a decrease in clustered cyclones is likely to reduce accumulated precipitation extremes in parts of Europe, the results should not be interpreted as a general projection of decreased hydro-climatic risk. The reduction of winter accumulated precipitation extremes may have adverse consequences as it can contribute to a reduction of winter precipitation totals that are, especially for the Mediterranean, a fundamental source of summer water availability [29]. In addition, the findings should be considered in combination with adverse effects of climate change such as the general intensification of short-lasting precipitation extremes in Europe [33], and changes in urbanisation that could increase flooding exposure [35, 50, 51]. Hence, the study supports the adoption of holistic risk management strategies that integrate different types of hydro-climatic hazards and uncertainties to ultimately distribute the available economic resources for climate change adaptation in the most beneficial directions.
Acknowledgments
We acknowledge financial support from the European Research Council grant ACRCC (project 339390) and from the DOCILE project (NERC grant: NE/P002099/1). EB acknowledges the European COST Action DAMOCLES (CA17109) and would like to thank Kevin Hodges for help with the use of TRACK, and Helen Dacre for a fruitful discussion. We acknowledge the World Climate Research Programmes Working Group on Coupled Modelling, which is responsible for CMIP, and we thank the climate modeling groups for producing and making available their model output. For CMIP, the U.S. Department of Energy's Program for Climate Model Diagnosis and Intercomparison provides coordinating support and led development of software infrastructure in partnership with the Global Organization for Earth System Science Portals.
Competing interests
The authors declare no competing interests.
Data availability statement
Data from CMIP5 models are available from the Earth System Grid Federation (ESGF) Peer-to-Peer system (https://esgf-node.llnl.gov/projects/cmip5). The ERA-Interim reanalysis dataset is available from the ECMWF Public Datasets web (https://www.ecmwf.int/en/forecasts/datasets/archive-datasets/reanalysis-datasets/era-interim). Population data is available at https://github.com/Nowosad/global_population_and_gdp.
Author contributions
EB conceived the study, carried out the data analysis, and drafted the manuscript. All the authors provided inputs for the design of the study, discussed the results, and contributed to writing the manuscript. GZ and EB ran the software TRACK to obtain the storm tracks.
:
Appendix A.1. Statistical metric of cyclone clustering φ
If cyclones were to occur randomly in time at a given location, the distribution of the occurrences in any time interval could be described via an homogeneous Poisson process [13, 15, 52] with constant intensity λ. This implies that the distribution of the number of cyclones occurring in any time interval of length T would be Poisson with mean (µ) and variance (σ2) equal to λ · T (hence, σ2/µ = 1). Deviations from such a Poisson distribution indicates that cyclone occurrences are either regular ( ) or clustered in time (
 ). Hence, different values of a dispersion statistic defined [15] as
  indicates that cyclone occurrences at a given location tend to be regular (
 ), random (φ = 0) or clustered in time (
 ). Following previous studies [13, 14] of cyclone clustering projections, we estimate φ based on the sample mean and variance of the wintertime (December–February) total number of cyclones transiting in a radius R of a given location. Here, we employ a radius R of 1112.6 km (10° latitude) for consistency with the analysis of the accumulated precipitation from cyclone clusters.
A.2. Radius of influence of the cyclones
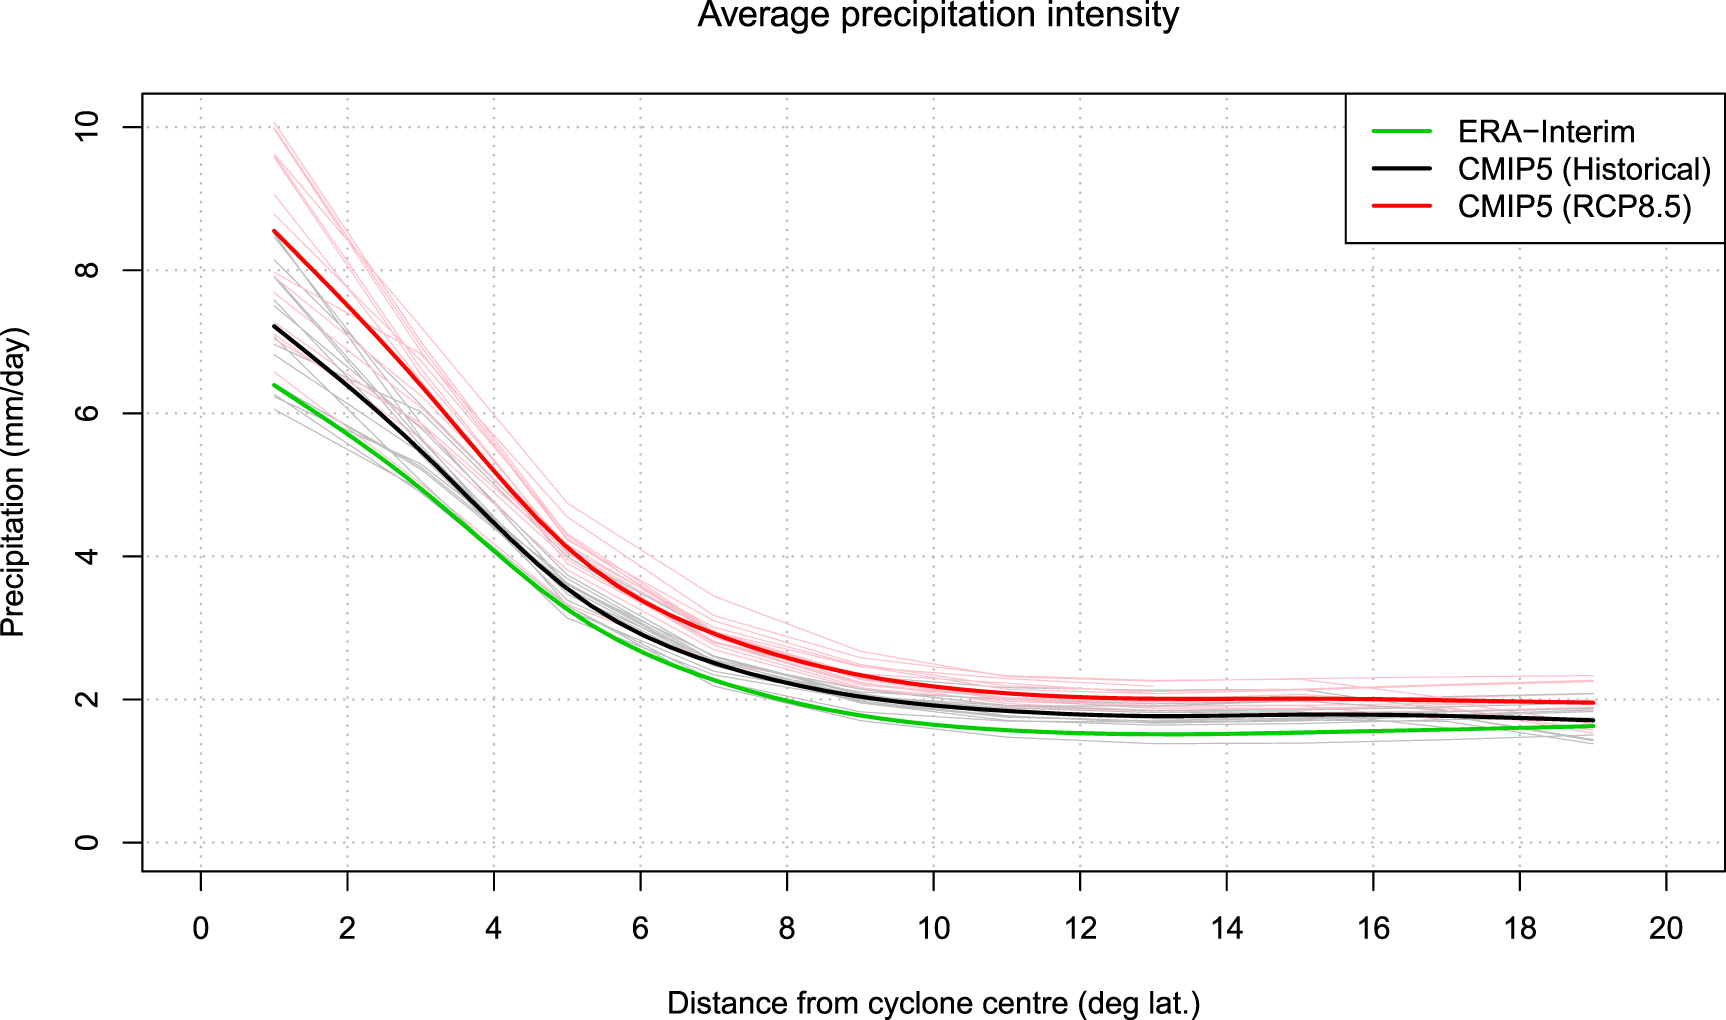
Following previous studies [1, 29], the radius of influence of the cyclones R = 10° latitude (corresponding to 1112.6 km) was selected as that defining the area where most of the precipitation around the cyclone center falls. We analyse P(r), i.e. the average 6-hourly precipitation at distance r ± 1° latitude from the cyclone center, for the cyclones tracking on a reference box over Europe (15°W–42°E, 30°N–67°N) (figure B7). Note that the profile P(r) is obtained as the mean of the profiles of the individual cyclones (only cyclones reaching their maximum T42 vorticity at 850 hPa within the reference box are considered). The profile P(r) of an individual cyclone is defined as the average of the profiles P(r) of the cyclone at the time steps when the cyclone is within the reference box. Following previous studies [1, 29], precipitation at a high radial distance from the centre such as  12.5° is understood as randomly sampled precipitation, i.e. not necessarily associated with the cyclones. We select a radius r = R of 10° latitude which captures most of the precipitation associated with the cyclones. Note that the results of the study, i.e. the changes in precipitation extremes from cyclone clusters and associated drivers, are insensitive to the chosen radius (figure B8 and B9 for a 7° and 13° radius, respectively).
A.3. Percentage changes per degree of warming
For each model, the projected response of the investigated quantities, e.g. mean annual maximum accumulated precipitation from the cyclone clusters  , is defined as the percentage change
  . The percentage change per degree of global warming
  is obtained via dividing
  by the winter (December–February) global warming signal in the considered model (i.e. the difference between the mean of the future and the mean of the past annual-mean near-surface temperature). Multimodel mean responses are computed as averages of the individual model responses.
A.4. Decomposition of the changes in the scaling
For a given model, the changes Δ of the scaling between future and past climate can be decomposed [10, 29] exactly as:
The percentage change  is obtained via dividing the change above by the scaling itself (
 ) and multiplying it by 100:
Finally, the percentage change per degree of warming ( ) is obtained via dividing the above by the projected global warming signal (see section above).
A.5. Population affected by reduced precipitation extremes due to reduced clustered cyclones
For individual models and considering the full geographical domain, the population that is affected by a decrease in the accumulated precipitation extremes from cyclone clustering due to a reduction in the number of clustered cyclone is quantified as that within grid points where the accumulated precipitation extremes decrease despite an increase in the mean precipitation per cyclone. This is computed based on precipitation changes regridded to the native grid of the population data (0.5 ).
).
: Appendix B

Figure B1. Mean annual maximum accumulated precipitation from cyclone clustering and associated scaling based on reanalysis data. The same as figure 2, but based on ERA-Interim reanalysis data and for the period 1979–2008.
Download figure:
Standard image High-resolution image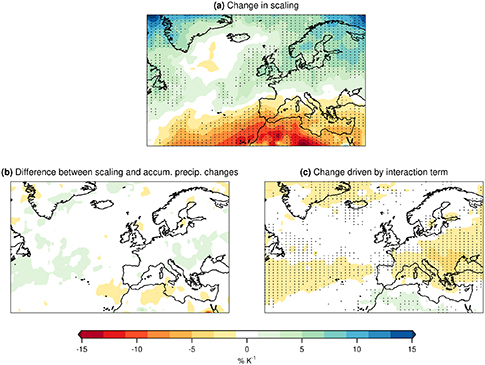
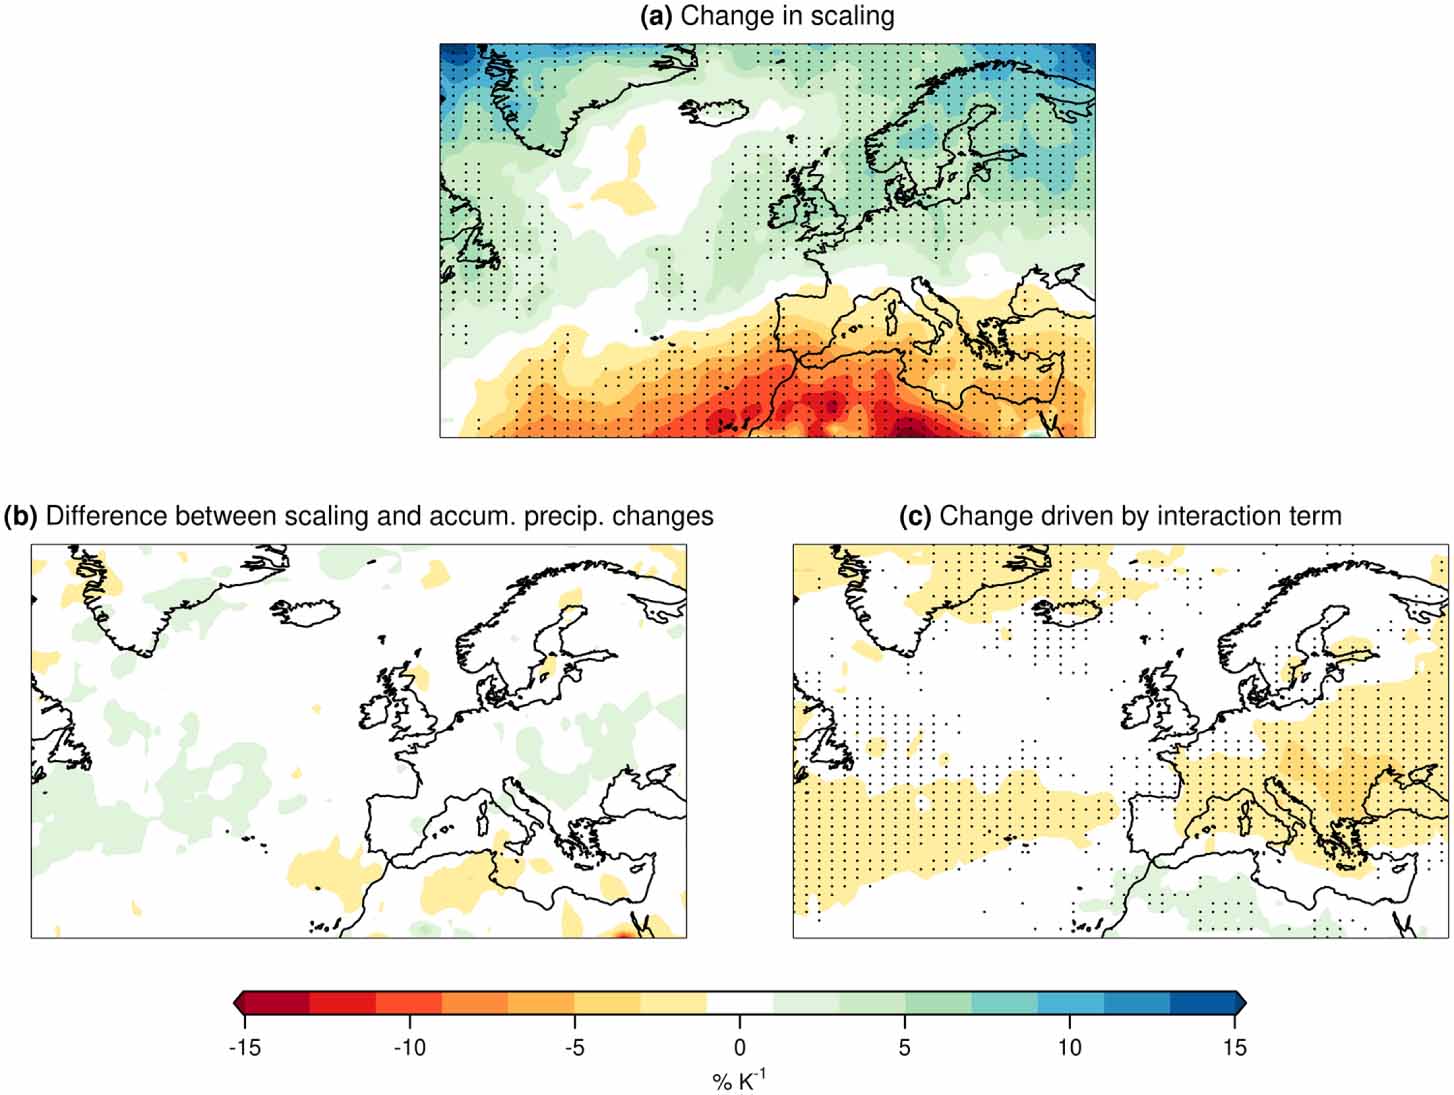
Figure B2. Characteristics of the future changes in the scaling. Multimodel mean percentage changes per degree of global warming (%/K) in (a) scaling associated with annual maximum accumulated precipitation from cyclone clusters, i.e.  (
( ). (b) Multimodel mean of the difference between projected changes in the scaling and in the actual mean annual maximum accumulated precipitation, i.e.
  (
( ) −
) −  . (c) Multimodel mean of (
 ) · (
) · ( ) · ΔT/100, i.e. the change in the second-order term of the scaling (%/K). In a and c, stippling indicates locations where at least 80% of the models agree on the sign of the changes. Changes are between future (2081–2098) and past (1975–2004) climates.
Download figure:
Standard image High-resolution image
Figure B3. Geographical sub-regions considered in the study. The three main regions considered in the study are shown via shading, i.e. the North Europe, Central Europe, and Mediterranean regions. These regions are employed by the IPCC, e.g. in the SREX report [11]. Here, we define the European region as the union of the three regions. Note that the most northern part of the North Europe region is not covered by the domain employed in the present analysis. Black rectangles show the sub-regions employed in table B1: Alps (AL), British Isles (BI), eastern Europe (EA), France (FR), mid-Europe (ME), Mediterranean sub-region (MD), Iberian Peninsula (IP), and Scandinavian Peninsula (SC). These sub-regions are used in EURO-CORDEX studies [53] and were described by Christensen and Christensen (2007) [54].
Download figure:
Standard image High-resolution image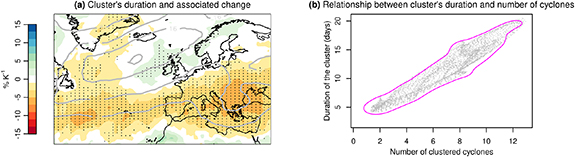
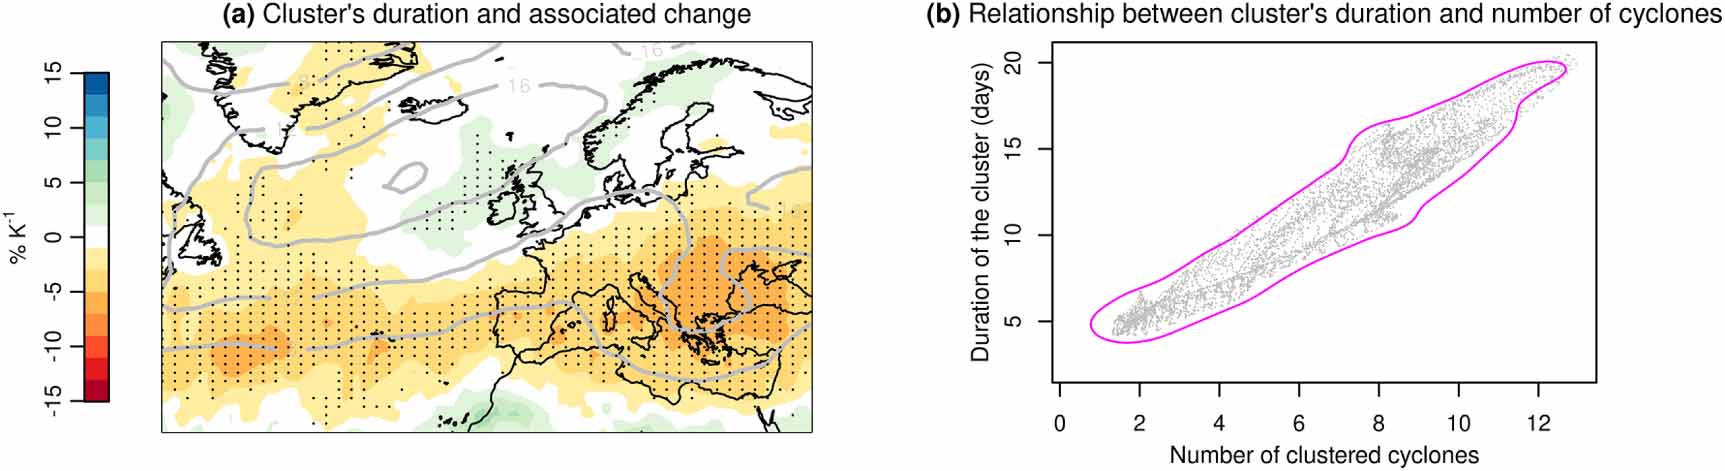
Figure B4. Duration of clustered cyclones and associated future changes. (a) Multimodel mean duration of cyclone clusters leading to annual maxima of accumulated precipitation during the past (1975–2004; grey contours) and associated percentage changes per degree of global warming (%/K) between future (2081–2098) and past periods (shading). Stippling indicates locations where at least 80% of the models agree on the sign of the changes. (b) Relationship between the multimodel mean average duration of the clusters leading to annual maxima accumulated precipitation (1975–2004; based on climatology shown with grey contours in panel (a)) and the associated number of clustered cyclones (based on figure 2(c)). Each location is represented by a dot in the scatterplot; the magenta contour is the isoline of the kernel density containing 90% of the pairs.
Download figure:
Standard image High-resolution image
Figure B5. Future changes in wintertime number of total and clustered cyclones. Multimodel mean percentage changes per degree of global warming (%/K) in (a) wintertime total number of cyclones. Stippling indicates locations where at least 80% of the models agree on the sign of the changes. (b) Intermodel relationship ( = 0.93) between regional mean change in wintertime number of total cyclones (x-axis) and clustered cyclones causing annual maxima of accumulated precipitation (y-axis) (the regional mean change is computed over the union of Southern and Central Europe, shown in grey in panels c and d). Mean changes (%/K) in number of clustered cyclones (leading to annual maxima of accumulated precipitation) based on the group of models projecting the strongest (c) and weakest (d) reduction in the wintertime number of total cyclones (these two groups of models are shown with squares and triangles in panel b, respectively). Changes are between future (2081–2098) and past (1975–2004) climates.
Download figure:
Standard image High-resolution image
Figure B6. Future changes in the intensity and translation speeds of the clustered cyclones. Multimodel mean percentage changes per degree of global warming (%/K) in mean (a) relative vorticity and (b) translation speeds of cyclones within the clusters leading to annual maxima of accumulated precipitation. Stippling indicates locations where at least 80% of the models agree on the sign of the changes. Changes are between future (2081–2098) and past (1975–2004) climates.
Download figure:
Standard image High-resolution image
Figure B7. Distribution of precipitation around the cyclone centre. Average distribution of the 6-hourly precipitation around the centre of the cyclones tracking over Europe (15°W–42°E, 30°N–67°N) for ERA-Interim (green) and CMIP5 models (past in black and future scenario RCP8.5 in red; thick lines show the multimodel mean). The distance from the cyclone centre is expressed in degree of latitude, where 1° latitude corresponds to 111.26 km.
Download figure:
Standard image High-resolution image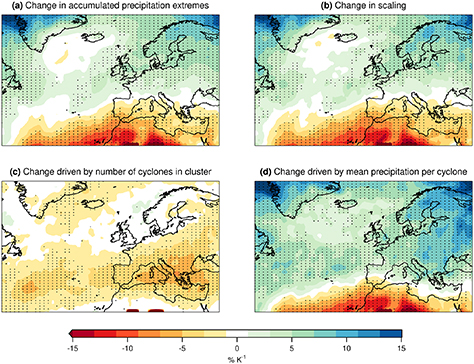
Figure B8. Future changes in mean annual maximum accumulated precipitation from cyclone clustering. The analysis is based on a radius of influence of the cyclones r = 7°. Multimodel mean percentage changes per degree of global warming (%/K) in (a) annual maximum accumulated precipitation and (b) associated scaling. Attribution of these changes to changes in (c) number of cyclones and (d) mean-precipitation per cyclone within the clusters leading to annual maxima of accumulated precipitation. Stippling indicates locations where at least 80% of the models agree on the sign of the changes. Changes are between future (2081–2098) and past (1975–2004) climates.
Download figure:
Standard image High-resolution image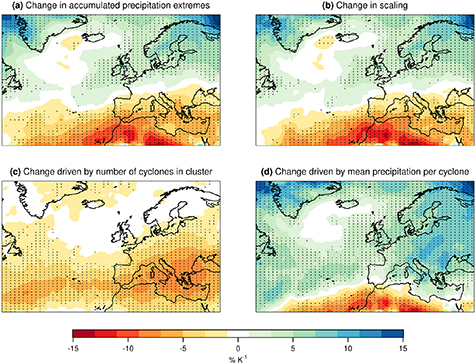
Figure B9. Future changes in mean annual maximum accumulated precipitation from cyclone clustering. The same as figure B8, but the analysis is based on a radius of influence of the cyclones r = 13°.
Download figure:
Standard image High-resolution image
Table B1. Aggregated statistics of accumulated precipitation and associated changes at the level of Eurocordex sub-regions. Historical mean accumulated precipitation annual maxima averaged at sub-regional level ( , based on the multimodel mean map in figure 2(a)) and associated future percentage change per degree of global warming (
 , based on figure 3(a)). The last two columns show the changes in the drivers, i.e.
  (based on figure 3(c)) and
  (based on figure 3(d)). Mean values of the statistics are obtained as regional average from the multimodel mean map (which is equivalent to the the mean of the regional averages of individual models). The uncertainty range is the standard deviation of the regional averages of individual models. The sub-regions are shown via black rectangles in figure B3.
| Country |  (mm) (mm) |  |  |  |
|---|---|---|---|---|
| British Isles (BI) | 72 ± 13 | 4.6 ± 1.9 | 0.3 ± 1.6 | 4.3 ± 1.5 |
| Iberian Peninsula (IP) | 41 ± 8 | −4.2 ± 3.8 | −5.4 ± 3 | 1.9 ± 3 |
| France (FR) | 58 ± 14 | 1.2 ± 3.3 | −3.1 ± 3.1 | 5.5 ± 2.2 |
| Mid-Europe (ME) | 46 ± 9 | 3.7 ± 2 | −1.5 ± 1.9 | 6.3 ± 2 |
| Scandinavia (SC) | 46 ± 6 | 6.3 ± 2.5 | −0.1 ± 2.3 | 6.7 ± 2.6 |
| Alps (AL) | 52 ± 9 | 0.5 ± 3.5 | −4.7 ± 3 | 7.3 ± 4.2 |
| Mediterranean sub-region (MD) | 45 ± 9 | −3.1 ± 3.3 | −6.2 ± 2.9 | 4.9 ± 3.8 |
| Eastern Europe (EA) | 40 ± 6 | 1.8 ± 3.1 | −4.6 ± 2.3 | 9.6 ± 3.5 |