

Abstract
Nearly one-sixth of U.S. river basins are unable to consistently meet societal water demands while also providing sufficient water for the environment. Water scarcity is expected to intensify and spread as populations increase, new water demands emerge, and climate changes. Improving water productivity by meeting realistic benchmarks for all water users could allow U.S. communities to expand economic activity and improve environmental flows. Here we utilize a spatially detailed database of water productivity to set realistic benchmarks for over 400 industries and products. We assess unrealized water savings achievable by each industry in each river basin within the conterminous U.S. by bringing all water users up to industry- and region-specific water productivity benchmarks. Some of the most water stressed areas throughout the U.S. West and South have the greatest potential for water savings, with around half of these water savings obtained by improving water productivity in the production of corn, cotton, and alfalfa. By incorporating benchmark-meeting water savings within a national hydrological model (WaSSI), we demonstrate that depletion of river flows across Western U.S. regions can be reduced on average by 6.2–23.2%, without reducing economic production. Lastly, we employ an environmentally extended input-output model to identify the U.S. industries and locations that can make the biggest impact by working with their suppliers to reduce water use 'upstream' in their supply chain. The agriculture and manufacturing sectors have the largest indirect water footprint due to their reliance on water-intensive inputs but these sectors also show the greatest capacity to reduce water consumption throughout their supply chains.
Export citation and abstract BibTeX RIS
1. Introduction
The U.S. Geological Survey quinquennial National Water Censuses have revealed a remarkable and counterintuitive trend in recent decades: from 1980–2015, total water withdrawals decreased 27% [1] even while the country's population grew by 42% and GDP expanded more than five-fold [2, 3]. These water-use reductions have been attributed to improvements in water productivity as well as structural shifts in the U.S. economy (i.e. declines in water-intensive agriculture and manufacturing and rise in service economies) [4, 5].
The multi-decadal decline in U.S. water withdrawals has not yet eliminated water scarcity risks, however. Numerous recent hydrologic assessments have revealed that in spite of lessened water withdrawals, the consumptive (lost) fraction of those withdrawals continues to deplete many natural water sources to near exhaustion, posing ongoing water shortage risks for both people and ecosystems [6–8]. Lacking access to additional freshwater supplies and facing rapid population growth and climate change, water managers in forty of fifty states expect water shortages in some portion of their jurisdiction by 2023 [9].
Recently, water productivity benchmarks have emerged as a promising tool for improving the sustainability of water use by identifying productivity levels that can be reasonably attained by water users operating within a variety of contexts and limitations. However, the studies to date have been limited to individual sectors, countries, or products. One global analysis estimated a 7.7 × 10¹⁰ m3 yr−1 water savings on irrigated croplands if the lowest water productivities were improved to the 20th percentile, amounting to more than one quarter of current water consumption on these lands [10]. Another global study of crop production estimated the possibility of a 39% reduction in total water consumption (blue + green) when improving the water productivity of all crops to a 25th percentile benchmark [11]. Using the same benchmark level, other work focused on crop production in Iran showed the potential for a 32% groundwater savings through water productivity improvements [12], and another study on winter wheat in China found the opportunity to reduce total water consumption by 53% [13]. To the best of our knowledge, no research has been done to assess non-agricultural sectors or to quantify the potential for improved water productivities to realize water savings in the United States. This study provides the first national multi-sectoral assessment of water productivity benchmarks and blue water savings for the U.S. Blue water relates to surface and groundwater resources, whereas green water is available soil moisture from precipitation (unless stated otherwise, water productivity in this study refers to blue water productivity). Importantly, we also demonstrate how improvements in water productivity can reduce streamflow depletion and make supply chains more sustainable.
Efforts to lessen water withdrawals can be very important for industries or services in which the cost of water as an input, or contamination of water through use, is of material concern. However, a focus on water withdrawals alone can be a misleading indicator of changes in freshwater depletion and associated risk of water shortages [14]. For example, between 1995 and 2015, water withdrawals for thermoelectric power generation—which today accounts for 41% of all withdrawals and is the largest water withdrawing sector in the U.S.—dropped by 31%, equivalent to a savings of 8.08 × 10¹⁰ m3 yr−1[15, 16]. However, the reduction in water withdrawals was largely due to technological shifts within the industry that reduced water withdrawals but increased water consumption by 27%. Thus, reductions in water withdrawals may provide very little alleviation of water scarcity in the source watersheds. For this reason, our measures of water productivity are based upon consumptive water use rather than water withdrawal. In this study we explore the potential for continued improvements in water productivity to further reduce water scarcity risks and improve economic productivity. We examine water productivity through multiple lenses, including both product output and dollars earned per unit of water consumed.
Our assessment of opportunities for improving water productivity is based upon a 'benchmarking' approach in which we first characterize the spectrum (probability distributions) of water productivity values associated with production of individual commodities or provision of services (figure 1). These probability distributions are derived from a new water footprint database [17] that provides industry-level detail (over 400 industries, products, and crops) and spatially explicit direct water consumption estimates per unit of production for the U.S. We then establish target benchmarks for each sector based on water-use productivity levels achieved by the better-than-average performers in each sector. Importantly, we cluster similar water users based on shared environmental and/or technological profiles (henceforth, referred to as water-use clusters) so as to constrain target benchmarks to realistically achievable water productivity levels within each sector (e.g. it is not possible to achieve the same water productivity when growing wheat in Arizona as in Ohio due to climatic differences). Finally, we examine the potential to reduce water consumption and water scarcity by bringing water users within each water-use sector—or all water users collectively—up to realistic benchmarks set by water users with the highest blue water productivity. Moreover, our analysis enables industries to identify whether greater water savings can be achieved by improving water productivity in their own processes or working to improve their suppliers' water productivity upstream in the supply chain. This analysis has enabled us to identify the water-use sectors and watersheds across the U.S. that may offer the greatest water savings and relief from water scarcity if water productivity gains can be realized.

Figure 1. Probability distribution for water productivity and associated benchmarks. The benchmarking approach applied in this study is based upon the development of probability distributions for each water-use sector, product, or service, within each water-use cluster. The x-axis represents water productivity, measured as production or dollars earned per unit of water consumption, with water productivity improving from left to right. The y-axis represents the number of water users, such as number of factories, power plants, farms or any water user. These benchmarking relationships are built using a new water footprint database that includes >400 U.S. industries and products [17]. Labeled on the graph are three 'target benchmark' levels used in this study: BM50 = 50th percentile or median performance; BM25 = 25th percentile or high performance; and BM10 = 10th percentile or outstanding performance. Distribution plots were made using the ggplot2 Wickhan and ggridges packages [18].
Download figure:
Standard image High-resolution imageOne of the attractions of using a benchmarking approach is that it is not prescriptive with respect to the practices or technologies used for reducing water consumption. Instead, it enables individuals and companies to select from a portfolio of strategies, tailored to the constraints and opportunities they face in their businesses and geographic/climatic context. We simply evaluate how much water savings or how much improvement in water productivity (production or dollars earned per unit of water consumed) can be attained by improving all users' water productivity to meet a target benchmark, such as up to the 50th percentile (median productivity; BM50), 25th percentile (high productivity; BM25), or 10th percentile (outstanding productivity; BM10). These benchmarks represent actual water productivities achieved by a water user's regional industry peers and are therefore realistically achievable in most cases. This study provides an upper bound of potential water savings, recognizing that financial and regulatory barriers may inhibit some water users from attaining water productivities achieved by their peers.
2. Methods
This study asks 'if water productivity is improved across the U.S. economy, how much water can be saved and in which industries and locations?' Water productivity is defined as production obtained per unit of water consumption (i.e. uses which, through evaporation and transpiration, remove surface and groundwater from further use within a watershed). We utilize an unprecedented dataset [17] that quantifies consumptive blue and green water use and productivity for over 400 crops, livestock animals, thermoelectric power generation types, and commercial/industrial/institutional uses at fine spatial resolutions. Controlling for climatic conditions that may differ between geographies and constrain achievable water productivity levels, we set water productivity benchmarks for each sector in order to determine the potential to reduce water demand across the U.S. economy by improving water productivities to the benchmark level. We adopt the perspective that systems operating within the same contexts and constraints (i.e. similar industry, climate, and geographical area) have similar opportunities to improve their water productivity. We do not prescribe a particular technology or conservation practice for users to improve their water productivity because the best approach will vary depending on the limitations and opportunities faced by each individual water user. Instead, we sort water users by use type and climate region to identify what levels of water productivity have been achieved by similar water users and are reasonably attainable. After estimating the volumes of water potentially saved through benchmarking, we employ an environmentally extended input-output model to assess how water savings of production may ultimately transfer through domestic supply chains. Finally, these potential water savings are also incorporated into a national hydrological model to examine opportunities for reducing streamflow depletion across the United States.
2.1. Water productivity and benchmarking for crop production
We calculated water productivities (tonne per m3 of blue and green water) for 23 crops that comprise 89% of irrigated harvested area, and 87% of blue water demand [17] for U.S. crop production (Supplementary table 3 (stacks.iop.org/ERL/15/094033/mmedia)). County-level irrigated yields (tonne ha−1) for available years between 2007–2017 were taken from the USDA [19] and temporally averaged to account for potential anomalies that would skew local water productivities. Gridded blue and green crop water requirements (mm yr−1) were calculated following the approach by Doll and Siebert [20] for the same years. The temporally averaged water productivity of a crop was calculated as the ratio of irrigated crop yield to sum of blue and green crop water requirement. Though our focus is on potential blue water conservation, we also consider green water since it contributes to crop productivity and can offset potential blue water requirements.
Using crop-specific maps of crop cover from the USDA National Agricultural Statistics Service Cropland Data Layer [21] and data on daily precipitation and temperature [22], we developed climate bins (see Supplementary figure 1) based on aridity index and growing degree days (see Supplementary table 4) to control for climatic influences on crop water productivity. Within each climate bin, we determined the crop water productivity representing the 25th percentile (i.e. 25% of grid cells consume less water per unit of production). If a grid cell's total water productivity value was worse than the benchmark value, the grid cell value was adjusted to match the percentile benchmark and used to calculate the new total water demand. The difference between current total water demand and the BM water demand represents potential water savings within each grid cell. Since green water contributions are held constant, all water savings are from reduced irrigation (blue water). Blue water demand for BM25, whose lower limit is zero, is calculated as the difference between baseline blue water demand and total savings (additional details can be found in the Supplementary Materials).
2.2. Water productivity and benchmarking for other sectors
County-level water productivity values (head per m3 blue water) for nine livestock products came from Marston et al [17] (Supplementary table 1) and were benchmarked based on NOAA climatic region and livestock type. County-level water productivity values for thermoelectric power water consumption came from Marston et al [17] and were benchmarked based on fuel type, technology, and climatic region. Annual county-level public and self-supplied water consumption data came from Richter et al [8], and were used to calculate per capita water productivities and benchmarked by NOAA climatic region. County-level water productivity values for the commercial, industrial, and institutional sectors also came from Marston et al [17] and were benchmarked by climatic region and 2–6 digit North American Industrial Classification System (NAICS) code (see Supplementary table 2 for full listing of NAICS codes).
2.3. Water savings through the supply chain
We employed an environmentally extended input-output (EEIO) model to assess how water savings in the production process propagated through complex supply chains. EEIO analysis is a widely used technique to connect the environmental impacts of production to economic consumption through each stage of the supply chain [23]. Our model replicates the model used by Marston et al [17]; though in this study, we perform separate analyses using different environmental multipliers to represent current (baseline) and benchmark levels (BM10, BM25, BM50) of water productivity for each industry. Direct and indirect water savings were calculated by taking the difference between the baseline scenario and each benchmark scenario for each industry. The EEIO model is further described in the Supplementary Materials.
2.4. National hydrology model and streamflow depletion
Streamflow and flow depletion at the HUC8 watershed scale were estimated using the Water Supply Stress Index (WaSSI) Ecosystem Services Model. WaSSI was developed by the USDA Forest Service to assess the effects of climate, land use, and population change on terrestrial water and carbon balances, water supply stress, river flows, and aquatic ecosystems across the conterminous U.S. WaSSI has been extensively tested using observed streamflow measurements [24, 25] and has good predictive performance relative to other continental and basin scale models. Details on the model computations can be found in Sun et al and Caldwell et al [26, 27], and modifications to WaSSI used in this study are described in Richter et al [8]. We utilized groundwater and surface water use data from Maupin et al [28] and Marston et al [17] to partition blue water demands between groundwater and surface water sources before integrating these consumptive water uses within WaSSI. We evaluate water savings as they accumulate within the stream network and the associated changes in streamflow depletion (i.e. difference in predicted streamflow while accounting for water use vs. predicted streamflow with no water use) by comparing benchmark scenarios against our baseline scenario. Additional methodological details are found in the Supplementary Materials.
3. Results
3.1. Improving water use performance by sector
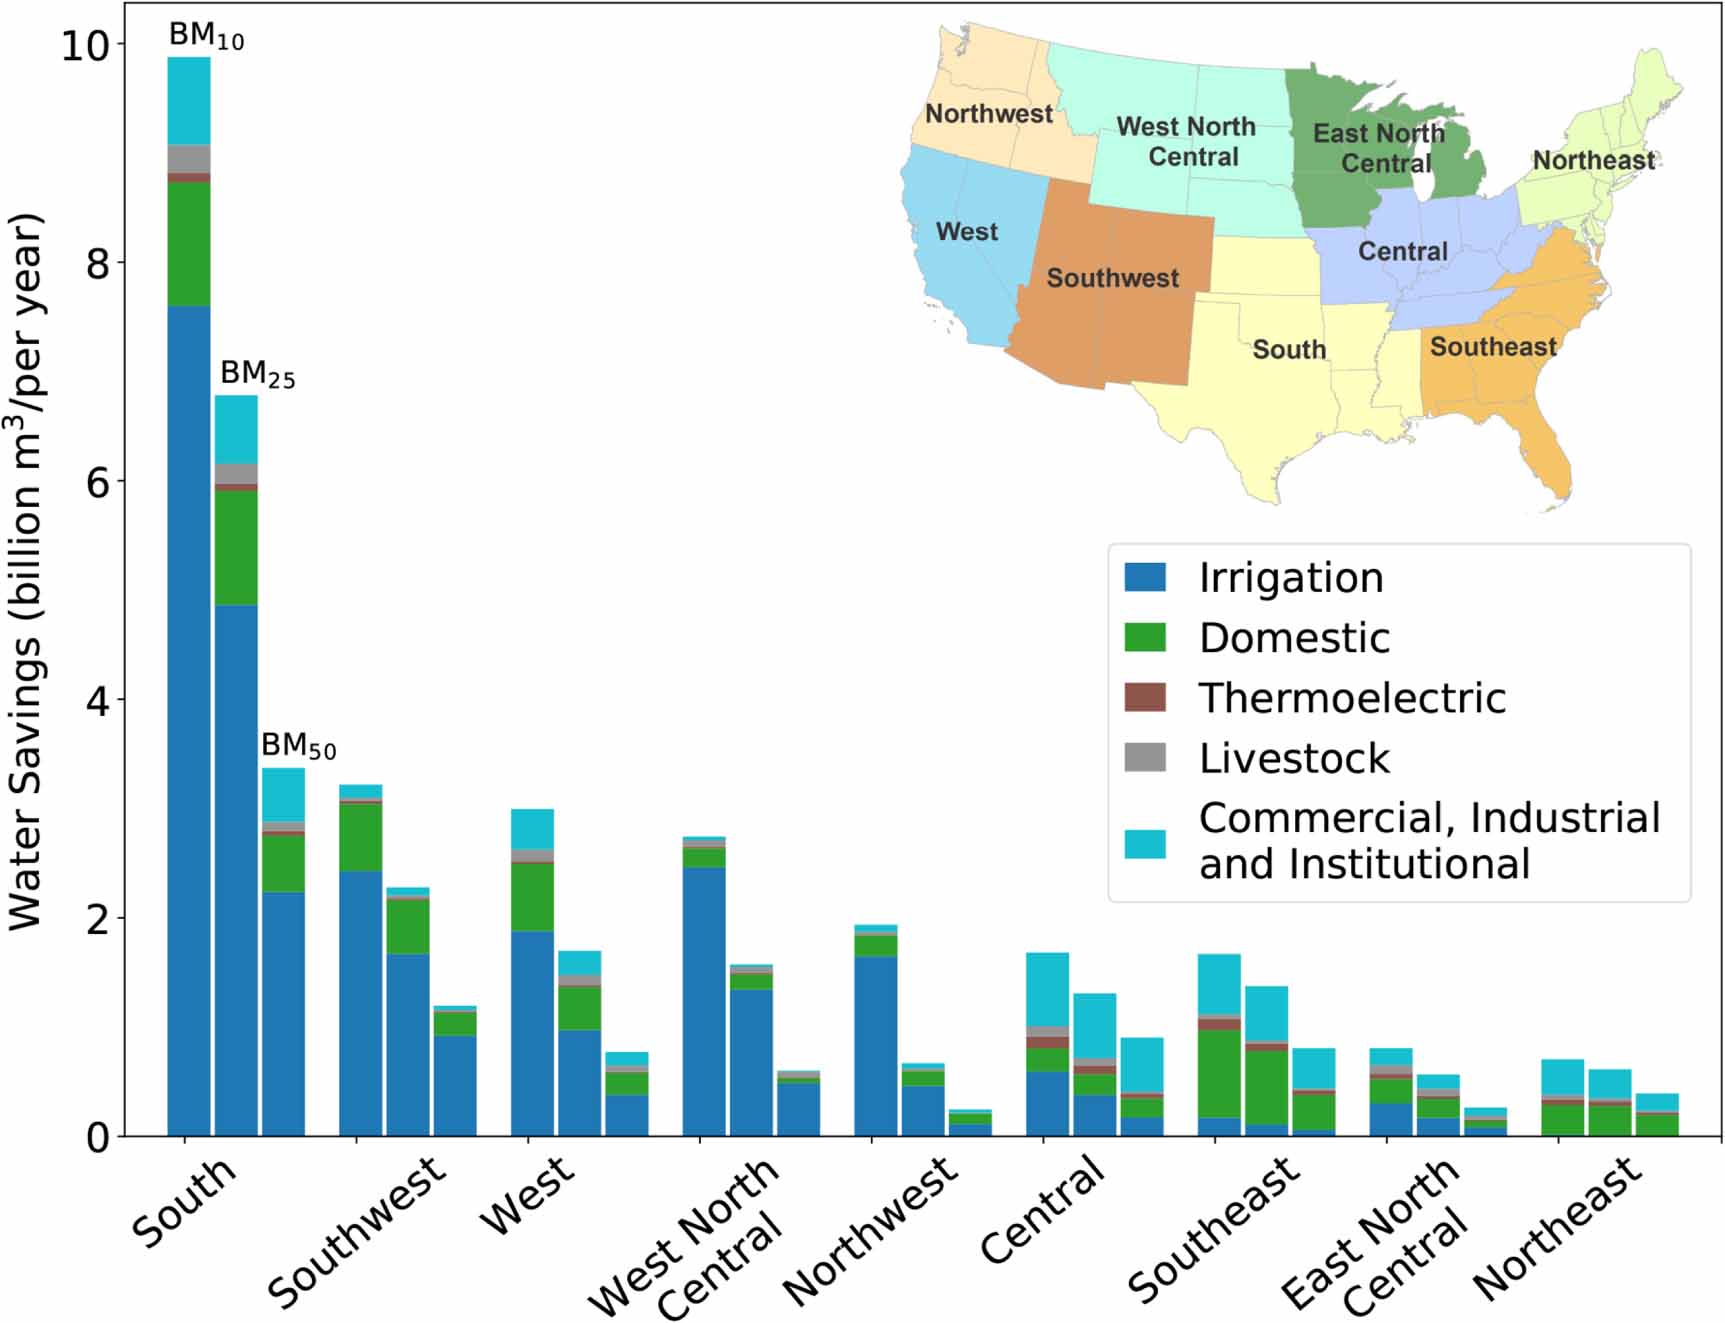
Irrigated agriculture is by far the largest consumptive water user in the conterminous U.S., representing 75% of all water consumption [8]. Unsurprisingly, the greatest volumetric water savings can be attained from improving water productivity in agriculture (figure 2). We note that our assessment of the potential water savings in agriculture is based upon benchmark evaluations of individual crops and other agricultural products within their individually determined water-use cluster; our results for agriculture within each climatic region (figure 2) are therefore based upon an aggregation of all individual crop assessments at much finer spatial resolutions. A list of all industries/products included in this study and the broader sectors they belong to are found in Supplementary table 1 and Supplementary table 2. The total water savings potential in agriculture for the conterminous U.S. at BM25 amounts to 9.98 × 10⁹ m3 yr−1—equivalent to 11.3% of all agricultural water consumption—which is about half of the total consumptive use in all other water sectors combined. Among the U.S. regions evaluated, the largest volumes can be saved in the South, with large volumetric water savings also achievable in the four Western U.S. regions. Significant water savings in the South and Western regions reflect the large baseline consumptive water use in these areas, not because these regions have greater water productivity variance than other regions. Direct blue water consumption and savings for the baseline and benchmark scenarios for each sector and climate region can also be found in Supplementary table 6.

Figure 2. Potential direct water savings at the BM10, BM25, and BM50 levels, aggregated by climate region and sector. The greatest volumetric water savings can be realized by improving the performance of irrigated agriculture, followed by domestic water uses. The potential savings in irrigated agriculture are greatest in the South and in Western regions where agriculture relies most heavily on irrigation.
Download figure:
Standard image High-resolution imageWithin the agricultural sector, the greatest potential for water savings is tied to specific crops requiring the most irrigation within each region (figure 3). Over half of the total potential crop water savings across the U.S. at BM25 are from just three crops: corn, cotton, and alfalfa. Both alfalfa and corn (∼40% of total production) are used for animal feed; two-fifths of corn production is also used for biofuel production, with the remaining one-fifth used for other purposes, including international export. Though these three crops represent the largest potential water savings nationally, the irrigated crops with the greatest water-saving potential vary regionally: in the South, soybeans, cotton, and winter wheat hold the greatest potential, while in Western regions water savings are greatest for alfalfa.

Figure 3. Potential direct agricultural water savings by crop at the BM10, BM25, and BM50 levels, aggregated by climate region. Within the agricultural water use sector, the greatest potential for water savings is tied to the crops requiring the most irrigation within each region.
Download figure:
Standard image High-resolution imageWhen looking for potential water savings, distinguishing between 'direct' (i.e. water consumed in a user's own production processes) and 'indirect' (i.e. water consumed upstream in the supply chain) uses of water is also important (figure 4). This way, water-saving strategies can be implemented more strategically by prioritizing the step of the supply chain consuming the most water or perhaps where the use of water is least productive economically. Nearly 95% of industries have a larger indirect water footprint than direct water footprint, indicating that the greatest potential for water savings likely occurs upstream in the supply chain of a direct water user. For example, meat production—as part of the agriculture sector—relies on feed crops; the textile industry relies on fiber crops such as cotton; and manufacturing of appliances, consumer electronics, or vehicles relies on minerals. The water consumption associated with each of these inputs must be included when evaluating overall water consumption for a product or industry. Consistent with this, the construction sector, which requires considerable inputs in production, has a much higher indirect consumptive use of water (5.17 × 10⁹ m3 yr−1) when compared to its direct use (5.77 × 10⁷ m3 yr−1), and agriculture and manufacturing both have very high direct (9.34 × 10¹⁰ m3 yr−1 and 2.75 × 10⁹ m3 yr−1, respectively) and indirect (6.89 × 10⁹ m3 yr−1 and 4.11 × 10¹⁰ m3 yr−1, respectively) water consumption (figure 4). In agriculture, water is consumed directly in growing crops, and use of irrigated crops as animal feed creates a very high indirect water use in meat production. By shifting all water users within the agriculture sector to the BM25 level, direct water consumption decreases by 11.13%, while indirect water consumption decreases by 14.07%.

Figure 4. Direct and indirect water consumption (a) and savings (b) at the BM25 level, aggregated by sector. The total direct and indirect water requirements throughout a product's supply chain were calculated using an environmentally extended version of the Leontief Input-Output model [31]. The agricultural sector has the greatest direct and indirect water footprint but can also achieve greater water savings than all other sectors combined. The manufacturing sector has the greatest indirect water savings due to its reliance on water-intensive commodities as inputs to production.
Download figure:
Standard image High-resolution imageThe shapes of water productivity distributions, as well comparisons between products/industries, can differ widely when water productivity is viewed through the lens of production (e.g. kg per m3 of water consumed) versus economic outputs (USD) per unit of water consumed. Across meat categories, poultry production (turkeys, laying hens, and broilers) generates the highest meat production and economic output per unit of direct blue water consumed (i.e. not considering indirect water consumption upstream in livestock's supply chain). Dairy cows are the least productive in terms of kilograms per unit of blue water (figure 5(a)), and beef cows are among the lowest economic producers as well (figure 5(b)). Most industries have a Gaussian or lognormal distribution of water productivity, suggesting a central tendency of water productivity. Bimodal distributions seen in figure 5(c) are an artefact of aggregating over 350 unique commercial/industrial/institutional water users to broader sectors. Though we aggregate these similar industries together for visualization purposes here, a unique benchmark was set for each industry.

Figure 5. Direct blue water productivity benchmarking results expressed in terms of either production or revenue produced per unit of blue water consumed directly within their production processes. (a) Water productivity of animal production measured as weight produced (kg). (b) Water productivity of livestock production measured in terms of revenue generation. Poultry (turkeys, broilers, laying hens) generate greatest median value per unit of water. (c) Water productivity of multiple industries grouped together by sector and measured in terms of revenue generation (USD). (d) Water productivity of thermoelectric power generation measured in terms of gigajoules produced. Recirculating (R) coal and nuclear power plants are the most water intensive. For the same fuel type, once-through cooling (O) is typically more water productive, although water withdrawals are much larger for once-through cooling than recirculating cooling. Recirculating natural gas plants are the least water intensive. (Note: renewable energy sources such as solar and wind are not included due to lack of spatially explicit data).
Download figure:
Standard image High-resolution imageOverall, the utilities sector produces both the most economically productive water use and the least economically productive water use (figure 5(c)). Within the utilities sector, the transport of energy fuels like natural gas use very little water for each dollar of output, which is represented by the distribution with the higher water productivity values. Electricity generation, however, consumes significant amounts of water relative to the industry's economic production (distribution with smaller water productivity values). We highlight specific fuel types and cooling systems used to generate thermoelectric power since thermoelectric power is a key water consumer within the U.S. economy (figure 5(d)). Natural gas is often able to produce more energy while consuming less water than other fuel types, while once-through cooling systems generally consume less water per joule of energy than recirculating cooling systems. As the energy mix continues to shift toward natural gas and renewable sources, there will be continued improvements in water productivity (joules m−3 blue water) within this sector [29] (figure 5(d)). Spatially explicit water productivity data on renewable energy generation are unavailable, though these energy sources generally consume very little water in their operation (hydropower and concentrating solar power technologies are exceptions) [30]. Furthermore, water consumption associated with water and sewage utilities is not represented in our study due to data limitations. Average blue water productivities per climate region and sector can be found in Supplementary table 5.
3.2. Reductions of water scarcity through improvements in water productivity
Ultimately, the ability of improved water productivity within and among industries to reduce water scarcity must be evaluated in the context of local water budgets [32]. Here, we define water scarcity as summer streamflow depletion relative to the mean natural summer flow (i.e. no anthropogenic water uses), with 100% depletion meaning all naturally available supplies have been consumed. We used the WaSSI Ecosystem Services Model to estimate reductions in water scarcity achieved through attainment of each water productivity benchmark (i.e. BM10, BM25, and BM50). WaSSI operates on a monthly time step at the 8-digit Hydrologic Unit Code (HUC8) sub-watershed scale. There are 2,099 HUC8 sub-watersheds in the conterminous U.S., with a mean area of 3,750 square kilometers. The WaSSI model enables evaluation of the change in streamflow depletion associated with lessened water consumption for specific water uses such as irrigation of alfalfa or evaluating improved water use performance across all sectors in a sub-watershed.
Importantly, water scarcity reductions achievable by attaining water productivity benchmarks are greatest in Western U.S. regions (as identified in figures 2 and 3) where baseline water scarcity is most pronounced (figure 6, showing BM25 results versus the baseline). Geographically-averaged scarcity across these Western regions can be reduced by 23.2%, 13.6%, and 6.2% at the BM10, BM25, and BM50 levels, respectively, while maintaining similar levels of economic production. Greater levels of water scarcity reductions are attainable and could be very important in highly water-stressed basins such as the Snake River Basin (figure 7). Overconsumption of available river flows in the Snake River Basin has led to recurring water shortages for both irrigation farmers and hydro-electric power producers, while severely depleted river flows and the associated warming of water temperatures continue to depress populations of imperiled salmon in the lower Snake River Basin [33, 34]. In the over-appropriated Colorado River Basin, average summer water savings at the BM25 level equate to 1.59 × 10⁸ m3 yr−1 at the U.S.-Mexico border, which amounts to an 8.3% increase in streamflow.

Figure 6. Potential change in depletion of mean river flows in summertime (July-September) during 2001–2015, based on attaining BM25 in all water-use sectors. The period 2001–2015 was selected because it has been identified as an extraordinary drought period for the Western U.S.
Download figure:
Standard image High-resolution image
Figure 7. Potential reductions in river depletion along the length of the Snake River in Wyoming, Idaho and Washington. In the upper basin, increased river flows would bolster reservoir storage important to farmers and hydroelectric power producers; in the lower river, increased river flows would benefit imperiled salmon populations.
Download figure:
Standard image High-resolution image
4. Discussion
Improving water productivity through improved business practices, supply chain sourcing, policies, and water-efficient technologies is an important step towards putting water to more economically and environmentally beneficial uses. Roughly one-sixth of river basins in the United States are unable to consistently meet societal water demands while also providing sufficient water for the environment [8]. In river basins where human uses of water are satisfied but environmental flows are inadequate, leaving unused (saved) water in situ will help bolster environmental flows. However, in the instances in which neither human nor environmental needs are being fully met, any water savings from productivity improvements will most likely be consumed by users needing more water or wanting to expand production [35], unless legal or administrative rules dictate that the water savings be returned to the environment (e.g. Schwarz and Megdal [36]). For example, multiple studies [37–39] have found public subsidies of water efficient irrigation technologies lead farmers to expand their irrigated acreage and grow more intensive crops with their water 'savings', leading to greater production but no improvement in water conservation or environmental water scarcity. While we contend that water users are best suited to determine their own optimal strategy for improving water productivity, government programs and market forces can incentivize water users to optimize their individual practices.
Water conservation levels demonstrated at the scale of this study will require a combination of institution-level regulatory and market-based measures, along with changes in producer-level operations. Limiting new water right permits and shifting from diversionary water rights to consumptive water rights, such that return flows are considered, will help cap water use within a basin. Water use caps have been widely promoted as a means to curtail further consumptive water use within a basin [35, 40]. A water market system based on formal water rights—such as the prior appropriation system that governs water use in the Western states—can be helpful in facilitating the transfer of water between users with surplus water savings and those needing more water, including the environment [41]. One advantage of such transfers is that they tend to reallocate the saved water to other users that are more economically productive [42]. They are also attractive because they financially reward users that are able to save water by allowing them to sell their water savings to other users or environmental interests, thereby creating a strong incentive for improving water productivity. Lastly, a paradigm shift is needed in irrigation management towards a focus on maximization of net benefits (which gives consideration to the opportunity costs of water), not the biological objective of yield maximization [43]. When the chief objective is to maximize yields and water is undervalued, wasted water is an expected outcome.
In the water-intensive agricultural sector, improved irrigation scheduling, switching from furrow irrigation to subsurface drip irrigation, and adopting no-till and mulching strategies that increase soil moisture retention are commonly employed approaches to reduce water consumption [44, 45]. For example, a group of irrigators in western Kansas have reduced their average water use by 31% employing some of these strategies, while maintaining similar levels of profitability [46, 47]. In the industrial sector, replacing 'wet' evaporative cooling systems with 'dry' air-cooled systems, water reuse, switching to alternative water supplies such as captured stormwater, desalinated water, or treated wastewater, regular inspection of the water system for leaks or inefficiencies, and employee education programs are common ways to reduce freshwater consumption.
Ironically, some of the areas we show as having the greatest environmental water scarcity, as well as the greatest potential for water savings, have some of the lowest municipal water prices in the U.S. and have pricing structures that charge less per unit of water with increasing water use [48]. However, many cities are not able to effectively price water so as to reduce water consumption due to state and local regulations that restrict water revenues from exceeding the cost of supplying water [48]. Cities such as Las Vegas and San Antonio support alternative approaches to reduce water demand, such as implementing water use restrictions, offering financial rebates for reduced landscape irrigation, use of analytics to identify leaks early, educational programs, and installation of low-flow appliances. Some groundwater management districts across the country have encouraged improved water productivity by taxing groundwater pumping [49] or capping groundwater withdrawals [46] to reverse aquifer overexploitation and depletion of connected streams. At the household level, federal programs such as EPA WaterSense (https://www.epa.gov/watersense) help promote sales of more water-efficient appliances and educate consumers on their water footprint.
As these select examples demonstrate, there are already myriad approaches to conserve water and increase water productivity, and their implementation at scale can achieve the potential water savings found in this study. As we demonstrate, most industries have more potential water savings in their indirect supply chains than in their direct operations, so one of the most attractive options to reduce water consumption is for industries to employ 'offset' or efficiency clauses in contracts to require water-intensive suppliers to save water. Transnational companies like PepsiCo, Coca-Cola, Gap Inc. and Kellogg's have taken initial steps to promote water conservation in their own operations and also through their supply chains. Moreover, cities can achieve 'water-neutral growth' by requiring new developments offset their water consumption by retrofitting existing developments with water-efficient technology [50].
We reiterate that our study represents an upper bound on potential water savings should best practices in water conservation proliferate through each sector of the economy. Though not all producers will be able to reduce water consumption while maintaining current levels of production, numerous studies demonstrate significant (up to 76%) water savings with little to no reductions in production (e.g. Richter et al [44] reviews over 30 studies that maintained crop yields while implementing a variety of approaches to conserve water). Importantly, the spatial detail of our analysis can help target water conservation measures at places where they are most needed and may be possible with little to no reduction in economic activity.
5. Conclusion
Growing concerns over water shortage risks in many parts of the U.S. have stimulated interest in finding ways to lower water consumption; yet, there is a parallel objective of increasing economic activity that seems at odds with water conservation goals. Our water productivity benchmarking approach reveals a path to reduce water consumption in a manner that enhances economic productivity and is also demonstrably feasible within the unique constraints faced by each industry in each region. We find that total annual potential water savings in the U.S. economy (1.69 × 10¹⁰ m3; BM25 scenario) are similar to the combined consumptive water use of domestic, commercial, industrial, institutional, and thermoelectric power water users (1.92 × 10¹⁰ m3). Many of the most water stressed river basins within the U.S. also show the greatest potential for water savings through water productivity improvements. A focus on improving water productivity and reducing environmental flow impacts of water consumption facilitates a shift from a politically untenable paradigm of restricting water rights to a more workable solution centered on getting more environmental and economic benefit out of each cubic meter of water.
Potential water savings and reductions in streamflow depletion found in this study are likely conservative due to data limitations. We use observations of individual water users when available (e.g. individual thermoelectric power plants); otherwise, water consumption by two or more water users within an industry were averaged across a county or sub-county scale within the dataset we utilize. Average water productivity values reduce water productivity variance, which likely reduces the magnitude of potential water savings achieved by attaining the benchmarks. Furthermore, our study likely underestimates both water consumption and water savings of irrigated crop production for two reasons: (1) This study does not capture conveyance losses, which can be significant. While a portion of these losses will recharge aquifers or return to rivers for other productive uses, the rest will evaporate/transpire or flow to sinks, such as inaccessible or saline aquifers and the ocean. (2) Since agricultural water use is rarely metered, we pair modeled estimates of crop irrigation with observations of crop yield to determine water productivity, and this modeling approach underrepresents low-productivity outliers that are using large amounts of water compared to their cohort. Observed crop yields allow us to capture actual variations between irrigators' water productivity [51]; however, the measure and variability of water consumption (the denominator of the water productivity term) is likely underestimated. The crop water model we use employs the common assumption [52–55] that crops are provided exactly the water needed to produce optimal yields. Irrigators often apply more water to their crops than the optimal rate [46, 47], meaning the potential for water conservation is greater than we are able to represent.
Nonetheless, this study represents an important first step towards understanding locations and industries where improved water productivity shows the greatest potential to conserve water. Meeting the direct and indirect water demands of a growing population while providing sufficient water to meet local environmental flow requirements will be a key challenge in the coming decades. Improving water productivity will be critical in meeting this challenge by putting water to more economically beneficial uses, reducing unsustainable water use, and making water available for other uses, including the environment.
Acknowledgments
L T M and B L R acknowledge support by the National Science Foundation Grant No. ACI-1639529 (INFEWS/T1: Mesoscale Data Fusion to Map and Model the U.S. Food, Energy, and Water (FEW) system) and U.S. Geological Survey under Grant/Cooperative Agreement No. G20AP00002. Any opinions, findings, and conclusions or recommendations expressed in this material are those of the author(s) and do not necessarily reflect the views of the National Science Foundation or the U.S. Geological Survey. The findings and conclusions in this publication are those of the authors and should not be construed to represent any official U.S. Department of Agriculture or U.S. Government determination or policy. Any use of trade, firm, or product names is for descriptive purposes only and does not imply endorsement by the U.S. Government.
Competing interests
The authors declare that they have no competing financial interests.
Correspondence
Correspondence and requests for materials should be addressed to L T M (email: lmarston@vt.edu).
Data availability
The data that support the findings of this study are openly available from the sources referenced within the manuscript and at the following URL: https://waterfootprint.org/en/resources/waterstat/wf-production-united-states/