

Abstract
Studying precipitation diurnal variation characteristics is crucial to better understand their formation mechanism. Moreover, it is fundamental in assessing regional climate variability and to validate the effectiveness of cloud and precipitation parameterization schemes in weather and climate models. Based on observational data from 2008 to 2017, this manuscript objective is to assess the aerosol effects on summer precipitation on an hourly-scale diurnal variation basis in the Beijing metropolitan area. The results put in evidence that the precipitation frequency and duration on polluted days were 25.0% and 14.8% lower with respect to clean days. No significant differences were observed in total daily accumulated rainfall between clear and polluted days. While heavy precipitation mean intensity on polluted days increased by 13.5%, which is potentially linked with aerosol microphysical effects. Note that precipitation occurs earlier on polluted days, with peak time of 1 ∼ 2-hour in advance compared with clean days over the urban areas of Beijing, which may be primarily ascribed to the influence of advanced turning local circulation of mountain-valley breezes and urban heat island circulation due to aerosol-radiation effects.
Export citation and abstract BibTeX RIS

Original content from this work may be used under the terms of the Creative Commons Attribution 4.0 license. Any further distribution of this work must maintain attribution to the author(s) and the title of the work, journal citation and DOI.
1. Introduction
The diurnal variation of the global or regional precipitation has significant differences that are mainly affected by topography (Yu et al 2007, Guo et al 2014), underlying surface (Yu et al 2014), land-atmosphere interactions (Dai et al 1999, Dai 2001) and aerosol-cloud-precipitation interactions (Haywood and Boucher 2000, Wang et al 2015, Lee et al 2016, Guo et al 2017, Malavelle et al 2017, Johnson et al 2019, Li et al 2019). The precipitation intensity, frequency, duration and diurnal peak in mainland China during summer exhibited, as expected, strong regional dependence (Yu et al 2007). Precipitation diurnal pattern shows an afternoon preference in South China and Northeast China, while the peak often occurs at midnight on the Tibetan Plateau and its eastern region, and in the early morning and afternoon in the middle and lower reaches of the Yangtze River (Yu et al 2007, 2009, 2014). Studying the diurnal variation of precipitation is crucial for understanding the mechanism of precipitation formation, assessing regional climate and verifying the effectiveness of cloud and precipitation parameterization schemes in weather and climate models (Randall et al 1991, Dai et al 1999, Yu et al 2009, Koo and Hong 2010, Satoh and Kitao 2013).
Recent studies put in evidence that changes in cloud condensation nuclei (CCN) and aerosol advection from remote sources can explain most of the changes in the cloud-radiative forcing of low level clouds above the ocean (75%), which has been seriously underestimated in previous studies (Rosenfeld et al 2019). Anthropogenic aerosol emission isan important source of CCN, that are particularly abundant in large metropolitan areas. Previous studies highlighted precipitation variations induced by increased anthropogenic aerosol emissions (Chen et al 2016, Fan et al 2016, Li et al 2016, Haywood 2016, Liu et al 2018, 2020, Yang et al 2019, Lolli et al 2018). On the one hand, the increase of precipitation frequency and intensity has been already proven to be linked to high aerosol loading (Li et al 2019): for example, (Wang et al 2011) found that severe pollution episodes in the Pearl River Delta (PRD) region in Southern China are responsible of stronger convection, and then the precipitation intensity were increased by 15%. Numerical computations by (Mashayekhi and Sloan 2014) showed that the non-convective precipitation caused by anthropogenic emissions increased by 30% in highly urbanized Atlantic coast regions. (Guo et al 2014) analyzed and simulated a precipitation event caused by a cold front system passage from the east-to the west in northern China cities, showing that the precipitation under polluted conditions increased by 17% with respect to clean conditions.
On the other hand, increased atmospheric column low-level stability with consequent suppression of the convection (Lolli et al 2018, Li et al 2019). For instance, theoretical studies by (Yue et al 2011) showed that an increase in aerosol concentration translates into a decreasing of rainstorm cumulative precipitation, moderate rain and trace precipitation in Beijing by 23.8%, 16.6% and 14%, respectively. (Yang et al 2017) performed heavy precipitation simulations in Beijing with Weather Research and Forecasting-Chemistry (WRF-Chem), showing that different values of aerosol concentrations had no effect on the start time of precipitation, although higher aerosol concentrations translated into a decrease of the precipitation and its area. Differently, over the PRD region, observational analysis based on long-term co-located hourly aerosol concentration and precipitation showed that the increases in aerosol loading could significantly delay precipitation onset and peak time (Guo et al 2016, 2018), which was believed to be mainly caused by the competition mechanism between aerosol radiation effect and aerosol microphysical effect (Guo et al 2016, Lee et al 2016). However, at present, the aerosol effects on precipitation still remains uncertain, as stated in (Li et al 2019).
Beijing, the capital of China, is located in the typical north-temperate, semi-humid and continental monsoon climate zone. Precipitation in Beijing is not evenly distributed during the year, e.g. 80% of the annual precipitation is concentrated in summer months (June-September), because it is strongly affected by the East Asian monsoon (Wang et al 2008). For diurnal variation, there were two peaks in precipitation intensity and precipitation frequency in Beijing in summer: one occurs during the afternoon and the other one early in the morning, while the lowest precipitation occurred near noon (Li et al 2008). While summer precipitation diurnal variation differences are found among the four Beijing sub-regions (the urban area, suburban area, north mountainous area, and south mountainous area), because of the local circulation arising from mountain–valley wind and the differences in underlying surface heating between these sub-areas of Beijing (Yin et al 2011, Wang et al 2012). Particularly, in urban area of Beijing, the dominant characteristic of diurnal variation was a single peak in precipitation amount at 1900 Beijing Time (BJT). Relative to other areas, the urban area of Beijing also lower exhibited lower frequency of precipitation during the whole day (Wang et al 2012), because urbanization modified the surface energy budget and the planetary boundary layer, which in turn affected the occurrence of precipitation (Zhang et al 2014a). Although previous studies have focused on diurnal variations of precipitation in Beijing (Li et al 2008, Yin et al 2011, Wang et al 2012, Yuan et al 2017), revealing that some basic characteristics from different perspectives, constrained by the observation conditions, few studies have investigated the effects of aerosols on hourly precipitation, especially for heavy precipitation. In addition, numerical computations with relatively high temporal precision are easy to obtain; however, most of these simulations are specific to certain case studies and are not validated against observation data (e.g. Yang et al 2017). Particularly, the simulation results present great uncertainties (Turpin et al 2006, Yang et al 2017).
The summer precipitation in North China is dominated by convective precipitation, and strong updrafts can transport aerosols from the surface to higher altitudes (Guo et al 2014, Li et al 2020). Being Beijing a large metropolitan area experiencing severe air pollution in China, it has a unique urban climate and environment (Zhang et al 2014b, Chen et al 2018, Zheng et al 2018, 2019, Zhang et al 2019, Yang et al 2020).Under such a situation, the competition mechanism between aerosol radiation and microphysical effects in modulating the diurnal variations of summer precipitation in Beijing remains still unknown.
In this paper, we investigated the potential impact of aerosols on diurnal variations of precipitation over urban areas of Beijing and the possible causes. The analysis is based on the hourly precipitation data and particulate matter (PM2.5) concentration monitoring data over Beijing metropolitan area in the summers during 2008–2017. It will also help to further understand the local precipitation characteristics in Beijing and improve simulation models with physical parameterization schemes.
2. Data and methods
PM2.5 is used as proxy to assess how aerosol emissions affect air-quality in Beijing, as stated in 2016 annual environmental bulletin (Beijing Municipal Bureau of Environmental Protection), showing that 65% of air pollution days in total in summer during 2008–2017 exhibited PM2.5 as the primary pollutant. The PM2.5 measurement data in this manuscript were obtained from six high-level quality national-level observation stations deployed in Beijing metropolitan area (figures 1(a)). The station characteristics are shown in table S1 in supporting information (SI). During summer (June-August), 10-year (2008–2017) PM2.5 data were obtained from the Baolian (BL) station, and the data obtained from nearby Haidian (HD) station were used to compensate for missing data, which were very few. PM2.5 data were obtained from the micro-oscillation balance monitor (1400 a TEOM) manufactured by Rupprecht & Patashnick Co. (Albany, NY, USA), and particles were dried during the measurement process. Same period precipitation data were obtained from five automatic meteorological stations in the urban areas as stated in a previous study (Zheng et al 2019), Haiding (HD), Shijingshan (SJS), Fengtai (FT), Guanxingtai (GXT) and Chaoyang (CY). These stations were selected to enhance the spatial representativeness of rainfall in Beijing, avoiding the random distribution of rainfall recorded by a single station. These stations are evenly distributed in the urban areas of Beijing and have similar underlying surface features compared to the BL station (figure 1(a)). All data had a temporal resolution of 1 h and passed strict quality control.
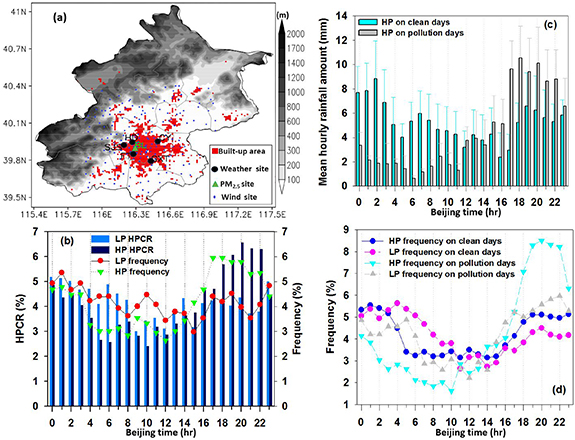
Figure 1. (a) Toppgraphy (m) and relative geographical locations of observation stations in the study area (GXT: Guanxingtai, FT: Fengtai, SJS: Shijingshan, HD: Haidian, CY: Chaoyang, BL: Baolian; The regions for altitudes ranging from 100 m to1000 m can be considered as valleys); (b) Diurnal variations in hourly precipitation contribution rate (HPCR) and frequency, (c) hourly precipitation amount, and (d) hourly precipitation frequency under Clean or Pollution Conditions during the summer seasons of 2008–2017 over urban Beijing. LP: Light precipitation; HP:Heavy precipitation.
Download figure:
Standard image High-resolution imagePrevious study showed that analysis on coincident hourly precipitation and aerosol concentration measurements are easily affected by wet scavenging (Huang et al 2009), which is not conducive to the extract the impacts aerosols on precipitation. To avoid this shortcoming, according to previous method of (Guo et al 2016), we employ 1/3 quantiles method to extract hourly rainfall samples at hourly scale under light and heavy precipitation conditions, while PM2.5 samples at daily scale under clean and pollution conditions (see supplementary information Text S1 and figure S1 in SI (available at stacks.iop.org/ERL/15/094053/mmedia)). As results, the daily PM2.5 concentration on clean days (a total of 306 d) ranged from 11.4 to 39.8 μg.m−3, while on polluted days (a total of 307 d) is in the range of 66.7–214.4 μg.m−3 (table S2 in SI). The light precipitation category (a total of 912 h) shows values in the range of 0.01–0.11 mm.h−1, while heavy precipitation (a total of 898 h) falls between 0.87–40.8 mm.h−1 (table S3 in SI). Note that from 0 to 1 mm h−1, precipitation is measured at tens of millimeters, while above 1 mm decimals are not used, leading to abrupt in in level of details at 1 mm h−1. Thus, the heavy precipitation category of the upper tercile ends up at a much lower value than if the precipitation data were sorted into 1 mm h−1 bins from 0 to 50 mm h−1 (see figure S1).
In this paper, the summer hourly-scale precipitation data in Beijing during 2008–2017 were used to calculate the 10-year/all-polluted/all-clean condition mean daily and hourly precipitation amount, precipitation intensity and precipitation frequency from 0000 to 2300 BJT. The hourly precipitation contribution rate (HPCR) was defined as that the mean hourly precipitation divided by daily mean rainfall. Hourly precipitation frequency is defined as the ratio of light (heavy) precipitation samples to total/all-clean/all-polluted samples at each hour during 2008–2017. The period of diurnal variation ranged from 0000 BJT to 2300 BJT. While when calculating the precipitation duration based on sequential hourly weather records from 0000 BJT 1 June to 2300 BJT 31 August at each summer during 2008–2017, the beginning time of each precipitation event at each summer is defined as the occurrence of each precipitation event and the end of each precipitation event is defined as the absence of precipitation for two hours after the last precipitation time of each event. The duration of precipitation event was just sequentially counted by hours, not depending on different days. In addition, the analysis of variance (ANOVA) test (i.e. F-test) was conducted to assess the statistical significances of the differences in precipitation under between clean and polluted conditions (between light level and heavy level).
In addition, local circulation (including mountain-valley wind and urban heat island circulation) has an important impact on the diurnal variation of local weather and air pollution in Beijing (Chen et al 2009, Zheng et al 2018). To calculate the diurnal variation characteristics of local circulation, wind field observation data from automatic stations were also used, including 175 automatic meteorological stations in urban areas, suburban areas and high-altitude mountainous areas in the west and north regions of Beijing (39.5°N-40.4°N, 115.92 °E-117 °E). Local circulation is usually relatively weak and superimposed by the background wind field. When the background wind is strong, local circulation is difficult to directly observe. According to the previous method (Cao et al 2015, Zheng et al 2018), the background wind field was filtered out and the summer local wind components  (E-W component) and
  (N-S component) in Beijing from 2008 to 2017 were calculated (see supplementary data Text S2).
Lower tropospheric stability (LTS) was used to describe the thermo-dynamical state of the low-level troposphere. ERA5 reanalysis data at 1-hourly interval from European Centre for Medium-Range Weather Forecasts are used to obtain LTS. LTS is defined as the differences in potential temperature (θ) between the free troposphere (700 hPa) and the surface (LTS =θ700hPa-θ1000hPa), and high LTS values generally signify the existence of a strong inversion layer, indicative of a relatively stable atmospheric stratification at low level (Guo et al 2016).
3. Results
3.1. Potential impact of aerosol on heavy precipitation process
Figure 1(b) shows the distribution of diurnal variations of HPCR and precipitation frequency under light and heavy precipitation conditions during 2008–2017. For the light condition, the amplitudes of the diurnal cycles for the HPCR and precipitation frequency were 2.2% and 2.4%, respectively, and their peaks mainly appeared from midnight to early morning (2300–0300 BJT). In contrast, for the heavy condition, their amplitudes were relatively larger with 4.1% and 3.3%, respectively, and the peaks of HPCR and precipitation frequency appeared from sunset to early evening (1700–2200 BJT), which accounted for approximately 36% of the mean daily precipitation and 34% of the precipitation frequency. During 0000–1400 BJT, the HPCR and precipitation frequency of the light precipitation process were higher than those of the heavy precipitation process, while the opposite was true for the periods of 1500 to 2200 BJT. This finding indicates that urban Beijing is affected by heavy precipitation process during the afternoon to the early evening (1500–2200 BJT).
The daily-accumulated rainfall amount averaged by all clean (polluted) days during summer in urban Beijing was 150.9 (121.2) mm, indicating that daily-accumulated rainfall amount was ∼19.7% lower on polluted days than clean days (table S4 in SI), and this difference passed the significance test at 0.1 level. For heavy precipitation, its amount was respectively 126.0 mm on clean days and 106.4 mm on polluted days. Thus, relative to clean days, heavy precipitation amount was ∼15.9% lower on polluted days, which is approaching the difference in mean daily-accumulated rainfall amount of ∼19.7%, indicating that the differences in mean daily-accumulated rainfall between clean and polluted days were mainly caused by the heavy precipitation process. Figure 1(c) shows that the diurnal variation of rainfall amount averaged by all heavy precipitation process on polluted and clean days, respectively. On clean days, the amplitude of the mean hourly rainfall amount of all heavy process was ∼6.4 mm, peaking between 1900–0300 BJT, while on polluted days was much larger, ∼9.9 mm, peaking between 1500–2300 BJT (figure 1(c)). The heavy precipitation distribution on polluted days was more concentrated and its peak was significantly advanced, relative to clean days (figure 1(c)), which is inconsistent with the conclusion that the precipitation peak appeared to lag behind under polluted conditions in the PRD region (Guo et al 2016). The possible reasons are explored in the Discussion section.
3.2. Potential impact of aerosols on the precipitation frequency
The precipitation frequency in urban Beijing was 100.6 h mean by clean days and 75.4 h mean by polluted days during summer; thus, this frequency was 25.0% lower on polluted days (table S4), which passed the significance test at 0.01 level. Figure 1(d) further illustrates the diurnal variation in heavy (light) precipitation frequency, and a significant difference between clean and polluted days, which passed the significance test at 0.01 (0.1) level. Similar to rainfall amount, the precipitation on polluted days showed a unimodal structure, with the high occurrence in the afternoon to early night, with the most frequent precipitation occurring between 1700 and 2300 BJT. The amplitude of precipitation frequency on polluted day was higher than that on clean day. However, the high precipitation frequency on clean days mainly appeared at 1800–0400 BJT. For light/heavy precipitation, the frequencies on clean days were relatively higher than those on polluted days during 0000–1300 BJT. After then, the opposite patterns are found during 1500–2200 BJT, indicating that the precipitation on polluted days was more concentrated with high occurrences. This distribution pattern of precipitation frequency is consistent with that of rainfall amount (figure 1(c)), indicating that the phenomenon of frequent precipitation in the Beijing from noon to early night in summer is likely related to or modulated by the diurnal variations of precipitation on polluted days.
Generally, the high precipitation frequency on polluted days was earlier in the day compared to that on clean days. The peak of light precipitation occurred at 2200 BJT on polluted days, while 0400 BJT on clean days. The peak of heavy precipitation occurred at 2000 BJT on polluted days, while 0100 BJT on clean days.
3.3. Potential impact of aerosols on the precipitation intensity and duration
In addition to rainfall amount and precipitation frequency, precipitation intensity and precipitation duration are also important factors affecting the precipitation distribution, as shown in Lolli et al 2019. Table S4 shows that the mean precipitation intensity did not differ between clean and polluted days: 1.49 mm h−1 and 1.48 mm h−1, respectively. The main difference is related to the amplitude of diurnal variation for the precipitation intensity on clean days was relatively small (∼0.97 mm h−1) while that on polluted days was larger (∼1.95 mm h−1) (figure 2(a)). At 0000–1300 BJT, the mean precipitation intensity on clean days was greater with respect to the polluted days, while in other periods, the mean precipitation intensity on polluted days was significantly higher than that on clean days, which passed the significance test at 0.05 level. The hourly mean precipitation intensity on polluted days peaked at 2.57 mm h−1, which is approximately 1.5 times bigger than on clean days.
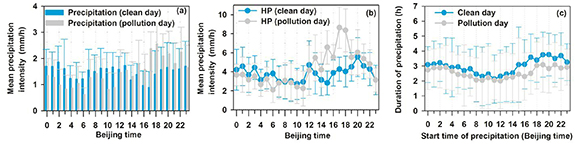
Figure 2. Diurnal variations in (a) hourly mean precipitation intensity, (b) heavy precipitation (HP) intensity, and (c) duration of precipitation (x-axis is start time, y-axis is duration) under clean and polluted conditions, during the summer seasons of 2008–2017 over the urban areas of Beijing.
Download figure:
Standard image High-resolution imageFor heavy precipitation, the mean intensity on polluted days (4.30 mm h−1) was 13.5% higher than that on clean days (3.79 mm h−1; significance test at 0.05 level). The amplitude of diurnal variation for the precipitation intensity on clean days was relatively small (∼2.82 mm h−1) while that on polluted days was larger (∼6.4 mm h−1) (figure 2(b)). The largest difference still occurred in the afternoon, and the peak intensity of heavy precipitation on polluted days (8.64 mm h−1 at 1700BJT) was 55.7% higher than that on clean days (5.55 mm h−1 at 2000BJT; significance test at 0.05 level). This is the main reason for the difference in precipitation distribution (figure 1(b)).
Figure 2(c) shows the diurnal variations of precipitation duration. Generally, for both clean and polluted days, the precipitation that occurred in the afternoon until early night had a relatively long duration. Differently, at the beginning of each precipitation event, the precipitation duration on clean days was longer than that on polluted days. The mean daily precipitation duration on polluted days was 2.54 h, and the maximum duration was 3.08 h, which were shorter than those on clean days (figure 2(c)). The mean precipitation duration on polluted days was 14.8% shorter than that on clean days and the maximum precipitation duration shortened by 18.1% (table S4), which passed the significance test at 0.01 level.
4. Discussion
The present results showed that the total precipitation, frequency and duration on polluted days were lower than those on clean days while the intensity of heavy precipitation significantly increased (table S4). The diurnal variation in precipitation frequency on clean days exhibited a bimodal structure, with peaks in the times from noon to early night and from midnight to early morning. On polluted days, precipitation, (especially heavy), occurred more frequently starting from the afternoon to midnight, which may be the main reason that most of the observed heavy precipitation occurred during this period. Compared with the results of (Guo et al 2016), which indicated that aerosols can significantly delay the triggering time of precipitation in southern China, this paper found that precipitation on polluted days in Beijing metropolitan area occurs earlier with respect to clean days, indicating regional differences in the diurnal precipitation distribution. The potential mechanisms are discussed as follows.
4.1. Potential modulation of local circulation related to aerosol radiation effect
Local circulation is one of the important factors affecting the diurnal variations of precipitation in Beijing region (Yin et al 2011, Wang et al 2012, Zhang et al 2014a). Figure 3(a) presents the distribution of diurnal variations of regional wind components in the summers from 2008–2017 in Beijing, indicating that the anti-phase distribution of the components  (zonal component) and
  (meridional component), and the regional circulation is dominated by the southeasterly wind in the early afternoon to the early night while the northwesterly wind dominated the rest of the day. The urban areas of Beijing are close to the mountainous area in the west, and the corresponding local wind zonal component is larger than the meridional component, indicating that the effect of the valley wind is more significant than the effect of the urban heat island (UHI) circulation (Liu et al 2009). The regions for altitudes ranging from 100 m to1000 m can be considered as valleys in figure 1(b). As shown in figure 3(b), the amplitude of diurnal variation of PM2.5 concentration on clean days was 11.0 μg/m3 (maximum: 35.2 μg/m3; minimum:23.2 μg/m3) while that on polluted days were relatively larger, ∼ 33.8 μg/m3 (maximum: 118.1 μg/m3; minimum: 84.3 μg/m3), enhancing ∼ 200%. On polluted days, therefore, the UHI weakened at daytime and enhanced at nighttime due to aerosol-radiation and aerosol-cloud interactions (Yang et al 2020). In addition, the thermal difference between the mountain and plain areas on polluted days are less due to cooling effects of aerosols in urban plain areas, relative to clean days (Miao et al 2015a). Therefore, on the one hand, the weakened UHI intensity at daytime and decrease thermal difference can induce the changes in local circulation (UHI circulation and valley breeze) and its diurnal variation, i.e. a weakening of the local circulation on polluted days and a reduction in the amplitudes of
  and
and  of local wind on polluted days compared to those on clean days as shown in figure 3(a). Our present findings are consistent with the observations and simulations from previous studies (Miao et al 2015a, 2015b, Zheng et al 2018). On the other hand, on pollution days, the enhanced UHI intensity at nighttime can intensify UHI circulation (Zheng et al 2018, Yang et al 2020), which can weaken and couple with the mountain breeze, leading to the evidence that local circulation (valley breeze at daytime) could change earlier. The sketch plot can be found in figure 4.
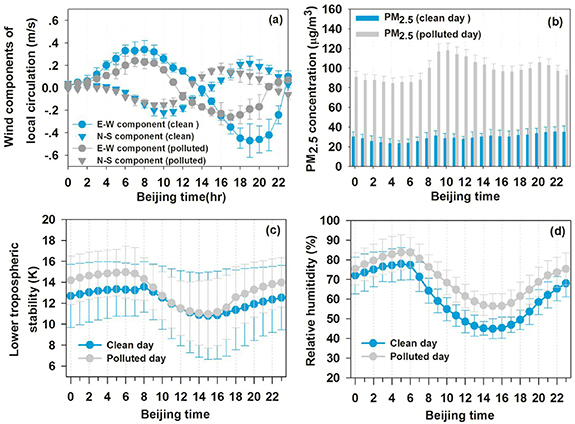
Figure 3. (a) Diurnal variations of local wind speed components (East-West component; North-South component) during the summer seasons of 2008–2017 over the Beijing region. Diurnal variations in (b) hourly mean PM2.5 concentration and (c) lower tropospheric stability, and (d) relative humidity under clean and polluted conditions during the summer seasons of 2008–2017 over the urban areas of Beijing.
Download figure:
Standard image High-resolution image
Figure 4. Schematic plot of local circulations over Beijing area under clean and polluted conditions. NW: northwest; SE: southeast; The dark gray shades indicate existing aerosol pollution. The longer and thicker the circulation arrow, the stronger the local circulation.
Download figure:
Standard image High-resolution image
In detail, on clean days, the local circulation changed from a northwesterly wind (main contribution from mountain breeze) to a southeasterly wind (main contribution from valley wind) at approximately 1400–1500 BJT and the peak of valley wind speed occurred at 1800–2000 BJT (figures 3(a) and 4). According to previous study (Wang et al 2012), this local circulation can induce a convergence zone and initiating deep, moist convection in urban Beijing, resulting the increased rainfall from the late afternoon to the evening with a precipitation peak of 1900–2100 BJT, which is in line with our findings on precipitation peak (see figures 1(c),1(d) and 2). And then it changed from a southeasterly wind (main contribution from valley wind) to a northwesterly (main contribution from mountain breeze) wind at approximately 2200–2300 BJT. In contrast, on polluted days, the above two local wind turning points (1400–1500 BJT and 2200–2300 BJT) advanced to 1200–1300 BJT and 2100–2200 BJT (figures 3(a) and 4). The first peak of local wind speed appeared at 1600–1800 BJT, implying that the dynamical conditions (i.e. advanced convergence and initiating moist convection related to advanced turning local circulation) of precipitation may occur early (figures 3(a) and 4), which will be favorable to earlier occurrence of precipitation. That is, the precipitation peak advanced to 1700–1900 BJT with 1 ∼ 2-hour leading of rainfall peak occurrence on polluted days, relative to clean days (see figures 1(c),1(d) and 2).
In addition, the absorbing aerosols were shown to have very clear stabilizing effects from surface to the middle PBL (Ding et al 2016, Wilcox et al 2016, Talukdar et al 2019, Zhou et al 2019), and is associated with less convection and could cause a positive feedback loop causing high-concertation PM2.5, which are potentially supplied as sufficient CCNs for precipitation. Previous studies showed that the absorbing aerosols (e.g. black carbon particles) were usually detected in the eastern China, including Beijing (Zhang et al 2006, Gu et al 2006, 2010, Gao et al 2016, Huang et al 2016, Li et al 2018, Yang et al 2018, 2020). In the present study, the results show that the minimum in LTS and resultant unstable atmospheric column appeared at ∼1500 BJT in both clean and polluted days (figure 3(c)), although, with respect to clean days, larger LTS found at most time on polluted days indicated less lower atmospheric instability (figure 3(c)) that inhibited the convection development because of absorbing aerosols. In general, local circulation weakening and higher atmospheric stability for most of the time on polluted days may be unfavorable to trigger precipitation and to prolong precipitation duration, resulting in less precipitation frequency and shorter precipitation duration. Therefore, air pollution modulations on precipitation duration can be one of the potential causes for short duration precipitation gradually increasing and long duration precipitation drastically decreasing in the past decades (Li et al 2008), when the air pollution was becoming serious at the same time, which should be further explored in future work.
4.2. Potential linkage to aerosol microphysical effect
Note that, when sufficient moisture is in the convective cloud, increase in aerosols in the cloud may lead to an increase in the number of CCNs with reduced radius (Albrecht 1989). The indirect effect of aerosols could encourage cloud formation and promote coalescence under sufficient water vapor, thereby increasing the precipitation efficiency and causing large rain rate (Fan et al 2015). In this present study, with respect to clean days, the relative humidity (water vapor) was higher on polluted days (figure 3(d)). According to previous studies (Miao et al 2017; Guo et al 2018), both local and remote sources could contribute to increase PM2.5 concentration in Beijing during summer. In particular, on most polluted days, there was a concurrent strong advection transport of high-concentration PM2.5 and sufficient higher moisture in Beijing, brought by prevailing southeasterly wind in the near-surface layer in the afternoon (Yan et al 2019). Note that this prevailing southeasterly wind was mainly induced by coupled local circulation and sea breeze (Liu et al 2009, Yan et al 2019). On one hand, before precipitation, higher RH may result in more efficient secondary aerosol production due to active aqueous phase chemistry and heterogeneous reaction, which could increase surface PM2.5 mass concentration; on the other hand, the high humidity (water vapor) condition was more favorable to rainfall formation, and the relative humidity in the afternoon on polluted days was 10.3% higher (figure 3(d)). It is possible to speculate that this fact may be the reason why we found more concentrated precipitation on polluted days. Therefore, the mean PM2.5 concentration at 3 h before heavy precipitation was 9.3% higher than that before light precipitation (fiure. S2), implying that heavy precipitation is partly linked to many more aerosols acting as CCNs under sufficient water vapor and certain favorable dynamical environments (i.e. advanced convergence and initiating deep, moist convection related to advanced turning local circulation on pollution days) (figures 3(a), 4 and 3(d)). That is, once precipitation happened, the rain rate would be intensified by dramatic aerosol microphysical effects. In addition, the stronger the precipitation, the more obvious the wet deposition effect on PM2.5 (figure S2).
In general, different local circulations and the radiation effects of aerosol components may represent reasons for regional differences in the potential linkage between diurnal variation of precipitation and aerosol pollution, i.e. our present finding shows the leading in the precipitation peak on polluted day compared to clean day in Beijing, which is different from the PRD region of southern China exhibiting the lag peak on polluted days (Guo et al 2016). Complex feedback processes occur between aerosol presence and cloud precipitation; thus, considerable uncertainties are involved in quantifying the impact of aerosols on cloud precipitation. Often precipitation forecast models fail in those regions where the aerosol pollution is high (Ding et al 2013). It can be related to the fact that those forecast models are not considering the effects of the aerosols. This is the reason that there were similar minimum LTS derived by model on both polluted and clean days (figure 3(c)), that is, we can not find an advanced occurrence of minimum LTS on polluted days compared to clean days by using model data. Therefore, the influencing mechanism of aerosols on convective precipitation must be further investigated and the effect of aerosols in the model must be considered to improve the forecast accuracy.
5. Conclusions
It is still not fully understood how higher aerosol atmospheric concentrations affect precipitation, especially in large metropolitan areas prone to heavy pollution episodes. We analyzed summer hourly meteorological observation data and hourly PM2.5 data from 2008–2017 to assess the diurnal variation characteristics of summer precipitation in urban Beijing and discuss the precipitation diurnal variations, precipitation intensity, duration and frequency, and potentially associated with aerosol pollution. The main conclusions can be summarized as follows.
The total precipitation, precipitation frequency and precipitation duration values on polluted days are lower with respect to clean days, although the heavy precipitation intensity significantly increased during polluted days. The precipitation on polluted days occurs earlier in the day with respect to clean days, and mainly concentrated from afternoon to early night with 1 ∼ 2-hour leading of rainfall peak occurrence on polluted days, relative to clean days, while the precipitation on clean days often occurred in the second half of the night. The differences in the distribution of diurnal variations of precipitation between polluted and clean days were mainly related to the advanced turning and weakening local circulation of coupled UHI circulation and mountain-valley breezes due to aerosol radiation effects, causing advanced convergence and initiating moist convection on pollution days. In addition, the weakened local circulation on polluted days can be unfavorable to trigger precipitation and to prolong precipitation duration, resulting in lower precipitation frequency and shorter precipitation duration. It is possible to speculate that the increased precipitation intensity on polluted days is probably due to the ability of higher aerosol concentrations to effectively act as CCNs (i.e. aerosol microphysical effects), promoting precipitation when the atmosphere thermodynamic and vapor conditions are satisfied.
In general, our findings provide scientific evidence that the diurnal variation characteristics of precipitation process are closely related to surface aerosol pollutions, which is expected to shed lights on improving the cloud parameterization schemes in future in order to accurately simulate precipitation in the urban Beijing under air pollution conditions. The findings reported here should also have important implications for other urban regions near mountain areas both in China and other developing countries experiencing high concentrations of PM2.5.
6. Key points
- Precipitation frequency and duration on polluted days were 25.0% and 14.8% lower than those on clean days, respectively
- Heavy precipitation mean intensity increased by 13.5% on polluted days than clean days potentially linked with aerosol microphysical effect
- Precipitation occurs earlier on polluted days, with peak time of 1 ∼ 2-hour in advance compared with clean days via aerosol radiation effect
Acknowledgments
This study is supported by the National Key R&D Program of China (No. 2018YFC1506801), Beijing natural science foundation (8202022 and 8171002), and the National Natural Science Foundation of China (41975002 and 41575010). The authors also thank two anonymous reviewers for their constructive comments.
Data availability statement
The data that support the findings of this study are openly available. The Database Management System of Atmospheric Composition of Beijing for providing PM2.5 data (http://10.224.22.80/Frame/MainIndex.aspx), Meteorological Information Centre of China Meteorological Administration for providing Meteorological data (http://data.cma.cn/site/index.html), and ECMWF for providing ERA5 reanalysis data (https://www.ecmwf.int/en/forecasts/datasets/reanalysis-datasets/era5).