

Abstract
Amidst declarations of planetary emergency and reports that the window for limiting climate change to 1.5 °C is rapidly closing, global average temperatures and fossil fuel emissions continue to rise. Global fossil CO2 emissions have grown three years consecutively: +1.5% in 2017, +2.1% in 2018, and our slower central projection of +0.6% in 2019 (range of –0.32% to 1.5%) to 37 ± 2 Gt CO2 (Friedlingstein et al 2019 Earth Syst. Sci. Data accepted), after a temporary growth hiatus from 2014 to 2016. Economic indicators and trends in global natural gas and oil use suggest a further rise in emissions in 2020 is likely. CO2 emissions are decreasing slowly in many industrialized regions, including the European Union (preliminary estimate of −1.7% [–3.4% to +0.1%] for 2019, −0.8%/yr for 2003–2018) and United States (−1.7% [–3.7% to +0.3%] in 2019, −0.8%/yr for 2003–2018), while emissions continue growing in India (+1.8% [+0.7% to 3.7%] in 2019, +5.1%/yr for 2003–2018), China (+2.6% [+0.7% to 4.4%] in 2019, +0.4%/yr for 2003–2018), and rest of the world ((+0.5% [−0.8% to 1.8%] in 2019, +1.4%/yr for 2003–2018). Two under-appreciated trends suggest continued long-term growth in both oil and natural gas use is likely. Because per capita oil consumption in the US and Europe remains 5- to 20-fold higher than in China and India, increasing vehicle ownership and air travel in Asia are poised to increase global CO2 emissions from oil over the next decade or more. Liquified natural gas exports from Australia and the United States are surging, lowering natural gas prices in Asia and increasing global access to this fossil resource. To counterbalance increasing emissions, we need accelerated energy efficiency improvements and reduced consumption, rapid deployment of electric vehicles, carbon capture and storage technologies, and a decarbonized electricity grid, with new renewable capacities replacing fossil fuels, not supplementing them. Stronger global commitments and carbon pricing would help implement such policies at scale and in time.
Export citation and abstract BibTeX RIS

Original content from this work may be used under the terms of the Creative Commons Attribution 3.0 licence. Any further distribution of this work must maintain attribution to the author(s) and the title of the work, journal citation and DOI.
Climate change records continue to mount. The earth has already warmed 1.1 °C since pre-industrial times, and 2014–2019 is the hottest five-year period on record for average global surface temperatures (World Meteorological Organization 2019). Temperatures in the Arctic have warmed twice as quickly as the global average over the last two decades; during the winters of 2016 and 2018, surface temperatures in the central Arctic were 6°C above the 1981–2010 average (IPCC 2019a). Extreme weather events, especially storms and floods, displaced a record 7 million people in the first half of 2019 (IDMC 2019).
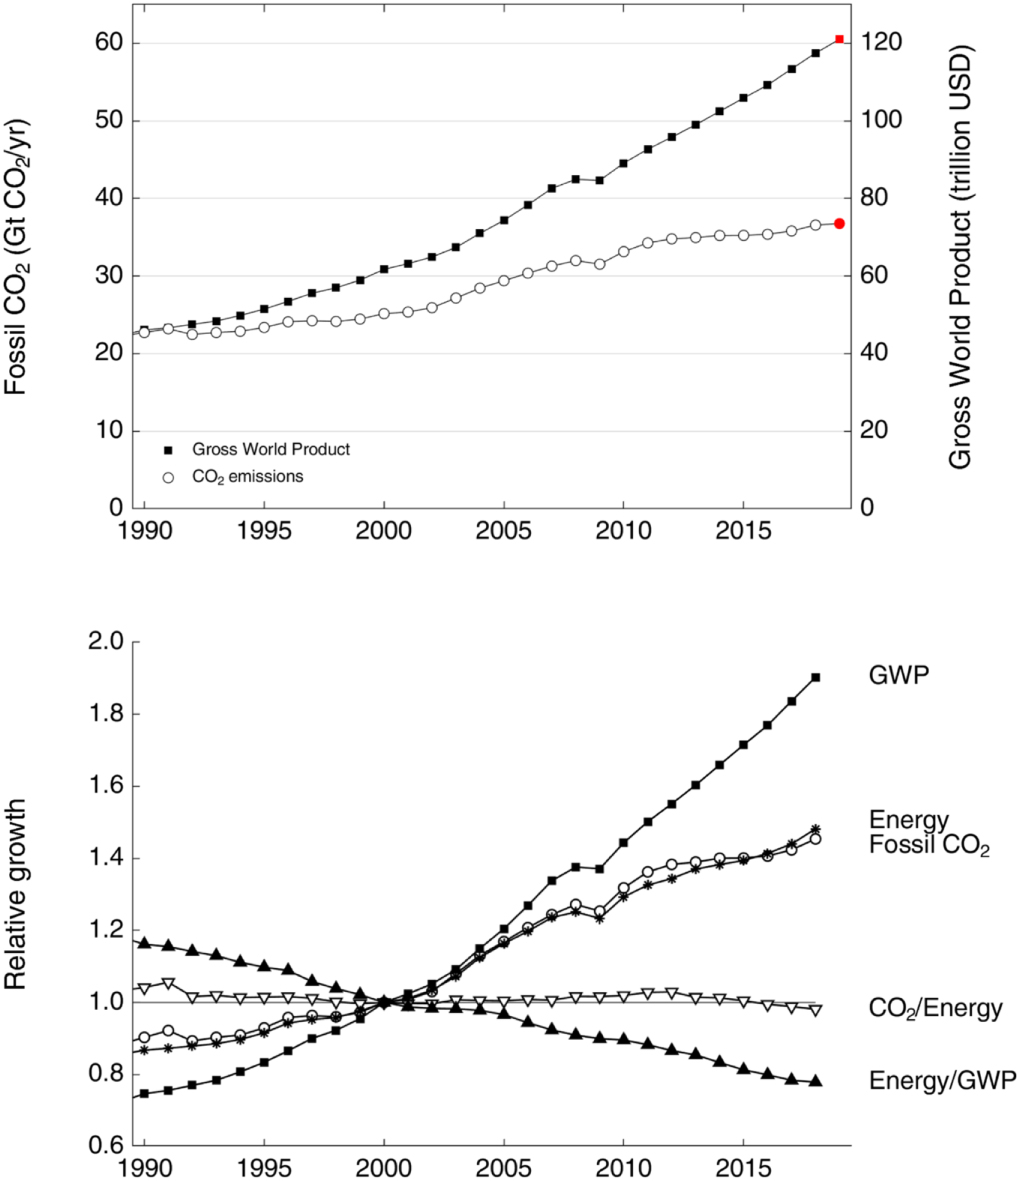
The temporary slowdown in CO2 emissions growth from 2014 to 2016 (Jackson et al 2016, Le Quéré et al 2018, IEA 2018a) has now been followed by three years of increases (figures 1 and 2). Fossil CO2 emissions in 2018 increased 2.1% to 36.6 ± 1.8 Gt yr−1 (Jackson et al 2018, Le Quéré et al 2018, Friedlingstein et al 2019). Our preliminary estimate7 is for 2019 emissions to increase slightly by 0.6% (−0.2% to +1.5%) to a record 36.8 ± 1.8 Gt CO2 (Friedlingstein et al 2019). Even stable emissions at today's rates, let alone rising ones, make temperature targets of 1.5° and 2.0 °C less likely to obtain and more challenging and expensive to reach.

Figure 1. Upper panel: global CO2 emissions from fossil-fuel use and industry (open circles) and Gross World Product ($ US) expressed as purchasing power parity (filled squares; World Bank 2019) since 1990. The red symbols are projections for 2019. Bottom panel: relative to year 2000, Gross World Product, global CO2 emissions from fossil-fuel use and industry, global energy use (BP 2019), CO2 intensity of the energy system (global CO2 emissions from fossil-fuel use and industry divided by global energy use), and energy intensity of the global economy (global energy use divided by global GDP) from 1990 to 2018.
Download figure:
Standard image High-resolution image
Figure 2. Upper panel: fossil CO2 emissions, including cement production, globally and for five regions (ROW = Rest of Word); brackets show average annual growth rate for 2013–2018. Lower panel: fossil CO2 emissions by fuel type (coal, oil, and natural gas) plus emissions from cement production and flaring.
Download figure:
Standard image High-resolution imageRegional emissions and trade
Global fossil CO2 emissions in 2018 and 2019 continue to be dominated by China, the United States, and the European Union (EU28), which together contribute ∼52% of global fossil CO2 emissions (figure 2). After stabilizing for four or so years, China's CO2 emissions in 2018 increased 2.3% to 10.1 billion tonnes CO2 and a preliminary 2.6% increase in 2019 (range of +0.7% to 4.4%) to ∼10.3 billion tonnes CO2 (Friedlingstein et al 2019, Peters et al 2019). Emissions from oil and natural gas consumption and cement production in China are all expected to rise more than 6% in 2019, attributable in part to continued stimulus spending by the Chinese government and increased output of energy-intensive industries such as steel production. China's coal use, which comprises half of global consumption and two thirds of its fossil CO2 emissions, is expected to increase another +0.8% in 2019.
After increasing 2.8% in 2018 to 5.4 billion tonnes CO2, fossil CO2 emissions in the United States are projected to decrease 1.7% in 2019 (range –3.7% to +0.3%), continuing a steady average decline of 0.8%/yr from 2013 to 2018 (Friedlingstein et al 2019, EIA 2019a) (figure 2). Energy consumption from oil in the US is projected to decline slightly by 0.5% in 2019, primarily in the transportation sector, after increasing +1.3%/yr for 2013 to 2018 (figure 3). US Energy generation from coal, estimated to be ∼12 EJ in 2019, is projected to decline a remarkable ∼11% from 2018 generation to levels not seen since 1965, and 50% below its peak of 24.1 EJ in 2005 (EIA 2019a). Since 2010, US power companies have announced the retirement of >100 GW of coal-fired power capacity and >500 coal-fired power plants; in contrast, there are currently no new coal plants under construction in the United States.

Figure 3. Average annual energy consumption (EJ) by fuel source from 2000 to 2018 globally and regionally, with average annual growth shown from 2013 through 2018 (BP 2019).
Download figure:
Standard image High-resolution imageMuch of the decline in CO2 emissions in the United States in 2019 arose from the displacement of coal by natural gas and, to a lesser extent, solar and wind power in electricity generation, coupled with a 2% reduction in overall US electricity demand (figure 3). Total natural gas use in the United States is projected to rise ∼6% in the electricity sector and ∼3.5% overall in 2019. Growth in wind and solar power generation in 2019 (projected to rise 8% and 11%, respectively) is responsible for displacing approximately one sixth of the decline in coal generation in the US electricity sector in 2019 (EIA 2019a).
In the EU28, CO2 emissions in 2018 declined an estimated −2.1% to 3.4 billion tonnes CO2, approximately 9% of the global total (figure 2). EU28 emissions are expected to drop a further 1.7% in 2019 (range of –3.4% to +0.1%), primarily attributable to a 10% reduction in coal-based emissions (Friedlingstein et al 2019). This reduction in coal use accelerates an average drop of 5.1% per year observed for coal from 2013 to 2018 (figure 3). The UK has transformed its electricity sector in remarkably rapid fasion, going from 42% coal-fired generation in 2012 (∼130 billion kW hours) to only 5% coal-fired in 2018 (EIA 2019a, BEIS 2019). Along with a 10% decline in total electricity generation in the UK over the same period, increased natural gas generation replaced about half of the losses from coal, with wind, solar, nuclear, and biomass replacing the other half. CO2 emissions from oil use in the EU are expected to grow a modest 0.5% in 2019, slightly lower than the 0.8% per year growth from 2013 to 2018; CO2 emissions from natural gas is likely to rise a further 3.0% in 2019, higher than the 1.7% per year average from 2013 to 2018.
India's CO2 emissions rose 8.0% in 2018 and are expected to rise a further 1.8% in 2019 (range of −0.7% to +3.7%), substantially less than the average 5.1% growth rate over the last five years (figure 2). CO2 emissions in India from coal are expected to grow 2.0% in 2019, lower than the last five years of average growth (4.2%) with some slowing of India's economic growth. The weaker economy is expected to reduce growth in CO2 emissions from both oil use (+1.5% in 2019 compared with +8.7% annually from 2013 to 2018) and cement production (no growth in 2019 compared to +3.7% over the previous five years; Friedlingstein et al 2019). Increased CO2 emissions in India from natural gas use in 2019 are consistent with recent years—an estimated 2.5% growth compared with 2.4% on average from 2013 to 2018.
Globally, natural gas use is growing the fastest of all fossil fuels (figure 3). Natural gas use increased 2.6%/yr from 2013 to 2018 (figure 3) and its associated CO2 emissions are projected to rise 2.5% in 2019 to 7.7 billion tonnes (compared with 0.9% growth for oil and a decline in global coal use of −0.9% in 2019). Dependent historically on pipelines for transport, the natural gas market is being transformed by new liquified natural gas (LNG) terminals. The global LNG trade grew 10% in 2018 to 317 million tonnes, the fifth consecutive year of record trade (IGU 2019). Import facilities opened in 2018 for the first time in Panama and Bangladesh, and Japan, China, and Turkey all added new regasification terminals to receive additional LNG imports (IGU 2019).
LNG exports from suppliers Australia and the United States are surging, reducing regional price disparities in natural gas and expanding access to it. Since 2013, Australia has tripled its LNG exports to ∼100 billion m3 yr−1 and is now the world's largest LNG exporter (Commonwealth of Australia 2019). Suppliers in the United States recently opened five natural gas liquefaction terminals, and the US is now the world's fourth largest exporter of LNG. Importantly, and in part because of this market globalization, many regional price differences for natural gas are declining. LNG prices in Japan and Korea have dropped by two-thirds from peak values in 2012; natural gas prices in East Asia, for instance, that were typically ∼3–5-fold higher than in North America were down to only two-fold higher in late 2019. Greater natural gas supply coupled with cheaper prices could extend the market penetration of natural gas for decades. Moreover, many of the new LNG exports are supplementing coal generation, not replacing it. In Japan, the world's largest importer of LNG, almost all of the increased natural gas consumption since 2010 has replaced nuclear capacity lost after the Fukushima accident (EIA 2019b).
Inequities in per capita consumption
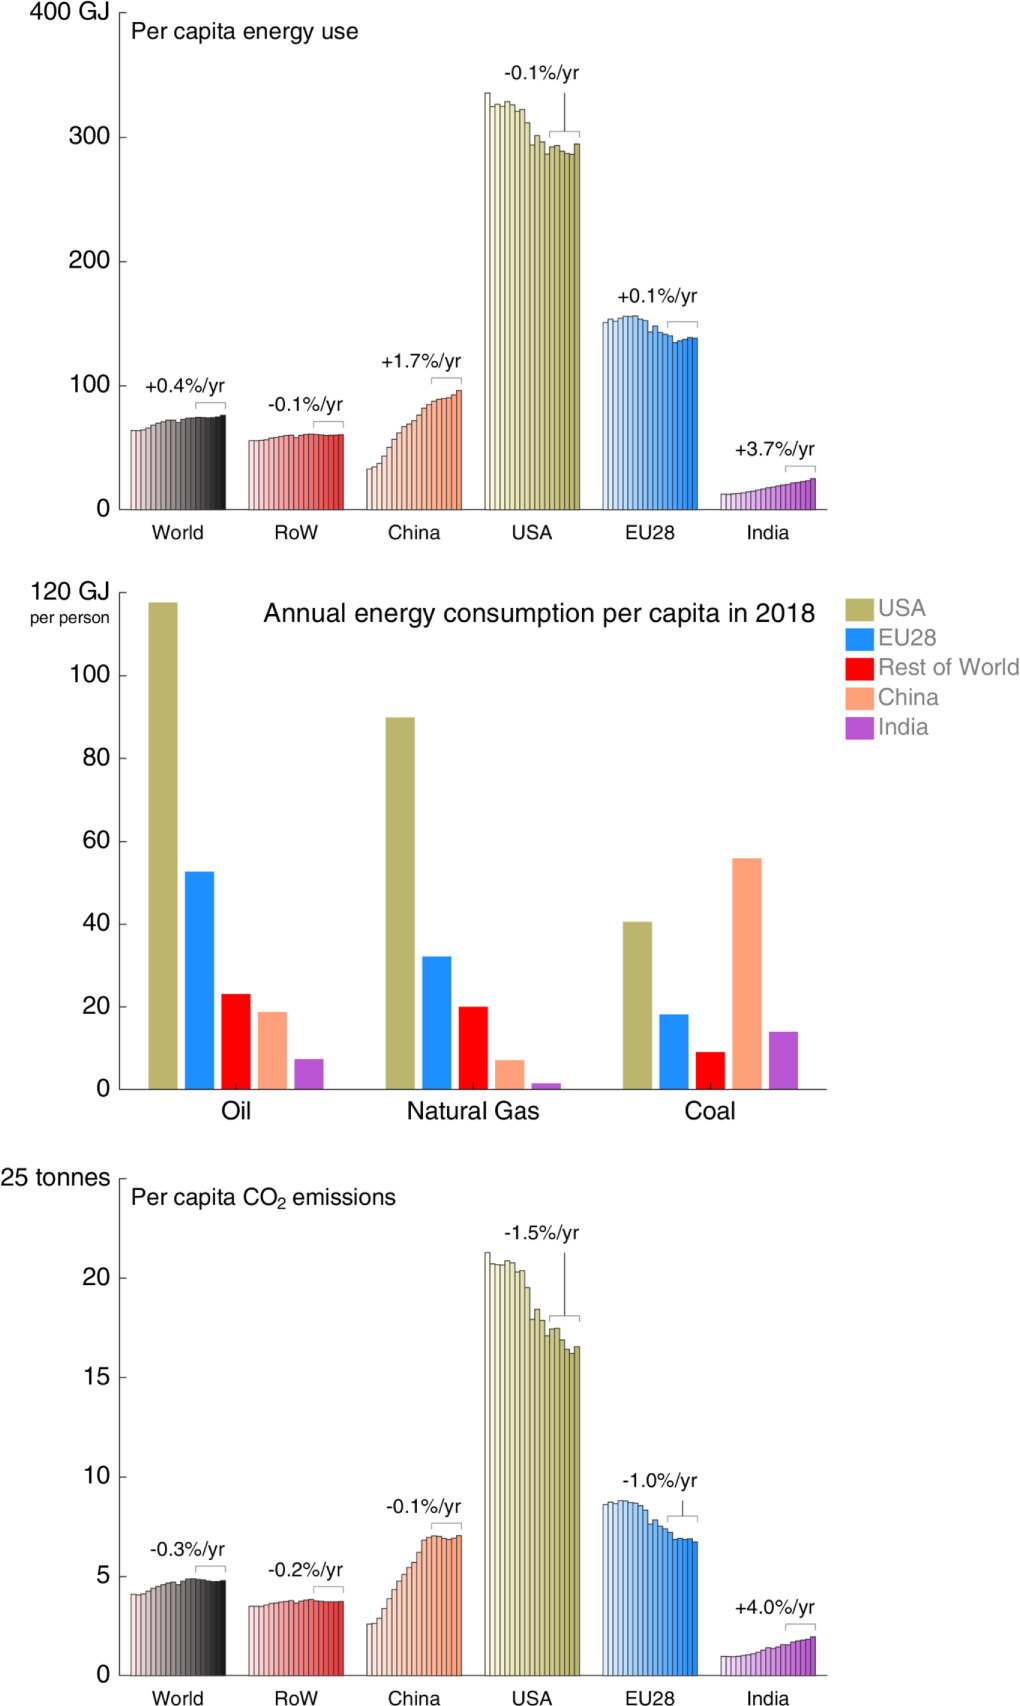
Per capita CO2 emissions and energy use by region and fuel source illustrate trends and challenges in the global economy (figure 4). Average global emissions in 2018 were 4.8 tonnes of fossil CO2 per person. Australia, the United States, China, and the European Union all had per capita emissions well above average (16.9, 16.6, 7.0, and 6.7 tonnes CO2 per person, respectively). China's per capita CO2 emissions are now as high or higher than those in the European Union, where emissions have been declining ∼1% per year on average and have dropped the most of any region since 1990. In contrast to wealthier regions, Africa's average fossil CO2 emissions are only 1.1 tonnes CO2 per person and India's average is 2.0 tonnes CO2. Although India's per capita emissions and energy use both grew ∼4% annually from 2013 to 2018, they remain only one eighth of those in the United States or Australia and less than a third of China's and the European Union's (figure 4, top and bottom panels). Decreased energy consumption in total, not just on a per-capita basis, and renewables substituting for fossil fuels are both needed to attain a global peak and decline in CO2 emissions.

Figure 4. Per capita primary energy consumption (GJ person−1) by region (top panel) and fossil fuel source (middle panel) and CO2 emissions (bottom panel; Mg or tonnes CO2 person−1) from 2000 to 2018, with average annual changes shown in brackets from 2013 through 2018. RoW = Rest of World.
Download figure:
Standard image High-resolution imageThe challenge of reaching peak emissions becomes starker when comparing per capita consumption of individual fossil fuels (figure 4, middle panel). Oil consumption per person in the EU is seven-times higher than in India and three-times higher than in China. Inequities with the United States are even greater. US per capita oil consumption is sixteen-fold and six-fold greater than in India and China, respectively (figure 4). Vehicle ownership is similarly skewed, with almost one motor vehicle per person in the United States but only one for every 40 people in India and 6 in China. A similar rate of car ownership in China or India as in the United States would place a billion cars in either country alone, comparable to today's global fleet, which currently has fewer than 1% of vehicles powered by electricity.
Vehicle ownership in India, China, and elsewhere is growing rapidly, with almost all of the new cars powered by oil. The International Energy Agency (IEA) recently projected passenger vehicle ownership in India to grow 775% by 2040, from ∼20 to 175 vehicles per thousand people (IEA 2018b). The number of cars on China's roads quadrupled between 2007 and 2018 from 59 million to 240 million, an average annual increase of 14%, although purchases in 2019 slowed slightly. Chinese consumers bought more electric cars in 2018 than consumers in any other country—1.1 million vehicles representing 55% of the global market—but still purchased 22 million new internal combustion cars, most of them additional, because China's vehicle fleet is so young. With hundreds of millions of families in China and India yet to own vehicles, per capita oil consumption will likely rise in both countries over the next decade or two at least, even if never reaching current per capita levels of the United States and EU (figure 4).
Inequities in per capita oil consumption are as large for air travel as they are for passenger vehicles. An average citizen of the United Kingdom or United States was ∼17 times more likely to fly in 2017 than a citizen of India and ∼5 times more likely than a Chinese citizen (IATA 2018). Globally, the number of airline passenger trips overall grew 7% annually from 2013 to 2018, from 3.0 billion to 4.2 billion, and far faster than the growth in vehicular traffic (World Bank 2019). Increased passenger numbers outpaced gains in aircraft fuel efficiency during the same period, increasing fuel consumption of commercial airlines 5% annually, from 74 to 95 billion gallons (Statista 2019). With no current way to decarbonize long-haul air travel, a rising middle-class of consumers in India, China, and elsewhere will inevitably fly more and, as a result, increase oil-derived CO2 emissions from aviation. Overall, if these additional emissions from new vehicles and increased air travel are not offset by reduced mileage elsewhere, energy efficiency gains, and reductions in other sectors and places, peak CO2 emissions could remain decades away. Net zero emissions and climate stabilization would be even more distant.
Perspective and solutions
Global CO2 emissions appear poised to rise again in 2020. Global consumption of natural gas is surging, only partially replacing coal use in the United States and European Union (figure 3). Global energy use also continues to rise. Global GDP is projected to grow by 3.0% in 2020 (IMF 2019), and the global energy system is far from fully decarbonized. In consequence, energy growth still contributes additional CO2 emissions—despite the rise of renewable fuels as the lowest-cost source of new power in most places today (IRENA 2019)—because the carbon intensity of global energy production has yet to fall (figures 1 and 2). Moreover, global population continues to grow by 82 million people a year and is expected to reach 9.7 billion by 2050, adding further demands on the energy system.
Many pathways are available to decarbonize the global economy. Templates exist in 18 or more countries where economies grew over the past decade while their CO2 emissions declined (Le Quéré et al 2019). A key characteristic of these countries was the coupling of stable or declining energy use with new renewable fuel capacity that displaced fossil fuel use.
We illustrate two broad conceptual categories of decarbonization through saving energy and replacing fossil fuels (figure 5). Nations vary greatly in energy efficiency and efficiency standards. Countries with relatively higher gasoline prices (>$1 US per liter; e.g. European Union, Japan, Korea, and Turkey), for instance, have substantially more fuel-efficient vehicles (∼5–6.5 liters per 100 km traveled) than countries where gasoline is cheaper, such as Australia, Canada, and the United States (∼8–9 liters per 100 km traveled) (IEA and ICCT 2019). Current proposals to undermine existing fuel efficiency standards in the United States will harm not just climate but human health through increased air pollution, mortality, and morbidity (Cohen et al 2017). LED lightbulbs use only one-tenth the electricity of a typical incandescent bulb and one half that of a compact fluorescent. Reducing meat consumption in diets of people in wealthier countries typically improves health (Springmann et al 2016, IPCC 2019b), saves energy, and reduces emissions of methane, a greenhouse gas more potent than CO2 (Saunois et al 2016), from cattle and other ruminants.

Figure 5. Some tools and approaches for climate stabilization, through saving energy and replacing fossil fuel use with renewables and other low- and no-carbon approaches.
Download figure:
Standard image High-resolution image
Replacing fossil fuels with low- and no-carbon alternatives is critical for limiting climate change to 1.5° or 2 °C, but only if such alternatives displace fossil fuels (figure 5) (Peters et al 2017, IPCC 2018, Davis et al 2018). Many 1.5 °C mitigation scenarios (e.g. van Vuuren et al 2018), require a transition to no- or low-carbon sources for 80% or more of all energy infrastructure by 2050. Coal use is already being replaced by renewables for electricity generation in the United States and European Union, the primary source of declining CO2 emissions in both regions (figures 2 and 3). Trends in China's high absolute and per capita CO2 emissions based on coal use (figures 2 and 4) are declining because of the push for cleaner air. Research on, and current deployment of, carbon capture and storage technologies could reduce CO2 emissions in new facilities and by retrofitting existing fossil fuel power plants. Electric cars still make up <1% of the global fleet but are growing rapidly; coupled to low- and no-carbon fuels, they can reduce transport emissions substantially. The IEA (2018b) forecasts that the number of electric vehicles will grow globally from ∼3 million in 2018 to 125 million by 2030.
Natural climate solutions can mitigate carbon emissions and remove carbon from the atmosphere through conserving and restoring habitats and improving land management of plants, soils, and ecosystems (e.g. Griscom et al 2017). Pathways to success are clear and attainable. We need to deploy them faster and more quickly than we have to date, while providing additional energy to hundreds of millions of people still living in energy poverty (Casillas and Kammen 2010, Hubacek et al 2017). Only then will CO2 emissions peak and, finally, begin to decline, driven by additional gains in energy efficiency and new renewable capacities that replace fossil fuel use, not supplement it.
Acknowledgments
The data that support the findings of this study are openly available at globalcarbonproject.org. The authors acknowledge support from the Center for Advanced Study in the Behavioral Sciences at Stanford University (RBJ), the Gordon and Betty Moore Foundation (RBJ and JGC), the Australian Government's National Environmental Science Programme's Earth Systems and Climate Change Hub (JGC), the European Commission Horizon 2020 projects VERIFY (#776810) (GPP, RMA, and CLQ) and 4C (# 821003) (PF, GPP, RMA, CLQ), and Future Earth. We thank the many scientists and funding agencies whose efforts and support contributed to the Global Carbon Budget 2019 released by the Global Carbon Project (globalcarbonproject.org). C Terrer and S Féron at Stanford University provided helpful comments on the manuscript.
One-line summary
Fossil CO2 emissions in 2019 are set to grow +0.6% (range of −0.2% to +1.5%) to a record high of 37 billion tonnes CO2.
Footnotes
- 7
Our projections for 2019 are based on monthly data and statistical analysis for China, the United States, the European Union, and India combined with economic data for the rest of the world (Friedlingstein et al 2019).