

Abstract
The Tibetan Plateau (TP) is the largest and highest upland on Earth. Warming on the TP is faster than that in surrounding areas. Evaluating our understanding of the causes behind these changes provides a test of tools used for projections of future climate in the region. In this study, we analyse the observed changes in twelve extreme temperature indices and compare them with model simulations based on the Coupled Model Intercomparison Project Phase 5 (CMIP5). An optimal fingerprinting method is used to perform detection and attribution analyses on the changes in absolute intensity, percentile-based frequency, fixed threshold exceedances of temperature extremes and diurnal temperature ranges in the central and eastern TP. The results show that during 1958–2017 the TP has experienced increasing intensity and frequency of warm extremes and decreasing intensity and frequency of cold extremes, with almost all these changes larger than those in China and East China. The detection results and attribution analyses show that the anthropogenic (ANT) signal can be robustly detected in the trends for all extreme indices on the TP, and the natural (NAT) signal in some cases, too. The attributable contribution from ANT is estimated to be much larger than that from NAT for most indices. The study also indicates that the CMIP5 models may underestimate the magnitude of warming in some temperature extremes, especially the indices related to cold extremes. This should be kept in mind when informing adaptation decisions on the TP with projections based on the same models.
Export citation and abstract BibTeX RIS

Original content from this work may be used under the terms of the Creative Commons Attribution 3.0 licence. Any further distribution of this work must maintain attribution to the author(s) and the title of the work, journal citation and DOI.
1. Introduction
The Tibetan Plateau (TP) is the largest and the highest upland on Earth, with an average elevation of more than 4000 m above sea level. With the global warming, the changes in mean temperature and extremes across the globe show different regional features (IPCC 2013). Rapid warming rates are often observed in mountainous and high-latitude regions (Screen 2014, Pepin et al 2015). In the past several decades, the TP has experienced substantial warming (Liu and Chen 2000, You et al 2008, Duan and Xiao 2015), and warming persists during 'so-called hiatus period' (Duan and Xiao 2015, You et al 2016). Rapid warming has exerted important influence on the ecosystem in this region, including rapid retreat of glaciers, terrestrial vegetation migration and decreases in the quality of the landscape. The increased natural disasters associated with warming have exacerbated the risk to people's lives and property on the TP (Cui et al 2014, Committee on China's National Assessment Report on Climate Change 2015).
With substantial warming, increasing numbers of weather and climate extremes have occurred on the TP in recent decades. Very few studies about temperature extremes on the TP were conducted before the 1990s because of the lack of high-quality data. With the increase in homogenized observational data, studies in this area have begun to proliferate (Zhou et al 2016, Duan et al 2018, You et al 2008, 2018). These studies show significant increasing/decreasing trends for a series of extreme warm/cold temperature indices defined by the Expert Team on Climate Change Detection and Indices (ETCCDI) (Zhang et al 2011) on the TP. The trends in the nighttime temperature extremes are greater than those in the daytime temperature extremes (Liu et al 2006, You et al 2008, Zhou et al 2016). The warming on the TP is larger than those in East China for both mean temperature and extreme temperature (Tang et al 2005, Zhang and Zhou 2008, Duan and Xiao 2015).
Detection and attribution analyses are used to quantify the influence of external forcing on observed changes in climatic variables. Studies have shown that the influence of human activities on mean and extreme temperatures can be detected at the global, continental, and subcontinental scales (Christidis et al 2005, Stott, et al 2011, Zwiers et al 2011, Wen et al 2013, Christidis and Stott, 2016, Kim et al 2016, Lu et al 2016, Yin et al 2017, Yin and Sun 2018). Christidis and Stott (2016) detected anthropogenic signals in the changes in 16 extreme temperature indices on the quasi-global scale and in Europe based on HadEX2 observation and one global climate model HadGEM2-ES. They found clear human influence on different characteristics of extremes during 1960–2010 but they also found that the anthropogenic signal could not be detected for frost days (FD), ice days (ID) and diurnal temperature range (DTR) in Europe. No significant trend for DTR appears in Europe although DTR generally displays a decreasing trend at the global scale (Thorne et al 2016). Recently, several studies have indicated that changes in temperature extremes and some extreme events in China can be attributed to human-induced forcing (Zwiers et al 2011, Morak et al 2013, Sun et al 2014, Lu et al 2016, Yin et al 2017, Sparrow et al 2018). Lu et al (2016) and Yin et al (2017) showed that anthropogenic influence can be detected in changes in the intensity and frequency of temperature extremes in China. Sun et al (2014) indicated that anthropogenic forcing increased the probability of extreme summer heat in East China. Overall, although the detection and attribution of regional climate change are more difficult than those at the global scale because of the reduced signal-to-noise ratio at regional scale (IPCC 2013), clear human influence has been found on climate change in some countries.
On the TP region, understanding the reasons behind the rapid changes in climate extremes is crucial for reliable future projections, and sets an important scientific basis for climate change policy making. To the best of our knowledge, detection and attribution studies to identify the role of human influence on regional mountainous areas are still lacking. In this study, we investigate the changes in temperature extremes on the TP and compare them with the model simulations from the CMIP5 experiments. We examine whether human influence has exerted a clear influence on the changes in a set of indices of temperature extremes defined by the ETCCDI. We also compare observational changes based on gridded data from Chinese stations and from the HadEX2 dataset (Donat et al 2013) so that the robustness of climate change on the TP can be evaluated. The structure of the paper is as follows. Section 2 shows the data and methods. The main results are provided in section 3. The discussion and conclusions are presented in section 4.
2. Data and methods
2.1. Observational data
The study focuses on the central and eastern TP because of the sparse station density on the western TP. We call the area the TP region hereafter. The observational data include daily maximum and minimum temperatures from 157 stations (figure 1) on the central and eastern TP from the China National Meteorological Information Center (NMIC) (available at http://data.cma.cn/). These data cover the period from 1951 to 2017, and have been controlled for quality and adjusted for homogeneity by Xu et al (2013). We use only the data after 1958 because of good quality and station density in this period.

Figure 1. Map of observation stations for the ChinaDEX (blue circles) and HadEX2 datasets (black crosses) and gridded boxes (red lines) on the Tibetan Plateau. Shaded areas indicate the topography (units: m). Black slashes indicate regions with anomalous values in some indices of the HadEX2 dataset.
Download figure:
Standard image High-resolution imageBased on these daily data, twelve extreme temperature indices (table 1) are calculated in each station following the ETCCDI definition (Zhang et al 2011) and are termed as ChinaDEX in this study. The anomalies of all the indices are calculated at each station relative to the 1961–1990 mean and then averaged onto a 2.5° × 3.75° latitude–longitude grid, which is consistent with the grid resolution for HadEX2 developed by Donat et al (2013) (https://climdex.org/gewocs.html). The extreme indices include 4 absolute intensity indices (TXx, TNx, TXn, and TNn), 4 percentile-based frequency indices (TX90p, TN90p, TX10p, and TN10p) and 3 fixed threshold exceedance indices (SU, FD, and ID) and the DTR. Among these indices, the absolute intensity indices represent the most extreme events and the percentile-based indices reflect the changes in the moderate extremes. The fixed threshold exceedances indices and DTR have substantial impacts on society, ecosystems and agriculture (Terando et al 2012, Cheng et al 2014). The 'number of tropical nights (TR)' is excluded because night-time temperatures hardly exceed 20 °C on the TP. The TR index includes too many small or zero values and is not reasonably covered for the TP region.
Table 1. Definitions of 12 temperature indices used in this study.
| Index | Descriptive name | Definition | Unit |
|---|---|---|---|
| TXx | Hottest day | The annual maxima of daily max temperature | °C |
| TNx | Warmest night | The annual maxima of daily min temperature | °C |
| TXn | Coldest day | The annual minima of daily max temperature | °C |
| TNn | Coldest night | The annual minima of daily min temperature | °C |
| TX90p | Warm days | Percentage of days when daily max temperature > 90th percentile of the base period | % |
| TN90p | Warm nights | Percentage of days when daily min temperature > 90th percentile of the base period | % |
| TN10p | Cool nights | Percentage of days when daily min temperature < 10th percentile of the base period | % |
| TX10p | Cool days | Percentage of days when daily max temperature < 10th percentile of the base period | % |
| SU | Summer days | Annual count when daily max temperature > 25 °C | Days |
| ID | Ice days | Annual count when daily max temperature < 0 °C | Days |
| FD | Frost days | Annual count when daily min temperature <0 °C | Days |
| DTR | Diurnal temperature range | Mean difference between daily max and min temperature | °C |
To test the robustness of different observational data for estimating climate change on the TP, the HadEX2 gridded extreme indices data during 1958–2010 are also used. There are 47 stations on the TP for HadEX2 (figure 1), which is much less than the ChinaDEX (157 stations). We present a comparison between ChinaDEX and HadEX2 during 1958–2010 in figure 4. In the other parts of our study, we will use ChinaDEX from 157 stations because the data have better spatial and temporal coverage than HadEX2. The trends of all the extreme indices on the TP during 1958–2017 are calculated using a nonparametric method (Sen 1968) and compared with those in the whole of China and East China.
2.2. Model data
The CMIP5 model simulations are used to estimate extreme temperature responses to external forcing and the role of natural internal variability (Taylor et al 2012). Sillmann et al (2013a, 2013b) calculated the ETCCDI indices based on daily data from the CMIP5 simulations. Here, we use the multi-model ensemble mean of 18 models from 82 historical runs driven by combined anthropogenic and natural forcing (ALL) and 6 models from 25 historical simulations driven by natural forcing only (NAT) (table 2). Because some CMIP5 historical simulations end in 2005, the RCP85 simulations for the years 2006–2017 are used to extend the data after 2005. The NAT simulations end in 2012 and there are no NAT simulations for subsequent years. To detect the influence of anthropogenic (ANT) forcing on recent climate change, we replicate the NAT simulation from 2008 to 2012 for the period of 2013–2017. This method should be reasonable because few volcanic eruptions in this period, and the error introduced by having the wrong solar forcing during 2013–2017 is expected to be small, too. Using 2005–2017 from RCP85 means that more than 20% of the time period is considered to have no NAT. We thus conduct a series of sensitivity tests to verify the robustness of detection results. We also use preindustrial control (CTL) simulations with no external forcing from 28 models to estimate the internal variability, in which only 7 models are available for DTR indices (table 2). All the models are interpolated onto the same 2.5° × 3.75° grid as the observations and then masked with the gridded observed temperature indices to mimic the availability of observational data in each grid. We compute the ensemble mean of all available models after calculating the ensemble means of all the runs from individual models. Then, regional averages are calculated based on the masked data.
Table 2. List of CMIP5 multi-model simulations used in this study. Numbers represent the ALL and NAT simulation ensemble sizes and the number of 60 year chunks for the CTL (preindustrial control) simulations.
| Model name | ALL(18) | NAT (6) | CTL(28) | CTL for DTR(7) |
|---|---|---|---|---|
| BCC-CSM1-1 | 3 | 8 | ||
| BCC-CSM1-1-m | 3 | 6 | 6 | |
| CanESM2 | 5 | 4 | 18 | |
| CCSM4 | 3 | 2 | ||
| CESM1-BGC | 8 | 8 | ||
| CMCC-CESM | 4 | 4 | ||
| CMCC-CM | 5 | 5 | ||
| CMCC-CMS | 8 | 8 | ||
| CMCC-CM5 | 14 | |||
| CNRM-CM5 | 10 | 6 | 14 | |
| CSIRO-Mk3-6-0 | 10 | 5 | 8 | |
| EC-EARTH | ||||
| FGOALS-s2 | 3 | 8 | ||
| GISS-E2-R | 3 | |||
| GFDL-CM3 | 13 | |||
| GFDL-ESM2G | 8 | |||
| GFDL-ESM2M | 8 | |||
| HADCM3 | 10 | |||
| HadGEM2-CC | 4 | |||
| HadGEM2-ES | 3 | 4 | 9 | |
| IPSL-CM5A-LR | 4 | 3 | 17 | |
| IPSL-CM5A-MR | 3 | 5 | ||
| IPSL-CM5B-LR | 5 | |||
| MIROC-ESM | 3 | |||
| MIROC5-ESM-CHEM | 4 | |||
| MIROC5-ESM | 10 | |||
| MIROC4H | 3 | 1 | ||
| MIROC5 | 5 | 11 | 11 | |
| MPI-ESM-LR | 3 | 17 | ||
| MPI-ESM-MR | 3 | 16 | ||
| MPI-ESM-P | 19 | |||
| MRI-CGCM3 | 5 | 8 | ||
| NorESM1-M | 3 | 8 | ||
| SUM (models) | 82(18) | 25(6) | 252(28) | 56(7) |
2.3. Methods
We use an optimal fingerprinting method based on generalized linear regression (Allen and Stott 2003, Ribes and Terray 2013) to quantify the influence of external forcings on observed climate change. The method expresses the observed value change (Y) as a function of the climate responses to the external forcings (X), which is expressed as: Y = (X − v) β + u. Here, u accounts for the regression residual and reflects the effect of internal variability. The scaling factor β is estimated using the total squares method (Allen and Stott 2003, Ribes and Terray 2013). v represents the noise in the signal that depends on the model ensemble size because the multi-model average may not be able to remove all vestiges of internal variability. The residual consistency test (Ribes and Terray 2013) is used to evaluate whether the model simulated variability is inconsistent with the regression residuals. In total we extract the 285 chunks of 60 year long segments from half of the CTL simulations and within-ensemble differences (i.e. the residuals of the ensemble simulations after the ensemble mean is removed) to estimate the scaling factor β, and the 90% confidence interval. Scaling factors whose 5th percentile is greater than zero imply a detectable signal at the 5% significance level. Moreover, we consider scaling factors with 90% ranges including unity to indicate good agreement between observations and model simulations.
Our detection analyses include single-signal and two-signal analysis to detect the relative influences of the different forcings on the observed changes. The single-signal analysis yields a regression between observations and multi-model mean responses of a single factor (ALL, ANT, and NAT) to estimate whether the observed changes are agree with individual external forcing or combined forcings effect. We estimate anthropogenic forcing as the difference between ALL and NAT responses from all available simulations. In the two-signal analysis, we conduct a regression of the observations onto ALL and NAT responses simultaneously, and then perform a linear transformation to estimate the relative contributions of ANT and NAT signals to the observations and to determine whether these two signals can be detected separately.
3. Results
3.1. Observed and simulated changes in temperature extremes on the TP
Based on the ChinaDEX data, the observed trends of twelve temperature extreme indices during 1958–2017 are illustrated in figure 2. The increasing warm extremes and decreasing cold extremes are consistent with global warming. The intensity (TXx and TNx) and frequency (TX90p and TN90p) of the warm extremes have increased and the corresponding indices (TXn, TNn, TX10p and TN10p) for the cold extremes have decreased. The changes in the intensity of the coldest extremes (TXn and TNn) are greater than those in the intensity of the warmest extremes (TXx and TNx). For the fixed threshold exceedances indices, FD and ID have been decreasing, and SU increasing. The DTR changes on the TP have obviously decreased mainly due to the rapid increase in the nighttime extremes. If one compares changes in the daytime and nighttime extremes, changes in the nighttime frequencies (TN10p and TN90p) are larger than those in the daytime frequencies (TX10p and TX90p), indicating larger changes in the nighttime temperature. Previous studies have shown similar changes for these indices in China (e.g. Dong et al 2018).
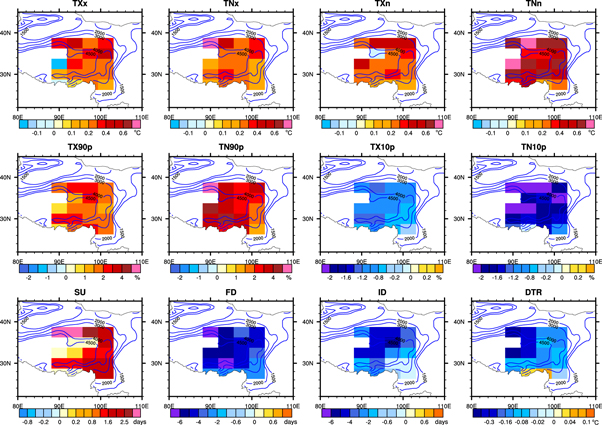
Figure 2. Geographical distribution of observed linear trends per decade in temperature extremes based on ChinaDEX data during 1958–2017 on the TP. The blue contours indicate the topographic elevations (units: m).
Download figure:
Standard image High-resolution imageFigure 3 provides a comparison of trends in temperature extremes between the TP and China as a whole and East China (all of China that is east of 105°E). Except for TXn and SU, the magnitudes of the linear trends of all the other indices on the TP are larger than those in China and in East China. This result indicates that the warming of temperature extremes on the TP is more than in the other regions. More intense, more frequent warm extremes and less intense, less frequent cold extremes have occurred. The FD and ID have decreased more than in the other regions in China. The possible reasons are related to the changes in surface albedo feedback, surface radiation fluxes or amounts of clouds above the TP (Rangwala et al 2013, Pepin et al 2015), but the exact reason is still unclear. Additionally, we find that there are larger differences in SU, FD, and ID between the TP and other regions than in the other indices. The daily maximum and minimum temperatures more easily exceed 0 °C (fixed threshold for FD and ID), while for SU, the daily maximum temperature hardly exceeds 25 °C in the center of the TP. These variations may lead to large differences in the SU, FD, and ID indices.
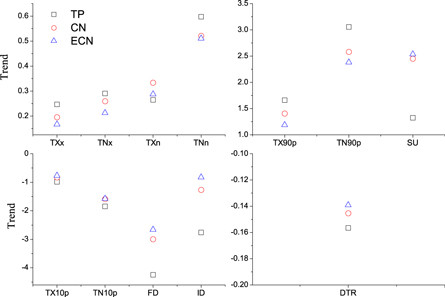
Figure 3. Linear trends in observed temperature extremes during 1958–2017 averaged over the Tibetan Plateau (TP: black squares), in China as a whole (CN: red circles), and in East China (ECN: blue triangles). The units of the trends are °C per decade for TXx, TNx, TXn , TNn and DTR; % of days per decade for TX90p, TN90p, TX10p, and TN10p; days per year for SU, FD, and ID.
Download figure:
Standard image High-resolution imageWe also compare the changes in temperature extremes averaged on the TP from two observational datasets ChinaDEX and HadEX2 (figure 4). Note that HadEX2 covers only the period from 1958 to 2010. Generally, these two datasets correspond well for frequency indices, while the differences between the two datasets are obvious for other indices. We find that HadEX2 has some anomalous values in the southwestern part of the TP (black slash grid boxes in figure 1). When we include these grid boxes in regional averages, the HadEX2 time series show large changes in several indices, including intensity indices, SU and FD. If we omit these data from our regional average, the HadEX2 values show very good consistency with ChinaDEX (figure 4). The southwestern part of the TP has only 5 stations for HadEX2. We suspect that this large difference is due to very sparse station density and the related nonclimatic inhomogeneities in HadEX2 (Dunn et al 2014). For SU and FD indices there are some very high correlation among stations and very low variances. Correlations are not calculated if no data are present, so that the coverage can look different to other indices (Dunn et al 2014). These results indicate that the estimates of climate changes on the TP are affected by the data coverage in space and time and that different datasets may provide very different results. This possibility raises a caveat about the uncertainty of different observational datasets in analysing climate change in the data-sparse region.

Figure 4. The changes in temperature extremes averaged on the TP during 1958–2010 from two original observational datasets based on ChinaDEX (black solid lines) and HadEX2 (red solid lines) and the changes with five anomalous values removed from the observational datasets ChinaDEX (black dashed lines) and HadEX2 (black dashed lines).
Download figure:
Standard image High-resolution imageThe model simulated linear trends during 1958–2017 for all the indices are shown in figures 5 and 6 based on multi-model ensemble mean from the ALL and NAT forcing experiments, respectively. For ALL forcing experiments (figure 5), the model-simulated trends reproduce the observed changes well. The absolute intensity and frequency of warm extremes have increased, while cold extremes have become less intense and less frequent. However, the models generally underestimate the observed amplitudes of trends (figure 2) for most indices, especially for cold extremes. The model-simulated spatial patterns are more uniform than the observations, indicating small variability and slight regional differences from the model-ensemble mean. On the other hand, the NAT patterns (figure 6) show slightly increasing trends for the warm extremes and decreasing trends for the cold extremes, which is consistent with the observations but with much smaller magnitude. It suggests a positive effect of NAT forcing on the changes in temperature extremes in the region.
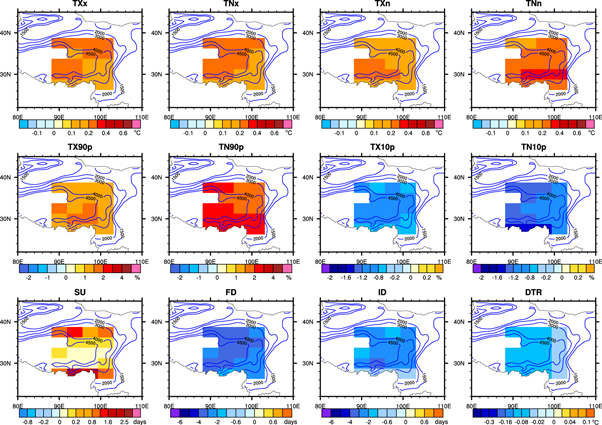
Figure 5. Same as figure 2 but for trends in model response to ALL forcings. Model trends are computed based on the multi-model ensemble mean.
Download figure:
Standard image High-resolution image
Figure 6. Same as figure 2 but for trends in model response to NAT forcings. Model trends are computed based on the multi-model ensemble mean.
Download figure:
Standard image High-resolution imageThe 5 year mean series of observational and model-simulated extreme temperature indices are shown in figure 7. The model-simulated long-term changes in these temperature extremes under ALL forcing are similar to the observations. For most of the indices, however, the simulated changes in absolute intensity, frequency and the fixed threshold exceedance indices are smaller than the observations, especially for the cold extremes, which are consistent with figures 2, 5, 6. This underestimation by model simulations may imply that the projected future changes in temperature extremes on the TP based on these multi-model ensembles are underestimated. The 90% ranges of ALL forcing runs (pink shading in figure 7) almost fully cover the observational changes, suggesting good performance of the models in simulating these indices. The observations are more similar to the simulated response to ANT forcing than that to NAT forcing alone, but the NAT simulations show small and positive contributions to the observed changes.

Figure 7. Five-year mean anomaly (relative to 1961–1990) time series of twelve extreme temperature indices from ChinaDEX (black lines) and multi-model ensembles on the TP under ALL forcing (red lines) and NAT forcing (blue lines) during 1958–2017. Shading shows the 5%–95% ranges of the individual model simulations.
Download figure:
Standard image High-resolution image3.2. Detection results
We investigate the effects of external forcings on the observed spatiotemporal evolution of temperature extremes during 1958–2017 using an optimal fingerprinting method. Figure 8 shows scaling factors and their 90% confidence intervals for ALL, ANT and NAT forcings based on single-signal detection analyses. For all indices, both ALL and ANT signals are robustly detected on the TP. The confidence intervals of the scaling factors are generally smaller than those of the detection results in China (Lu et al 2016, Yin et al 2017, Yin and Sun 2018). The residual consistency tests are generally passed, suggesting a good consistency between observed and model-simulated variability, and the models do not miss any important forcings and/or responses to them. Without having analyses on the response to greenhouse gas and other anthropogenic forcing agents, in particular aerosols, in isolation, we speculate that aerosol forcing might be less important here than elsewhere so that the large uncertainties associated with it are less relevant here, a hypothesis that would need further research to scrutinize.
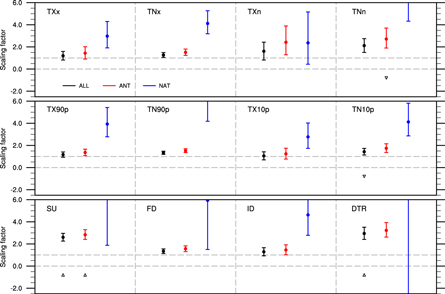
Figure 8. Best estimates of the scaling factors and their 5%–95% confidence intervals from single-signal analyses from 1958 to 2017 for the TP. The black upward and downward triangles indicate that the model simulations overestimate or underestimate the observed variabilities, respectively, according to the residual consistency test.
Download figure:
Standard image High-resolution imageFor the intensity indices, the best estimates of scaling factors are close to unity for warm extremes (TXx and TNx), while they are greater than unity for cold extremes (TXn and TNn). These results indicate a good agreement between the observations and the forced responses of the models for the intensity of warm extremes and underestimation by model simulations for the intensity of cold extremes. These results are similar to the detection results of the intensity indices in other regions (Zwiers et al 2011, Kim et al 2016, Yin et al 2017, Dong et al 2018).
For the frequency and fixed threshold indices, both ALL and ANT signals can be clearly detected. The best estimates of the scaling factors are very close to or slightly larger than unity, indicating good agreement between observations and models or underestimation of the changes by the model simulations. The confidence intervals for the frequency indices are very small, indicating small uncertainties of the detection results. The residual consistency tests are passed except for TN10p, SU and DTR. For these three indices, the models underestimate the observed variability for TN10p and overestimate the observed variability for the SU and DTR, respectively. The smaller variability in the models implies that the models miss some physical process responsible for these kinds of extremes or they misinterpret some of the internal variability as a forced response. The detection results for ANT are similar to those for ALL but have larger confidence intervals. The NAT signal is detected for most extreme indices on the TP, although the 90% confidence intervals for the scaling factor have larger uncertainty ranges.
The scaling factors and their confidence intervals based on two-signal regression analyses are shown in figure 9. The ANT signal can be detected in all the indices while the NAT signal can be detected for most indices during 1958–2017. For the intensity indices, both the ANT and NAT signals are detected separately for warm extremes, but the NAT signal cannot be detected for cold extremes. This difference suggests a dominant influence of ANT forcing on the cold extremes. Similar to the single-signal results, the best estimates of scaling factors for ANT forcing are close to unity for the warm extremes while they are greater than unity for the cold extremes. For all the frequency and fixed threshold exceedances indices, the ANT and NAT signals are separately detected. The best estimates of the scaling factors are generally close to or greater than unity. The residual consistency tests are passed for most indices except for TN10p and DTR, in which model simulations have smaller variability for TN10p and larger variability for DTR than the observations, respectively. These results show good consistency with the single-signal results and provide clear evidence of human influence on the temperature extremes on the TP.

Figure 9. Best estimates of the scaling factors and their 5%–95% confidence intervals from two-signal analyses from 1958 to 2017 for the TP. The black upward and downward triangles indicate that the model simulations overestimate or underestimate the observed variabilities, respectively, according to the residual consistency test.
Download figure:
Standard image High-resolution imageThe attributable contributions from different external forcings to the observed trends are shown in figure 10. The attributable trends are estimated as the linear trends in the signal from model simulations multiplied by the corresponding scaling factors. During 1958–2017, the observed changes in TXx, TNx, TXn, and TNn are 1.6 °C, 1.7 °C, 1.8 °C, and 3.5 °C, respectively. The median values for the contribution of ANT signal to these observed changes are 70%, 76%, 89%, and 95%, respectively. For the frequency indices TX90p, TN90p TX10p and TN10p, the median values from ANT contributions are 87%, 88%, 62%, and 85%, respectively. The observed changes in SU, FD, ID and DTR are 8.7 d, −26 d, −17 d and −1 °C, respectively and the median values of the ANT contribution explain 87%, 86%, 84% and 108% of these changes, respectively. NAT contributions are less than 15% for all the extreme indices except for TXx, TNx, and TX10p, in which NAT explains 30%, 24% and 38% of the changes, respectively. Note that these numbers are a lower limit but not necessarily good estimate of the contribution of natural forcing due to our unrealistic assumption of natural forcing during 2013–2017 to be same as in the period before. Compared with the results of previous studies across China (Lu et al 2016, Yin et al 2017, Yin and Sun 2018), the NAT influences on the TP are slightly larger than those in China.

Figure 10. Attributable contributions and their 5%–95% confidence intervals for the temperature extreme indices on the TP. The trends for observations are estimated by linear least squares regression. The attributable contributions for ALL are estimated based on one-signal analyses, while those for ANT and NAT are based on two-signal analyses involving ANT and NAT.
Download figure:
Standard image High-resolution image
To evaluate the robustness of the detection results, we conduct a series of sensitivity tests (supplementary figure S1 and S2 is available online at stacks.iop.org/ERL/14/124015/mmedia). First, we test the sensitivity of detection and attribution results to the analysis period, since we use RCP85 data to extend the model simulations and replicate the 2013–2017 NAT results with the 2008–2012 model simulations. We redo all the analyses in different periods, including the periods from 1958 to 2005 and 1958–2012. We find that for both single- and two-signal analyses, the detection results for ANT are similar but that the detection of the NAT signal is affected by the studied time period for some indices, including the intensity and frequency of warm extremes, TN10p and fixed threshold exceedance indices. However, for the two-signal detection results during 1958–2012 from the same model subset under ALL and NAT forcing, only NAT is not detected anymore for the intensity of cold extremes, TX90p, TN10p, and ID. This justifies the robustness of our detection results. Second, we test the sensitivity of our results to different model ensembles, since we use all the available model runs for ALL and NAT experiments, and the number of runs and models for ALL and NAT do not exactly correspond. We redo all the analyses using the models that have the same ALL and NAT experiments. The detection results using signals from the same subset of models are quite similar to the results from all available model runs for most indices. However, we find that the detection for a few indices is affected by the choice of models and consequently the estimate of the naturally forced signal, especially when the studied time period is short. This outcome implies that our results are generally robust but affected by the caveats of using differing natural estimates for NAT than included in ALL, and by having wrong NAT forcing from 2005 onwards. In a longer period with more signals, the influences of ANT and NAT signals are more easily detected than those in a shorter period. With the improvement of data availability, including longer observation as well as model simulations, more studies are required to further scrutinize our results.
4. Discussion and conclusion
The rapid warming on the TP since the 1950s has exerted important influence on the regional ecosystem. Here, we investigate changes in temperature extremes on the TP based on homogenized Chinese station data, including the absolute intensity, frequency of warm and cold extremes and fixed threshold exceedance indices. We find that all these extreme indices show clear warming features. The TP region has experienced more intense and more frequent warm extremes and less intense, less frequent cold extremes since the late 1950s. All these changes in the extremes on the TP are larger than those in the other regions of China. We also compare the results based on ChinaDEX and HadEX2 and find that the changes in temperature extremes from the two observational datasets are quite different for some indices. This result presents an urgent need for high-quality observational data in the data-sparse region.
Based on an optimal fingerprinting method, we compare observed changes in these indices with model simulations. To identify human influence on the temperature extremes, we conduct single- and two-signal detection analyses. Despite application to a small-scale region with the highest terrain globally, the models reproduce the observed changes quite well. Models show good consistency with the observations or underestimate the observed changes for some indices, especially cold extremes. The ALL and ANT signals are clearly detected in the changes in intensity, frequency, and fixed threshold exceedance indices and in the DTR. The natural signal can be detected for most indices even without realistic forcing from 2005 to 2017 and thus indicates an influence of NAT forcing on the temperature extremes, although much smaller than ANT as shown by the respective attributable contributions. These results provide clear evidence of human influence on the temperature extremes in the TP region. The underestimation of observed changed by models for some indices indicates that the region may experience more extreme events than the raw projections based on these models. However, to obtain a better understanding of climate change on the TP, more detailed research is still necessary, including analyses of contributions from individual anthropogenic forcings such as GHGs, aerosols, and land use.
Acknowledgments
We thank Dathi Stone and an anonymous reviewer for their insightful and very helpful comments. We acknowledge the Program for Climate Model Diagnosis and Intercomparison and the Working Group on Coupled Modeling of the World Climate Research Programme (WCRP) for their roles in making the WCRP CMIP multi-model datasets available. This study is supported by the National Key R&D Program of China (2018YFA0605604, 2018YFC1507702), the National Science Foundation of China (41675074) and Climate Change Project (CCSF201920), MGD has received funding by the Spanish Ministry for the Economy, Industry and Competitiveness Ramón y Cajal 2017 grant reference RYC-2017-22964. We thank the China National Meteorological Information Center for archiving the observational data (available at http://data.cma.cn/).
Data availability
The data that support the findings of this study are available from the corresponding author upon reasonable request.